Indian (Asian) 3 or more Vehicles in Household
COMPARE
Indian (Asian)
Select to Compare
3 or more Vehicles in Household
Indian (Asian) 3 or more Vehicles in Household
19.1%
3+ VEHICLES AVAILABLE
26.0/ 100
METRIC RATING
189th/ 347
METRIC RANK
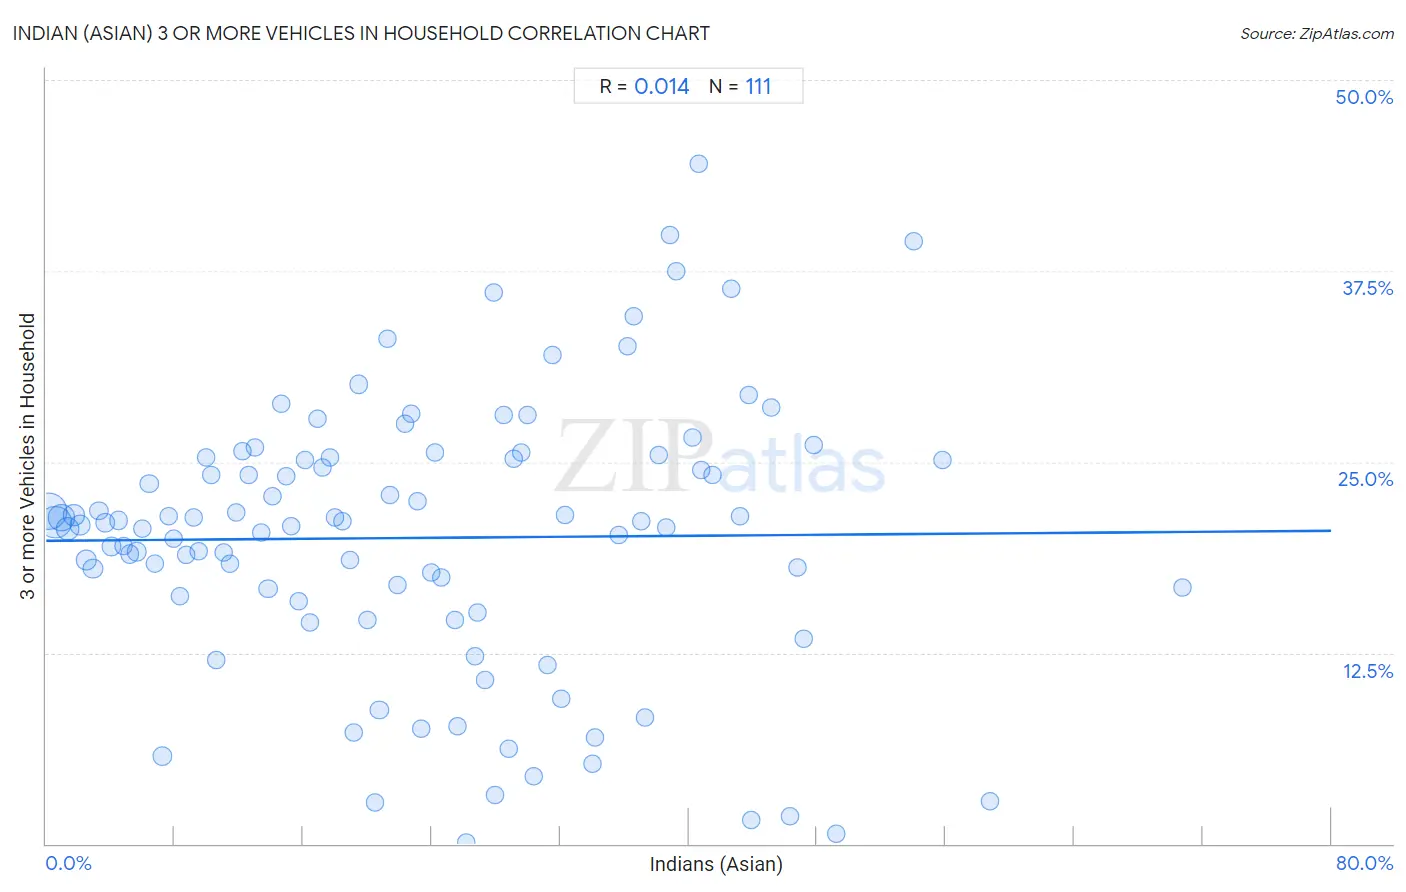
Indian (Asian) 3 or more Vehicles in Household Correlation Chart
The statistical analysis conducted on geographies consisting of 494,546,924 people shows no correlation between the proportion of Indians (Asian) and percentage of households with 3 or more vehicles available in the United States with a correlation coefficient (R) of 0.014 and weighted average of 19.1%. On average, for every 1% (one percent) increase in Indians (Asian) within a typical geography, there is an increase of 0.0081% in percentage of households with 3 or more vehicles available.
It is essential to understand that the correlation between the percentage of Indians (Asian) and percentage of households with 3 or more vehicles available does not imply a direct cause-and-effect relationship. It remains uncertain whether the presence of Indians (Asian) influences an upward or downward trend in the level of percentage of households with 3 or more vehicles available within an area, or if Indians (Asian) simply ended up residing in those areas with higher or lower levels of percentage of households with 3 or more vehicles available due to other factors.
Demographics Similar to Indians (Asian) by 3 or more Vehicles in Household
In terms of 3 or more vehicles in household, the demographic groups most similar to Indians (Asian) are Immigrants from Kuwait (19.1%, a difference of 0.010%), Immigrants from Zimbabwe (19.1%, a difference of 0.050%), South American Indian (19.1%, a difference of 0.070%), Kenyan (19.1%, a difference of 0.13%), and Tsimshian (19.1%, a difference of 0.16%).
| Demographics | Rating | Rank | 3 or more Vehicles in Household |
| Cubans | 36.6 /100 | #182 | Fair 19.3% |
| Cajuns | 36.0 /100 | #183 | Fair 19.3% |
| Latvians | 35.7 /100 | #184 | Fair 19.3% |
| Immigrants from Sri Lanka | 30.7 /100 | #185 | Fair 19.2% |
| Immigrants from Sweden | 29.0 /100 | #186 | Fair 19.2% |
| Immigrants from Hong Kong | 28.3 /100 | #187 | Fair 19.2% |
| Immigrants from Kuwait | 26.1 /100 | #188 | Fair 19.1% |
| Indians (Asian) | 26.0 /100 | #189 | Fair 19.1% |
| Immigrants from Zimbabwe | 25.5 /100 | #190 | Fair 19.1% |
| South American Indians | 25.4 /100 | #191 | Fair 19.1% |
| Kenyans | 24.7 /100 | #192 | Fair 19.1% |
| Tsimshian | 24.4 /100 | #193 | Fair 19.1% |
| Serbians | 24.0 /100 | #194 | Fair 19.1% |
| Immigrants from Moldova | 23.6 /100 | #195 | Fair 19.1% |
| Central American Indians | 22.2 /100 | #196 | Fair 19.0% |
Indian (Asian) 3 or more Vehicles in Household Correlation Summary
| Measurement | Indian (Asian) Data | 3 or more Vehicles in Household Data |
| Minimum | 0.19% | 0.12% |
| Maximum | 70.7% | 44.5% |
| Range | 70.6% | 44.4% |
| Mean | 23.2% | 20.0% |
| Median | 21.4% | 21.0% |
| Interquartile 25% (IQ1) | 10.6% | 15.9% |
| Interquartile 75% (IQ3) | 34.1% | 25.3% |
| Interquartile Range (IQR) | 23.5% | 9.4% |
| Standard Deviation (Sample) | 15.2% | 8.9% |
| Standard Deviation (Population) | 15.1% | 8.9% |
Correlation Details
| Indian (Asian) Percentile | Sample Size | 3 or more Vehicles in Household |
[ 0.0% - 0.5% ] 0.19% | 140,485,214 | 21.8% |
[ 0.5% - 1.0% ] 0.57% | 108,159,667 | 21.1% |
[ 0.5% - 1.0% ] 0.95% | 62,695,846 | 21.4% |
[ 1.0% - 1.5% ] 1.34% | 36,209,982 | 20.6% |
[ 1.5% - 2.0% ] 1.72% | 25,887,372 | 21.5% |
[ 2.0% - 2.5% ] 2.11% | 17,512,501 | 20.8% |
[ 2.5% - 3.0% ] 2.51% | 18,090,905 | 18.6% |
[ 2.5% - 3.0% ] 2.91% | 11,434,971 | 18.0% |
[ 3.0% - 3.5% ] 3.29% | 6,931,114 | 21.8% |
[ 3.5% - 4.0% ] 3.67% | 5,974,702 | 21.0% |
[ 4.0% - 4.5% ] 4.08% | 5,820,448 | 19.5% |
[ 4.0% - 4.5% ] 4.48% | 3,411,585 | 21.2% |
[ 4.5% - 5.0% ] 4.83% | 3,299,652 | 19.5% |
[ 5.0% - 5.5% ] 5.22% | 4,110,107 | 19.0% |
[ 5.5% - 6.0% ] 5.64% | 2,344,475 | 19.1% |
[ 5.5% - 6.0% ] 6.00% | 2,211,291 | 20.6% |
[ 6.0% - 6.5% ] 6.42% | 1,647,020 | 23.6% |
[ 6.5% - 7.0% ] 6.77% | 1,854,545 | 18.3% |
[ 7.0% - 7.5% ] 7.25% | 10,870,587 | 5.7% |
[ 7.5% - 8.0% ] 7.61% | 1,066,887 | 21.5% |
[ 7.5% - 8.0% ] 7.95% | 1,282,948 | 20.0% |
[ 8.0% - 8.5% ] 8.35% | 1,285,701 | 16.2% |
[ 8.5% - 9.0% ] 8.71% | 1,888,285 | 18.9% |
[ 9.0% - 9.5% ] 9.15% | 713,810 | 21.4% |
[ 9.5% - 10.0% ] 9.51% | 770,148 | 19.2% |
[ 9.5% - 10.0% ] 9.99% | 1,442,546 | 25.3% |
[ 10.0% - 10.5% ] 10.30% | 419,381 | 24.1% |
[ 10.5% - 11.0% ] 10.62% | 417,648 | 12.1% |
[ 11.0% - 11.5% ] 11.04% | 685,850 | 19.0% |
[ 11.0% - 11.5% ] 11.44% | 566,419 | 18.4% |
[ 11.5% - 12.0% ] 11.84% | 714,322 | 21.7% |
[ 12.0% - 12.5% ] 12.19% | 770,160 | 25.7% |
[ 12.5% - 13.0% ] 12.63% | 680,048 | 24.2% |
[ 13.0% - 13.5% ] 13.00% | 443,964 | 25.9% |
[ 13.0% - 13.5% ] 13.42% | 230,398 | 20.4% |
[ 13.5% - 14.0% ] 13.81% | 336,669 | 16.7% |
[ 14.0% - 14.5% ] 14.09% | 536,252 | 22.8% |
[ 14.5% - 15.0% ] 14.60% | 194,943 | 28.8% |
[ 14.5% - 15.0% ] 14.93% | 465,640 | 24.0% |
[ 15.0% - 15.5% ] 15.27% | 749,241 | 20.8% |
[ 15.5% - 16.0% ] 15.71% | 460,901 | 15.9% |
[ 16.0% - 16.5% ] 16.08% | 276,336 | 25.2% |
[ 16.0% - 16.5% ] 16.41% | 506,164 | 14.5% |
[ 16.5% - 17.0% ] 16.89% | 419,225 | 27.8% |
[ 17.0% - 17.5% ] 17.21% | 102,809 | 24.6% |
[ 17.5% - 18.0% ] 17.63% | 332,971 | 25.3% |
[ 17.5% - 18.0% ] 17.97% | 636,373 | 21.3% |
[ 18.0% - 18.5% ] 18.43% | 527,450 | 21.2% |
[ 18.5% - 19.0% ] 18.87% | 338,253 | 18.6% |
[ 19.0% - 19.5% ] 19.11% | 110,633 | 7.3% |
[ 19.0% - 19.5% ] 19.48% | 319,065 | 30.1% |
[ 20.0% - 20.5% ] 20.02% | 795,534 | 14.7% |
[ 20.0% - 20.5% ] 20.43% | 107,024 | 2.7% |
[ 20.5% - 21.0% ] 20.74% | 236,857 | 8.7% |
[ 21.0% - 21.5% ] 21.21% | 66,476 | 33.0% |
[ 21.0% - 21.5% ] 21.41% | 203,886 | 22.9% |
[ 21.5% - 22.0% ] 21.85% | 64,946 | 17.0% |
[ 22.0% - 22.5% ] 22.30% | 76,137 | 27.5% |
[ 22.5% - 23.0% ] 22.71% | 133,398 | 28.1% |
[ 23.0% - 23.5% ] 23.09% | 144,601 | 22.4% |
[ 23.0% - 23.5% ] 23.36% | 862,624 | 7.5% |
[ 23.5% - 24.0% ] 23.95% | 60,815 | 17.7% |
[ 24.0% - 24.5% ] 24.23% | 181,482 | 25.6% |
[ 24.5% - 25.0% ] 24.58% | 45,466 | 17.4% |
[ 25.0% - 25.5% ] 25.46% | 58,529 | 14.7% |
[ 25.5% - 26.0% ] 25.62% | 91,833 | 7.7% |
[ 26.0% - 26.5% ] 26.11% | 23,343 | 0.12% |
[ 26.5% - 27.0% ] 26.69% | 50,734 | 12.3% |
[ 26.5% - 27.0% ] 26.85% | 88,531 | 15.1% |
[ 27.0% - 27.5% ] 27.32% | 29,394 | 10.7% |
[ 27.5% - 28.0% ] 27.87% | 124,609 | 36.1% |
[ 27.5% - 28.0% ] 27.93% | 52,707 | 3.2% |
[ 28.0% - 28.5% ] 28.48% | 108,577 | 28.1% |
[ 28.5% - 29.0% ] 28.77% | 46,424 | 6.3% |
[ 29.0% - 29.5% ] 29.13% | 128,689 | 25.2% |
[ 29.5% - 30.0% ] 29.57% | 90,121 | 25.6% |
[ 29.5% - 30.0% ] 29.99% | 90,534 | 28.1% |
[ 30.0% - 30.5% ] 30.34% | 118,437 | 4.5% |
[ 31.0% - 31.5% ] 31.18% | 19,928 | 11.7% |
[ 31.5% - 32.0% ] 31.53% | 48,930 | 32.0% |
[ 32.0% - 32.5% ] 32.10% | 38,554 | 9.5% |
[ 32.0% - 32.5% ] 32.32% | 98,730 | 21.5% |
[ 34.0% - 34.5% ] 34.02% | 135,971 | 5.3% |
[ 34.0% - 34.5% ] 34.14% | 43,304 | 7.0% |
[ 35.5% - 36.0% ] 35.63% | 80,880 | 20.2% |
[ 36.0% - 36.5% ] 36.18% | 65,922 | 32.6% |
[ 36.5% - 37.0% ] 36.54% | 31,986 | 34.5% |
[ 37.0% - 37.5% ] 37.05% | 62,692 | 21.1% |
[ 37.0% - 37.5% ] 37.29% | 140,984 | 8.3% |
[ 38.0% - 38.5% ] 38.11% | 129,504 | 25.4% |
[ 38.5% - 39.0% ] 38.57% | 115,076 | 20.7% |
[ 38.5% - 39.0% ] 38.86% | 85,525 | 39.9% |
[ 39.0% - 39.5% ] 39.20% | 7,786 | 37.5% |
[ 40.0% - 40.5% ] 40.23% | 23,014 | 26.6% |
[ 40.5% - 41.0% ] 40.62% | 28,212 | 44.5% |
[ 40.5% - 41.0% ] 40.74% | 2,852 | 24.5% |
[ 41.5% - 42.0% ] 41.51% | 33,937 | 24.1% |
[ 42.5% - 43.0% ] 42.62% | 60,364 | 36.3% |
[ 43.0% - 43.5% ] 43.21% | 83,114 | 21.4% |
[ 43.5% - 44.0% ] 43.76% | 91,781 | 29.4% |
[ 43.5% - 44.0% ] 43.92% | 25,460 | 1.6% |
[ 45.0% - 45.5% ] 45.16% | 37,340 | 28.5% |
[ 46.0% - 46.5% ] 46.32% | 557 | 1.8% |
[ 46.5% - 47.0% ] 46.81% | 329 | 18.1% |
[ 47.0% - 47.5% ] 47.13% | 89,536 | 13.4% |
[ 47.5% - 48.0% ] 47.81% | 96,393 | 26.1% |
[ 49.0% - 49.5% ] 49.15% | 12,070 | 0.62% |
[ 54.0% - 54.5% ] 54.04% | 25,001 | 39.4% |
[ 55.5% - 56.0% ] 55.81% | 26,418 | 25.1% |
[ 58.5% - 59.0% ] 58.72% | 79,495 | 2.8% |
[ 70.5% - 71.0% ] 70.75% | 147 | 16.8% |