Indian (Asian) 2 or more Vehicles in Household
COMPARE
Indian (Asian)
Select to Compare
2 or more Vehicles in Household
Indian (Asian) 2 or more Vehicles in Household
53.1%
2+ VEHICLES AVAILABLE
1.7/ 100
METRIC RATING
244th/ 347
METRIC RANK
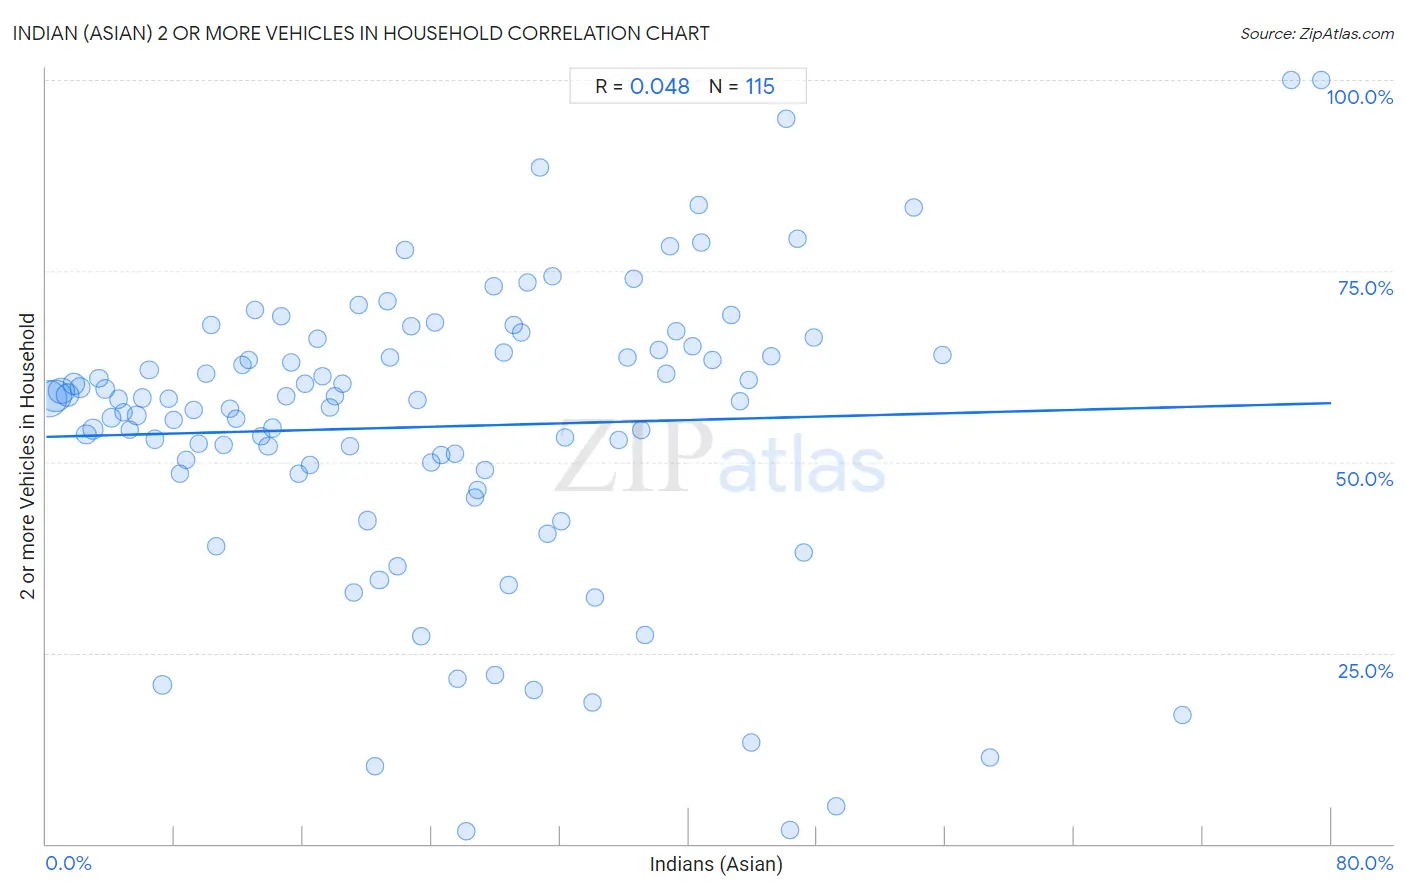
Indian (Asian) 2 or more Vehicles in Household Correlation Chart
The statistical analysis conducted on geographies consisting of 494,844,203 people shows no correlation between the proportion of Indians (Asian) and percentage of households with 2 or more vehicles available in the United States with a correlation coefficient (R) of 0.048 and weighted average of 53.1%. On average, for every 1% (one percent) increase in Indians (Asian) within a typical geography, there is an increase of 0.055% in percentage of households with 2 or more vehicles available.
It is essential to understand that the correlation between the percentage of Indians (Asian) and percentage of households with 2 or more vehicles available does not imply a direct cause-and-effect relationship. It remains uncertain whether the presence of Indians (Asian) influences an upward or downward trend in the level of percentage of households with 2 or more vehicles available within an area, or if Indians (Asian) simply ended up residing in those areas with higher or lower levels of percentage of households with 2 or more vehicles available due to other factors.
Demographics Similar to Indians (Asian) by 2 or more Vehicles in Household
In terms of 2 or more vehicles in household, the demographic groups most similar to Indians (Asian) are Ethiopian (53.1%, a difference of 0.040%), Immigrants from Ethiopia (53.0%, a difference of 0.12%), Immigrants from Eastern Asia (53.2%, a difference of 0.23%), Immigrants from Sierra Leone (53.2%, a difference of 0.24%), and Immigrants from Europe (53.2%, a difference of 0.26%).
| Demographics | Rating | Rank | 2 or more Vehicles in Household |
| Macedonians | 2.4 /100 | #237 | Tragic 53.3% |
| Immigrants from Armenia | 2.3 /100 | #238 | Tragic 53.3% |
| Cambodians | 2.3 /100 | #239 | Tragic 53.3% |
| Immigrants from Europe | 2.1 /100 | #240 | Tragic 53.2% |
| Immigrants from Sierra Leone | 2.1 /100 | #241 | Tragic 53.2% |
| Immigrants from Eastern Asia | 2.1 /100 | #242 | Tragic 53.2% |
| Ethiopians | 1.7 /100 | #243 | Tragic 53.1% |
| Indians (Asian) | 1.7 /100 | #244 | Tragic 53.1% |
| Immigrants from Ethiopia | 1.5 /100 | #245 | Tragic 53.0% |
| Immigrants from Nigeria | 1.2 /100 | #246 | Tragic 52.9% |
| Sierra Leoneans | 1.2 /100 | #247 | Tragic 52.9% |
| Colombians | 1.1 /100 | #248 | Tragic 52.9% |
| Immigrants from Brazil | 1.0 /100 | #249 | Tragic 52.8% |
| Mongolians | 1.0 /100 | #250 | Tragic 52.8% |
| Immigrants from Sudan | 1.0 /100 | #251 | Tragic 52.8% |
Indian (Asian) 2 or more Vehicles in Household Correlation Summary
| Measurement | Indian (Asian) Data | 2 or more Vehicles in Household Data |
| Minimum | 0.19% | 1.7% |
| Maximum | 79.4% | 100.0% |
| Range | 79.2% | 98.3% |
| Mean | 24.4% | 54.6% |
| Median | 22.3% | 58.2% |
| Interquartile 25% (IQ1) | 11.0% | 49.0% |
| Interquartile 75% (IQ3) | 36.2% | 64.6% |
| Interquartile Range (IQR) | 25.1% | 15.6% |
| Standard Deviation (Sample) | 16.7% | 19.2% |
| Standard Deviation (Population) | 16.6% | 19.2% |
Correlation Details
| Indian (Asian) Percentile | Sample Size | 2 or more Vehicles in Household |
[ 0.0% - 0.5% ] 0.19% | 140,511,896 | 58.3% |
[ 0.5% - 1.0% ] 0.57% | 108,183,564 | 58.7% |
[ 0.5% - 1.0% ] 0.95% | 62,714,691 | 59.3% |
[ 1.0% - 1.5% ] 1.34% | 36,234,124 | 58.8% |
[ 1.5% - 2.0% ] 1.72% | 25,890,595 | 60.2% |
[ 2.0% - 2.5% ] 2.11% | 17,526,339 | 59.8% |
[ 2.5% - 3.0% ] 2.51% | 18,095,204 | 53.6% |
[ 2.5% - 3.0% ] 2.91% | 11,435,823 | 54.3% |
[ 3.0% - 3.5% ] 3.29% | 6,934,662 | 61.0% |
[ 3.5% - 4.0% ] 3.67% | 5,982,567 | 59.6% |
[ 4.0% - 4.5% ] 4.08% | 5,824,332 | 55.7% |
[ 4.0% - 4.5% ] 4.48% | 3,411,585 | 58.2% |
[ 4.5% - 5.0% ] 4.83% | 3,307,334 | 56.5% |
[ 5.0% - 5.5% ] 5.22% | 4,110,371 | 54.2% |
[ 5.5% - 6.0% ] 5.64% | 2,344,475 | 56.1% |
[ 5.5% - 6.0% ] 6.00% | 2,219,929 | 58.4% |
[ 6.0% - 6.5% ] 6.42% | 1,653,745 | 62.0% |
[ 6.5% - 7.0% ] 6.77% | 1,855,857 | 53.0% |
[ 7.0% - 7.5% ] 7.25% | 10,877,088 | 20.8% |
[ 7.5% - 8.0% ] 7.61% | 1,073,076 | 58.3% |
[ 7.5% - 8.0% ] 7.95% | 1,294,937 | 55.4% |
[ 8.0% - 8.5% ] 8.35% | 1,285,701 | 48.4% |
[ 8.5% - 9.0% ] 8.71% | 1,904,030 | 50.3% |
[ 9.0% - 9.5% ] 9.15% | 717,546 | 56.8% |
[ 9.5% - 10.0% ] 9.51% | 775,921 | 52.3% |
[ 9.5% - 10.0% ] 9.99% | 1,473,847 | 61.6% |
[ 10.0% - 10.5% ] 10.30% | 419,381 | 68.0% |
[ 10.5% - 11.0% ] 10.62% | 417,648 | 39.0% |
[ 11.0% - 11.5% ] 11.04% | 689,816 | 52.3% |
[ 11.0% - 11.5% ] 11.44% | 566,419 | 57.0% |
[ 11.5% - 12.0% ] 11.84% | 714,372 | 55.6% |
[ 12.0% - 12.5% ] 12.19% | 770,160 | 62.6% |
[ 12.5% - 13.0% ] 12.63% | 681,596 | 63.4% |
[ 13.0% - 13.5% ] 13.00% | 446,053 | 69.9% |
[ 13.0% - 13.5% ] 13.42% | 230,398 | 53.4% |
[ 13.5% - 14.0% ] 13.81% | 336,669 | 52.1% |
[ 14.0% - 14.5% ] 14.09% | 552,650 | 54.4% |
[ 14.5% - 15.0% ] 14.59% | 202,223 | 69.0% |
[ 14.5% - 15.0% ] 14.93% | 469,153 | 58.6% |
[ 15.0% - 15.5% ] 15.27% | 749,333 | 63.0% |
[ 15.5% - 16.0% ] 15.71% | 460,901 | 48.4% |
[ 16.0% - 16.5% ] 16.08% | 276,336 | 60.2% |
[ 16.0% - 16.5% ] 16.40% | 515,007 | 49.6% |
[ 16.5% - 17.0% ] 16.89% | 420,482 | 66.2% |
[ 17.0% - 17.5% ] 17.21% | 102,809 | 61.2% |
[ 17.5% - 18.0% ] 17.63% | 332,971 | 57.2% |
[ 17.5% - 18.0% ] 17.97% | 641,695 | 58.6% |
[ 18.0% - 18.5% ] 18.43% | 527,450 | 60.2% |
[ 18.5% - 19.0% ] 18.87% | 338,253 | 52.0% |
[ 19.0% - 19.5% ] 19.11% | 119,017 | 32.9% |
[ 19.0% - 19.5% ] 19.48% | 319,065 | 70.5% |
[ 20.0% - 20.5% ] 20.02% | 795,534 | 42.3% |
[ 20.0% - 20.5% ] 20.43% | 107,024 | 10.2% |
[ 20.5% - 21.0% ] 20.74% | 236,857 | 34.5% |
[ 21.0% - 21.5% ] 21.21% | 66,476 | 71.0% |
[ 21.0% - 21.5% ] 21.41% | 203,886 | 63.7% |
[ 21.5% - 22.0% ] 21.85% | 64,946 | 36.3% |
[ 22.0% - 22.5% ] 22.30% | 76,137 | 77.8% |
[ 22.5% - 23.0% ] 22.71% | 133,398 | 67.7% |
[ 23.0% - 23.5% ] 23.09% | 144,601 | 58.0% |
[ 23.0% - 23.5% ] 23.36% | 862,624 | 27.2% |
[ 23.5% - 24.0% ] 23.95% | 60,815 | 49.9% |
[ 24.0% - 24.5% ] 24.23% | 181,482 | 68.2% |
[ 24.5% - 25.0% ] 24.58% | 45,466 | 51.0% |
[ 25.0% - 25.5% ] 25.46% | 58,529 | 51.1% |
[ 25.5% - 26.0% ] 25.62% | 91,833 | 21.7% |
[ 26.0% - 26.5% ] 26.11% | 23,343 | 1.7% |
[ 26.5% - 27.0% ] 26.69% | 50,734 | 45.3% |
[ 26.5% - 27.0% ] 26.85% | 88,531 | 46.3% |
[ 27.0% - 27.5% ] 27.32% | 29,394 | 49.0% |
[ 27.5% - 28.0% ] 27.87% | 125,567 | 73.0% |
[ 27.5% - 28.0% ] 27.93% | 52,707 | 22.1% |
[ 28.0% - 28.5% ] 28.48% | 108,626 | 64.3% |
[ 28.5% - 29.0% ] 28.77% | 46,424 | 33.8% |
[ 29.0% - 29.5% ] 29.13% | 128,689 | 67.9% |
[ 29.5% - 30.0% ] 29.57% | 90,121 | 66.9% |
[ 29.5% - 30.0% ] 29.99% | 90,534 | 73.5% |
[ 30.0% - 30.5% ] 30.34% | 118,437 | 20.1% |
[ 30.5% - 31.0% ] 30.73% | 192 | 88.6% |
[ 31.0% - 31.5% ] 31.18% | 19,928 | 40.6% |
[ 31.5% - 32.0% ] 31.53% | 48,930 | 74.3% |
[ 32.0% - 32.5% ] 32.10% | 38,554 | 42.2% |
[ 32.0% - 32.5% ] 32.32% | 98,730 | 53.2% |
[ 34.0% - 34.5% ] 34.02% | 135,971 | 18.5% |
[ 34.0% - 34.5% ] 34.14% | 43,304 | 32.3% |
[ 35.5% - 36.0% ] 35.63% | 80,880 | 52.9% |
[ 36.0% - 36.5% ] 36.18% | 65,922 | 63.7% |
[ 36.5% - 37.0% ] 36.54% | 31,986 | 74.0% |
[ 37.0% - 37.5% ] 37.05% | 62,692 | 54.2% |
[ 37.0% - 37.5% ] 37.29% | 141,083 | 27.4% |
[ 38.0% - 38.5% ] 38.11% | 129,504 | 64.6% |
[ 38.5% - 39.0% ] 38.57% | 115,076 | 61.6% |
[ 38.5% - 39.0% ] 38.86% | 85,525 | 78.3% |
[ 39.0% - 39.5% ] 39.20% | 7,786 | 67.1% |
[ 40.0% - 40.5% ] 40.23% | 23,014 | 65.2% |
[ 40.5% - 41.0% ] 40.62% | 28,212 | 83.6% |
[ 40.5% - 41.0% ] 40.74% | 2,852 | 78.7% |
[ 41.5% - 42.0% ] 41.51% | 33,937 | 63.4% |
[ 42.5% - 43.0% ] 42.62% | 60,364 | 69.2% |
[ 43.0% - 43.5% ] 43.21% | 83,114 | 57.9% |
[ 43.5% - 44.0% ] 43.76% | 91,781 | 60.8% |
[ 43.5% - 44.0% ] 43.92% | 25,460 | 13.2% |
[ 45.0% - 45.5% ] 45.16% | 37,340 | 63.8% |
[ 46.0% - 46.5% ] 46.03% | 63 | 95.0% |
[ 46.0% - 46.5% ] 46.32% | 557 | 1.8% |
[ 46.5% - 47.0% ] 46.81% | 329 | 79.2% |
[ 47.0% - 47.5% ] 47.13% | 89,536 | 38.2% |
[ 47.5% - 48.0% ] 47.81% | 96,393 | 66.3% |
[ 49.0% - 49.5% ] 49.15% | 12,070 | 4.9% |
[ 54.0% - 54.5% ] 54.04% | 25,001 | 83.4% |
[ 55.5% - 56.0% ] 55.81% | 26,418 | 64.0% |
[ 58.5% - 59.0% ] 58.72% | 79,495 | 11.2% |
[ 70.5% - 71.0% ] 70.75% | 147 | 16.8% |
[ 77.5% - 78.0% ] 77.53% | 178 | 100.0% |
[ 79.0% - 79.5% ] 79.41% | 68 | 100.0% |