Indian (Asian) Wage/Income Gap
COMPARE
Indian (Asian)
Select to Compare
Wage/Income Gap
Indian (Asian) Wage/Income Gap
26.4%
WAGE/INCOME GAP
16.5/ 100
METRIC RATING
206th/ 347
METRIC RANK
Indian (Asian) Wage/Income Gap Correlation Chart
The statistical analysis conducted on geographies consisting of 494,711,771 people shows a moderate negative correlation between the proportion of Indians (Asian) and wage/income gap percentage in the United States with a correlation coefficient (R) of -0.438 and weighted average of 26.4%. On average, for every 1% (one percent) increase in Indians (Asian) within a typical geography, there is a decrease of 0.25% in wage/income gap percentage.
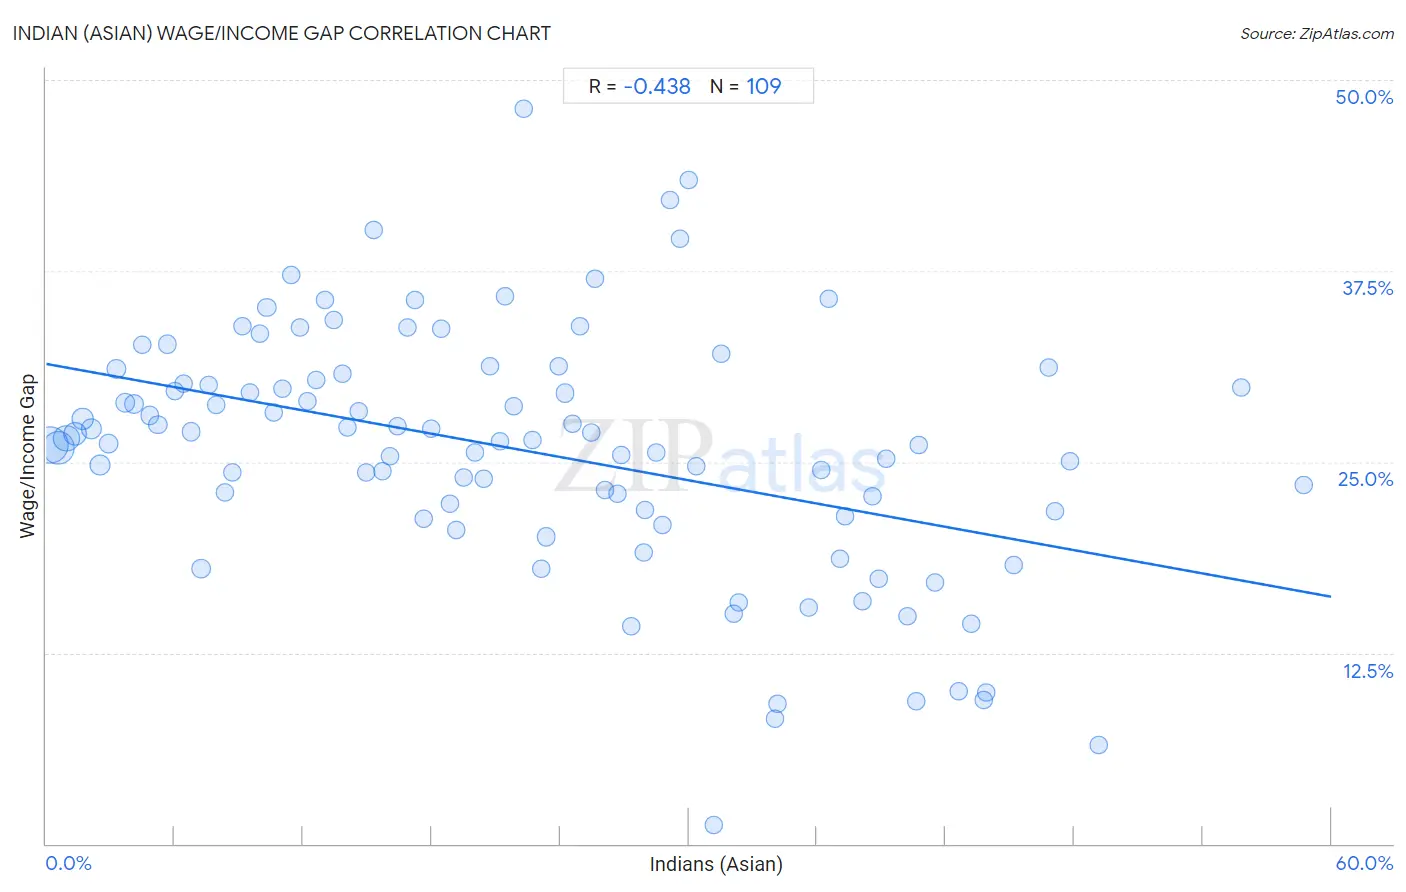
It is essential to understand that the correlation between the percentage of Indians (Asian) and wage/income gap percentage does not imply a direct cause-and-effect relationship. It remains uncertain whether the presence of Indians (Asian) influences an upward or downward trend in the level of wage/income gap percentage within an area, or if Indians (Asian) simply ended up residing in those areas with higher or lower levels of wage/income gap percentage due to other factors.
Demographics Similar to Indians (Asian) by Wage/Income Gap
In terms of wage/income gap, the demographic groups most similar to Indians (Asian) are Immigrants from Italy (26.5%, a difference of 0.080%), Immigrants from Southern Europe (26.4%, a difference of 0.090%), Immigrants from Russia (26.4%, a difference of 0.27%), Laotian (26.4%, a difference of 0.29%), and Immigrants from Eastern Europe (26.4%, a difference of 0.29%).
| Demographics | Rating | Rank | Wage/Income Gap |
| Dutch West Indians | 21.0 /100 | #199 | Fair 26.3% |
| Delaware | 20.9 /100 | #200 | Fair 26.3% |
| Immigrants from Syria | 19.3 /100 | #201 | Poor 26.4% |
| Laotians | 19.2 /100 | #202 | Poor 26.4% |
| Immigrants from Eastern Europe | 19.2 /100 | #203 | Poor 26.4% |
| Immigrants from Russia | 19.0 /100 | #204 | Poor 26.4% |
| Immigrants from Southern Europe | 17.3 /100 | #205 | Poor 26.4% |
| Indians (Asian) | 16.5 /100 | #206 | Poor 26.4% |
| Immigrants from Italy | 15.8 /100 | #207 | Poor 26.5% |
| Egyptians | 12.7 /100 | #208 | Poor 26.6% |
| Immigrants from Kuwait | 12.6 /100 | #209 | Poor 26.6% |
| Arabs | 12.3 /100 | #210 | Poor 26.6% |
| Mongolians | 11.4 /100 | #211 | Poor 26.6% |
| Iraqis | 11.2 /100 | #212 | Poor 26.6% |
| Immigrants from Iraq | 10.3 /100 | #213 | Poor 26.7% |
Indian (Asian) Wage/Income Gap Correlation Summary
| Measurement | Indian (Asian) Data | Wage/Income Gap Data |
| Minimum | 0.19% | 1.2% |
| Maximum | 58.7% | 48.1% |
| Range | 58.5% | 46.8% |
| Mean | 22.3% | 25.8% |
| Median | 21.2% | 26.4% |
| Interquartile 25% (IQ1) | 10.5% | 21.6% |
| Interquartile 75% (IQ3) | 32.2% | 30.6% |
| Interquartile Range (IQR) | 21.7% | 9.0% |
| Standard Deviation (Sample) | 14.1% | 8.2% |
| Standard Deviation (Population) | 14.0% | 8.1% |
Correlation Details
| Indian (Asian) Percentile | Sample Size | Wage/Income Gap |
[ 0.0% - 0.5% ] 0.19% | 140,402,857 | 26.1% |
[ 0.5% - 1.0% ] 0.57% | 108,147,525 | 25.9% |
[ 0.5% - 1.0% ] 0.95% | 62,682,360 | 26.6% |
[ 1.0% - 1.5% ] 1.34% | 36,211,742 | 26.8% |
[ 1.5% - 2.0% ] 1.72% | 25,901,286 | 27.8% |
[ 2.0% - 2.5% ] 2.11% | 17,529,397 | 27.2% |
[ 2.5% - 3.0% ] 2.51% | 18,113,657 | 24.8% |
[ 2.5% - 3.0% ] 2.91% | 11,436,369 | 26.2% |
[ 3.0% - 3.5% ] 3.29% | 6,934,876 | 31.1% |
[ 3.5% - 4.0% ] 3.67% | 5,994,025 | 28.9% |
[ 4.0% - 4.5% ] 4.08% | 5,822,408 | 28.8% |
[ 4.0% - 4.5% ] 4.48% | 3,401,376 | 32.7% |
[ 4.5% - 5.0% ] 4.83% | 3,301,930 | 28.0% |
[ 5.0% - 5.5% ] 5.22% | 4,113,561 | 27.4% |
[ 5.5% - 6.0% ] 5.64% | 2,343,972 | 32.7% |
[ 5.5% - 6.0% ] 6.00% | 2,242,518 | 29.6% |
[ 6.0% - 6.5% ] 6.42% | 1,652,033 | 30.1% |
[ 6.5% - 7.0% ] 6.77% | 1,860,833 | 27.0% |
[ 7.0% - 7.5% ] 7.25% | 10,877,164 | 18.0% |
[ 7.5% - 8.0% ] 7.61% | 1,074,691 | 30.0% |
[ 7.5% - 8.0% ] 7.95% | 1,301,181 | 28.7% |
[ 8.0% - 8.5% ] 8.35% | 1,284,133 | 23.0% |
[ 8.5% - 9.0% ] 8.71% | 1,913,136 | 24.3% |
[ 9.0% - 9.5% ] 9.15% | 717,205 | 33.9% |
[ 9.5% - 10.0% ] 9.51% | 774,428 | 29.6% |
[ 9.5% - 10.0% ] 9.99% | 1,472,959 | 33.4% |
[ 10.0% - 10.5% ] 10.30% | 430,606 | 35.1% |
[ 10.5% - 11.0% ] 10.62% | 417,353 | 28.3% |
[ 11.0% - 11.5% ] 11.04% | 694,909 | 29.8% |
[ 11.0% - 11.5% ] 11.44% | 568,420 | 37.2% |
[ 11.5% - 12.0% ] 11.84% | 714,088 | 33.8% |
[ 12.0% - 12.5% ] 12.19% | 767,486 | 29.0% |
[ 12.5% - 13.0% ] 12.63% | 678,607 | 30.3% |
[ 13.0% - 13.5% ] 13.00% | 444,914 | 35.6% |
[ 13.0% - 13.5% ] 13.42% | 231,444 | 34.3% |
[ 13.5% - 14.0% ] 13.81% | 338,427 | 30.8% |
[ 14.0% - 14.5% ] 14.09% | 552,502 | 27.3% |
[ 14.5% - 15.0% ] 14.59% | 201,772 | 28.3% |
[ 14.5% - 15.0% ] 14.93% | 470,567 | 24.3% |
[ 15.0% - 15.5% ] 15.27% | 747,820 | 40.2% |
[ 15.5% - 16.0% ] 15.71% | 465,405 | 24.4% |
[ 16.0% - 16.5% ] 16.08% | 274,809 | 25.4% |
[ 16.0% - 16.5% ] 16.40% | 515,007 | 27.4% |
[ 16.5% - 17.0% ] 16.89% | 419,029 | 33.8% |
[ 17.0% - 17.5% ] 17.21% | 102,809 | 35.6% |
[ 17.5% - 18.0% ] 17.63% | 334,774 | 21.3% |
[ 17.5% - 18.0% ] 17.97% | 641,507 | 27.1% |
[ 18.0% - 18.5% ] 18.43% | 527,278 | 33.7% |
[ 18.5% - 19.0% ] 18.87% | 338,253 | 22.2% |
[ 19.0% - 19.5% ] 19.12% | 118,278 | 20.6% |
[ 19.0% - 19.5% ] 19.48% | 319,065 | 24.0% |
[ 20.0% - 20.5% ] 20.02% | 795,403 | 25.6% |
[ 20.0% - 20.5% ] 20.43% | 107,024 | 23.9% |
[ 20.5% - 21.0% ] 20.74% | 236,857 | 31.2% |
[ 21.0% - 21.5% ] 21.21% | 68,874 | 26.3% |
[ 21.0% - 21.5% ] 21.41% | 203,886 | 35.9% |
[ 21.5% - 22.0% ] 21.85% | 64,946 | 28.6% |
[ 22.0% - 22.5% ] 22.30% | 76,137 | 48.1% |
[ 22.5% - 23.0% ] 22.71% | 133,398 | 26.4% |
[ 23.0% - 23.5% ] 23.09% | 144,601 | 18.0% |
[ 23.0% - 23.5% ] 23.36% | 862,624 | 20.1% |
[ 23.5% - 24.0% ] 23.95% | 60,815 | 31.2% |
[ 24.0% - 24.5% ] 24.23% | 181,482 | 29.5% |
[ 24.5% - 25.0% ] 24.58% | 45,466 | 27.5% |
[ 24.5% - 25.0% ] 24.93% | 8,755 | 33.9% |
[ 25.0% - 25.5% ] 25.46% | 58,529 | 26.9% |
[ 25.5% - 26.0% ] 25.62% | 91,833 | 36.9% |
[ 26.0% - 26.5% ] 26.11% | 23,343 | 23.1% |
[ 26.5% - 27.0% ] 26.68% | 52,159 | 22.9% |
[ 26.5% - 27.0% ] 26.85% | 88,531 | 25.5% |
[ 27.0% - 27.5% ] 27.32% | 29,394 | 14.3% |
[ 27.5% - 28.0% ] 27.87% | 124,609 | 19.1% |
[ 27.5% - 28.0% ] 27.93% | 52,707 | 21.8% |
[ 28.0% - 28.5% ] 28.48% | 108,577 | 25.6% |
[ 28.5% - 29.0% ] 28.77% | 46,424 | 20.8% |
[ 29.0% - 29.5% ] 29.13% | 128,689 | 42.2% |
[ 29.5% - 30.0% ] 29.57% | 90,121 | 39.6% |
[ 29.5% - 30.0% ] 29.99% | 90,534 | 43.4% |
[ 30.0% - 30.5% ] 30.34% | 118,437 | 24.7% |
[ 31.0% - 31.5% ] 31.18% | 19,928 | 1.2% |
[ 31.5% - 32.0% ] 31.53% | 48,930 | 32.1% |
[ 32.0% - 32.5% ] 32.10% | 38,554 | 15.0% |
[ 32.0% - 32.5% ] 32.32% | 98,730 | 15.8% |
[ 34.0% - 34.5% ] 34.02% | 135,971 | 8.2% |
[ 34.0% - 34.5% ] 34.14% | 43,304 | 9.1% |
[ 35.5% - 36.0% ] 35.63% | 80,880 | 15.5% |
[ 36.0% - 36.5% ] 36.18% | 65,922 | 24.4% |
[ 36.5% - 37.0% ] 36.54% | 31,986 | 35.6% |
[ 37.0% - 37.5% ] 37.05% | 62,692 | 18.7% |
[ 37.0% - 37.5% ] 37.29% | 140,600 | 21.4% |
[ 38.0% - 38.5% ] 38.11% | 129,504 | 15.8% |
[ 38.5% - 39.0% ] 38.57% | 115,076 | 22.8% |
[ 38.5% - 39.0% ] 38.86% | 85,525 | 17.3% |
[ 39.0% - 39.5% ] 39.20% | 7,786 | 25.2% |
[ 40.0% - 40.5% ] 40.24% | 22,654 | 14.9% |
[ 40.5% - 41.0% ] 40.62% | 28,212 | 9.3% |
[ 40.5% - 41.0% ] 40.74% | 2,825 | 26.1% |
[ 41.5% - 42.0% ] 41.51% | 33,937 | 17.1% |
[ 42.5% - 43.0% ] 42.62% | 60,364 | 10.0% |
[ 43.0% - 43.5% ] 43.21% | 83,114 | 14.4% |
[ 43.5% - 44.0% ] 43.76% | 91,781 | 9.5% |
[ 43.5% - 44.0% ] 43.92% | 25,460 | 9.9% |
[ 45.0% - 45.5% ] 45.16% | 37,340 | 18.3% |
[ 46.5% - 47.0% ] 46.81% | 329 | 31.2% |
[ 47.0% - 47.5% ] 47.13% | 89,536 | 21.8% |
[ 47.5% - 48.0% ] 47.80% | 95,942 | 25.0% |
[ 49.0% - 49.5% ] 49.15% | 12,070 | 6.5% |
[ 55.5% - 56.0% ] 55.81% | 26,418 | 29.9% |
[ 58.5% - 59.0% ] 58.72% | 79,495 | 23.5% |