Indian (Asian) In Labor Force | Age 20-24
COMPARE
Indian (Asian)
Select to Compare
In Labor Force | Age 20-24
Indian (Asian) In Labor Force | Age 20-24
71.9%
IN LABOR FORCE | AGE 20-24
0.0/ 100
METRIC RATING
314th/ 347
METRIC RANK
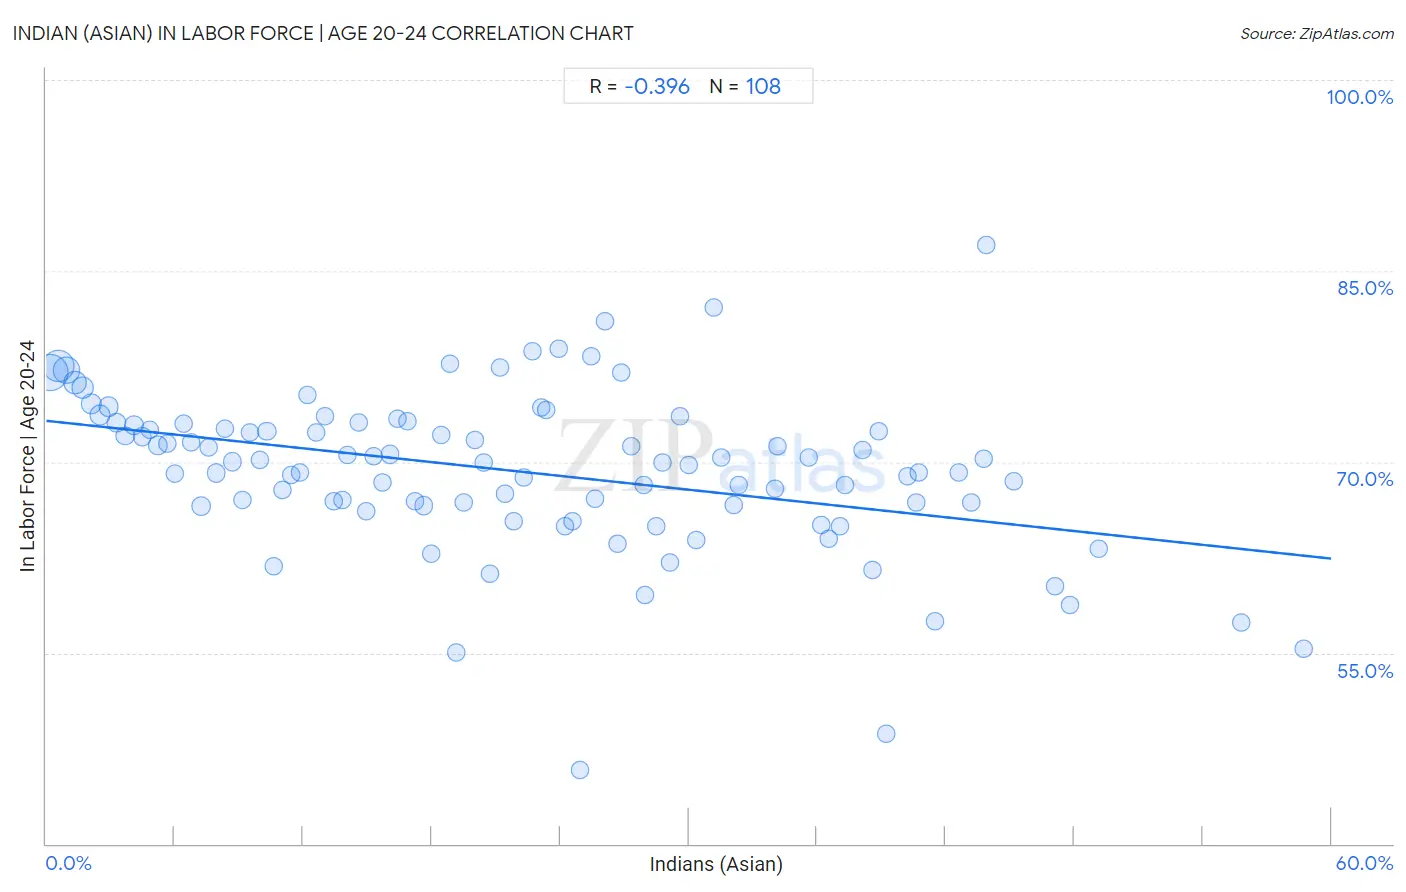
Indian (Asian) In Labor Force | Age 20-24 Correlation Chart
The statistical analysis conducted on geographies consisting of 495,002,226 people shows a mild negative correlation between the proportion of Indians (Asian) and labor force participation rate among population between the ages 20 and 24 in the United States with a correlation coefficient (R) of -0.396 and weighted average of 71.9%. On average, for every 1% (one percent) increase in Indians (Asian) within a typical geography, there is a decrease of 0.18% in labor force participation rate among population between the ages 20 and 24.
It is essential to understand that the correlation between the percentage of Indians (Asian) and labor force participation rate among population between the ages 20 and 24 does not imply a direct cause-and-effect relationship. It remains uncertain whether the presence of Indians (Asian) influences an upward or downward trend in the level of labor force participation rate among population between the ages 20 and 24 within an area, or if Indians (Asian) simply ended up residing in those areas with higher or lower levels of labor force participation rate among population between the ages 20 and 24 due to other factors.
Demographics Similar to Indians (Asian) by In Labor Force | Age 20-24
In terms of in labor force | age 20-24, the demographic groups most similar to Indians (Asian) are Immigrants from Dominica (71.9%, a difference of 0.010%), Immigrants from Caribbean (71.9%, a difference of 0.060%), Immigrants from Iran (71.8%, a difference of 0.090%), Apache (72.0%, a difference of 0.13%), and Immigrants from Eastern Asia (71.8%, a difference of 0.13%).
| Demographics | Rating | Rank | In Labor Force | Age 20-24 |
| Immigrants from Ecuador | 0.0 /100 | #307 | Tragic 72.3% |
| Soviet Union | 0.0 /100 | #308 | Tragic 72.3% |
| Tsimshian | 0.0 /100 | #309 | Tragic 72.3% |
| Immigrants from Cuba | 0.0 /100 | #310 | Tragic 72.0% |
| Apache | 0.0 /100 | #311 | Tragic 72.0% |
| Immigrants from Caribbean | 0.0 /100 | #312 | Tragic 71.9% |
| Immigrants from Dominica | 0.0 /100 | #313 | Tragic 71.9% |
| Indians (Asian) | 0.0 /100 | #314 | Tragic 71.9% |
| Immigrants from Iran | 0.0 /100 | #315 | Tragic 71.8% |
| Immigrants from Eastern Asia | 0.0 /100 | #316 | Tragic 71.8% |
| Immigrants from Armenia | 0.0 /100 | #317 | Tragic 71.7% |
| Immigrants from Hong Kong | 0.0 /100 | #318 | Tragic 71.6% |
| Immigrants from Israel | 0.0 /100 | #319 | Tragic 71.6% |
| Trinidadians and Tobagonians | 0.0 /100 | #320 | Tragic 71.5% |
| Immigrants from Taiwan | 0.0 /100 | #321 | Tragic 71.5% |
Indian (Asian) In Labor Force | Age 20-24 Correlation Summary
| Measurement | Indian (Asian) Data | In Labor Force | Age 20-24 Data |
| Minimum | 0.19% | 45.8% |
| Maximum | 58.7% | 87.0% |
| Range | 58.5% | 41.2% |
| Mean | 22.1% | 69.2% |
| Median | 21.0% | 70.0% |
| Interquartile 25% (IQ1) | 10.5% | 66.6% |
| Interquartile 75% (IQ3) | 31.8% | 72.9% |
| Interquartile Range (IQR) | 21.4% | 6.4% |
| Standard Deviation (Sample) | 14.0% | 6.3% |
| Standard Deviation (Population) | 13.9% | 6.3% |
Correlation Details
| Indian (Asian) Percentile | Sample Size | In Labor Force | Age 20-24 |
[ 0.0% - 0.5% ] 0.19% | 140,489,120 | 77.0% |
[ 0.5% - 1.0% ] 0.57% | 108,195,445 | 77.6% |
[ 0.5% - 1.0% ] 0.95% | 62,730,022 | 77.2% |
[ 1.0% - 1.5% ] 1.34% | 36,232,412 | 76.2% |
[ 1.5% - 2.0% ] 1.72% | 25,910,860 | 75.8% |
[ 2.0% - 2.5% ] 2.11% | 17,537,443 | 74.6% |
[ 2.5% - 3.0% ] 2.51% | 18,124,972 | 73.7% |
[ 2.5% - 3.0% ] 2.91% | 11,453,721 | 74.3% |
[ 3.0% - 3.5% ] 3.29% | 6,940,281 | 73.1% |
[ 3.5% - 4.0% ] 3.67% | 5,997,730 | 72.1% |
[ 4.0% - 4.5% ] 4.08% | 5,832,494 | 72.9% |
[ 4.0% - 4.5% ] 4.48% | 3,419,938 | 72.0% |
[ 4.5% - 5.0% ] 4.83% | 3,306,688 | 72.5% |
[ 5.0% - 5.5% ] 5.22% | 4,120,045 | 71.3% |
[ 5.5% - 6.0% ] 5.64% | 2,349,731 | 71.5% |
[ 5.5% - 6.0% ] 6.00% | 2,246,883 | 69.1% |
[ 6.0% - 6.5% ] 6.42% | 1,654,327 | 73.0% |
[ 6.5% - 7.0% ] 6.77% | 1,861,180 | 71.5% |
[ 7.0% - 7.5% ] 7.25% | 10,872,068 | 66.5% |
[ 7.5% - 8.0% ] 7.61% | 1,074,861 | 71.1% |
[ 7.5% - 8.0% ] 7.94% | 1,269,171 | 69.1% |
[ 8.0% - 8.5% ] 8.35% | 1,289,385 | 72.6% |
[ 8.5% - 9.0% ] 8.71% | 1,913,566 | 70.0% |
[ 9.0% - 9.5% ] 9.15% | 716,601 | 67.0% |
[ 9.5% - 10.0% ] 9.51% | 775,206 | 72.3% |
[ 9.5% - 10.0% ] 9.98% | 1,480,270 | 70.2% |
[ 10.0% - 10.5% ] 10.30% | 436,092 | 72.4% |
[ 10.5% - 11.0% ] 10.62% | 416,422 | 61.8% |
[ 11.0% - 11.5% ] 11.04% | 693,224 | 67.8% |
[ 11.0% - 11.5% ] 11.44% | 568,123 | 69.0% |
[ 11.5% - 12.0% ] 11.84% | 715,101 | 69.2% |
[ 12.0% - 12.5% ] 12.19% | 769,212 | 75.3% |
[ 12.5% - 13.0% ] 12.63% | 681,596 | 72.3% |
[ 13.0% - 13.5% ] 13.00% | 446,244 | 73.6% |
[ 13.0% - 13.5% ] 13.42% | 230,798 | 66.9% |
[ 13.5% - 14.0% ] 13.81% | 335,494 | 67.0% |
[ 14.0% - 14.5% ] 14.09% | 551,399 | 70.6% |
[ 14.5% - 15.0% ] 14.59% | 200,411 | 73.1% |
[ 14.5% - 15.0% ] 14.93% | 470,567 | 66.1% |
[ 15.0% - 15.5% ] 15.27% | 748,668 | 70.5% |
[ 15.5% - 16.0% ] 15.71% | 465,405 | 68.4% |
[ 16.0% - 16.5% ] 16.08% | 276,336 | 70.6% |
[ 16.0% - 16.5% ] 16.40% | 515,007 | 73.4% |
[ 16.5% - 17.0% ] 16.89% | 420,482 | 73.2% |
[ 17.0% - 17.5% ] 17.21% | 102,332 | 66.9% |
[ 17.5% - 18.0% ] 17.63% | 334,774 | 66.6% |
[ 17.5% - 18.0% ] 17.97% | 639,280 | 62.8% |
[ 18.0% - 18.5% ] 18.43% | 527,278 | 72.1% |
[ 18.5% - 19.0% ] 18.87% | 338,253 | 77.7% |
[ 19.0% - 19.5% ] 19.12% | 118,278 | 55.0% |
[ 19.0% - 19.5% ] 19.48% | 319,065 | 66.8% |
[ 20.0% - 20.5% ] 20.02% | 795,534 | 71.7% |
[ 20.0% - 20.5% ] 20.43% | 107,024 | 70.0% |
[ 20.5% - 21.0% ] 20.74% | 236,857 | 61.2% |
[ 21.0% - 21.5% ] 21.21% | 68,874 | 77.4% |
[ 21.0% - 21.5% ] 21.41% | 203,886 | 67.5% |
[ 21.5% - 22.0% ] 21.85% | 64,946 | 65.3% |
[ 22.0% - 22.5% ] 22.30% | 76,137 | 68.8% |
[ 22.5% - 23.0% ] 22.71% | 133,398 | 78.7% |
[ 23.0% - 23.5% ] 23.09% | 144,601 | 74.3% |
[ 23.0% - 23.5% ] 23.36% | 862,624 | 74.0% |
[ 23.5% - 24.0% ] 23.95% | 60,815 | 78.9% |
[ 24.0% - 24.5% ] 24.23% | 180,625 | 65.0% |
[ 24.5% - 25.0% ] 24.58% | 45,466 | 65.4% |
[ 24.5% - 25.0% ] 24.93% | 8,755 | 45.8% |
[ 25.0% - 25.5% ] 25.46% | 58,529 | 78.3% |
[ 25.5% - 26.0% ] 25.62% | 91,833 | 67.1% |
[ 26.0% - 26.5% ] 26.11% | 23,343 | 81.0% |
[ 26.5% - 27.0% ] 26.68% | 52,159 | 63.6% |
[ 26.5% - 27.0% ] 26.85% | 88,531 | 77.1% |
[ 27.0% - 27.5% ] 27.32% | 29,394 | 71.3% |
[ 27.5% - 28.0% ] 27.87% | 124,609 | 68.2% |
[ 27.5% - 28.0% ] 27.93% | 52,707 | 59.5% |
[ 28.0% - 28.5% ] 28.48% | 108,577 | 64.9% |
[ 28.5% - 29.0% ] 28.77% | 46,424 | 70.0% |
[ 29.0% - 29.5% ] 29.13% | 128,689 | 62.1% |
[ 29.5% - 30.0% ] 29.57% | 90,121 | 73.6% |
[ 29.5% - 30.0% ] 29.99% | 90,534 | 69.8% |
[ 30.0% - 30.5% ] 30.34% | 118,437 | 63.9% |
[ 31.0% - 31.5% ] 31.18% | 19,928 | 82.1% |
[ 31.5% - 32.0% ] 31.53% | 48,930 | 70.3% |
[ 32.0% - 32.5% ] 32.10% | 38,554 | 66.6% |
[ 32.0% - 32.5% ] 32.32% | 98,730 | 68.2% |
[ 34.0% - 34.5% ] 34.02% | 135,971 | 67.9% |
[ 34.0% - 34.5% ] 34.14% | 43,304 | 71.2% |
[ 35.5% - 36.0% ] 35.63% | 80,880 | 70.3% |
[ 36.0% - 36.5% ] 36.18% | 65,922 | 65.0% |
[ 36.5% - 37.0% ] 36.54% | 31,986 | 64.0% |
[ 37.0% - 37.5% ] 37.05% | 62,692 | 64.9% |
[ 37.0% - 37.5% ] 37.29% | 140,600 | 68.2% |
[ 38.0% - 38.5% ] 38.11% | 129,504 | 70.9% |
[ 38.5% - 39.0% ] 38.57% | 115,076 | 61.5% |
[ 38.5% - 39.0% ] 38.86% | 85,525 | 72.4% |
[ 39.0% - 39.5% ] 39.20% | 7,786 | 48.6% |
[ 40.0% - 40.5% ] 40.24% | 22,654 | 68.9% |
[ 40.5% - 41.0% ] 40.62% | 28,212 | 66.8% |
[ 40.5% - 41.0% ] 40.74% | 2,825 | 69.2% |
[ 41.5% - 42.0% ] 41.51% | 33,937 | 57.5% |
[ 42.5% - 43.0% ] 42.62% | 60,364 | 69.2% |
[ 43.0% - 43.5% ] 43.21% | 83,114 | 66.8% |
[ 43.5% - 44.0% ] 43.76% | 91,781 | 70.2% |
[ 43.5% - 44.0% ] 43.92% | 25,460 | 87.0% |
[ 45.0% - 45.5% ] 45.16% | 37,340 | 68.5% |
[ 47.0% - 47.5% ] 47.13% | 89,536 | 60.2% |
[ 47.5% - 48.0% ] 47.80% | 95,942 | 58.8% |
[ 49.0% - 49.5% ] 49.15% | 12,070 | 63.2% |
[ 55.5% - 56.0% ] 55.81% | 26,418 | 57.4% |
[ 58.5% - 59.0% ] 58.72% | 79,495 | 55.3% |