Immigrants from Eastern Africa Married-couple Households
COMPARE
Immigrants from Eastern Africa
Select to Compare
Married-couple Households
Immigrants from Eastern Africa Married-couple Households
42.9%
MARRIED-COUPLE HOUSEHOLDS
0.0/ 100
METRIC RATING
277th/ 347
METRIC RANK
Immigrants from Eastern Africa Married-couple Households Correlation Chart
The statistical analysis conducted on geographies consisting of 354,884,071 people shows a moderate positive correlation between the proportion of Immigrants from Eastern Africa and percentage of married-couple family households in the United States with a correlation coefficient (R) of 0.427 and weighted average of 42.9%. On average, for every 1% (one percent) increase in Immigrants from Eastern Africa within a typical geography, there is an increase of 0.70% in percentage of married-couple family households.
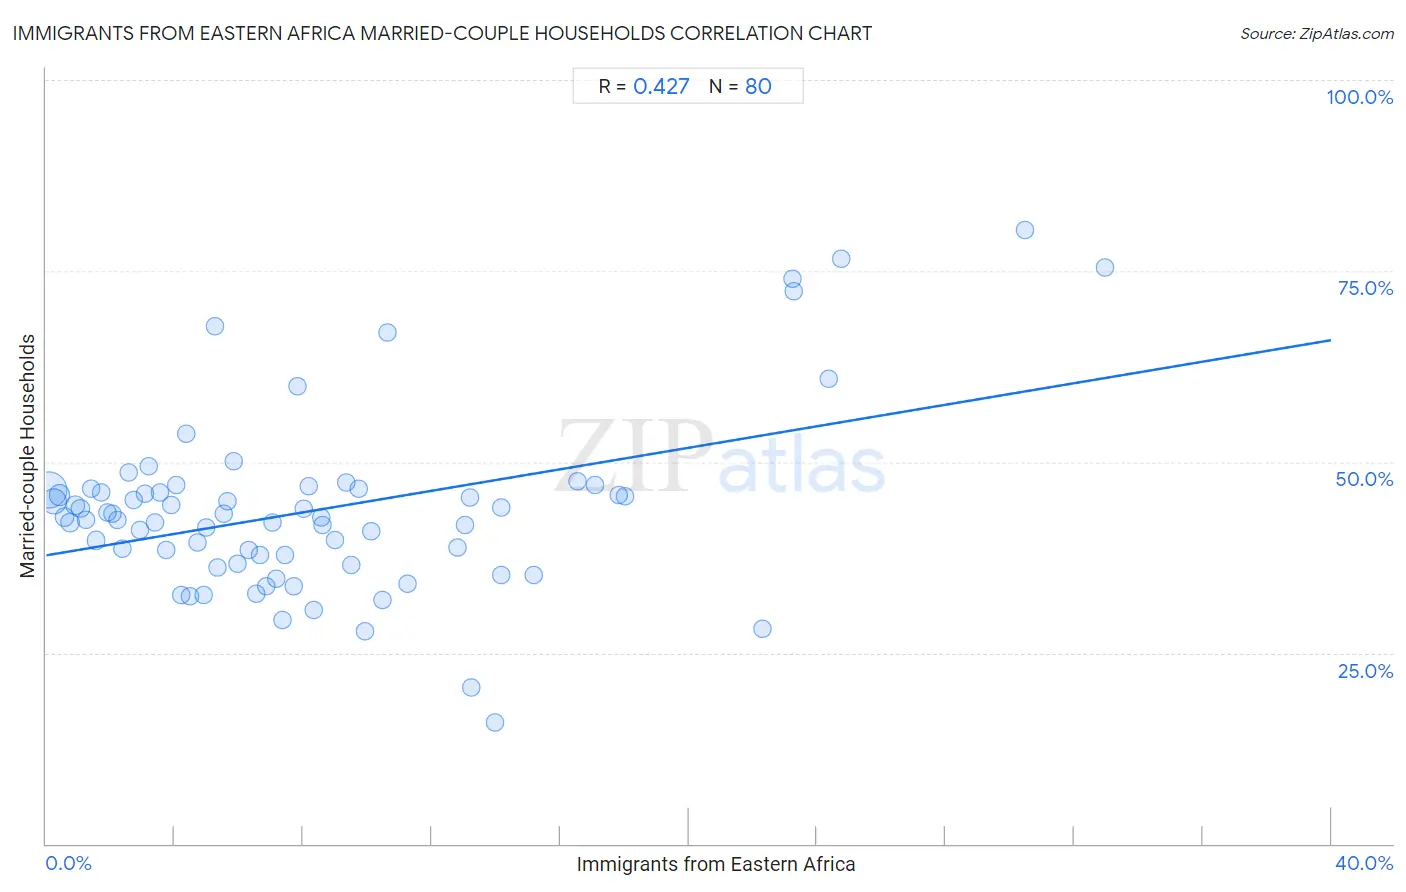
It is essential to understand that the correlation between the percentage of Immigrants from Eastern Africa and percentage of married-couple family households does not imply a direct cause-and-effect relationship. It remains uncertain whether the presence of Immigrants from Eastern Africa influences an upward or downward trend in the level of percentage of married-couple family households within an area, or if Immigrants from Eastern Africa simply ended up residing in those areas with higher or lower levels of percentage of married-couple family households due to other factors.
Demographics Similar to Immigrants from Eastern Africa by Married-couple Households
In terms of married-couple households, the demographic groups most similar to Immigrants from Eastern Africa are Immigrants from Africa (42.9%, a difference of 0.11%), Sierra Leonean (42.9%, a difference of 0.14%), Immigrants from Ecuador (42.9%, a difference of 0.19%), Immigrants from Ethiopia (43.1%, a difference of 0.26%), and Immigrants from Guatemala (42.8%, a difference of 0.26%).
| Demographics | Rating | Rank | Married-couple Households |
| Yuman | 0.1 /100 | #270 | Tragic 43.3% |
| Guatemalans | 0.1 /100 | #271 | Tragic 43.3% |
| Immigrants from Nigeria | 0.1 /100 | #272 | Tragic 43.2% |
| Ethiopians | 0.1 /100 | #273 | Tragic 43.2% |
| Nigerians | 0.1 /100 | #274 | Tragic 43.2% |
| Immigrants from Bangladesh | 0.0 /100 | #275 | Tragic 43.1% |
| Immigrants from Ethiopia | 0.0 /100 | #276 | Tragic 43.1% |
| Immigrants from Eastern Africa | 0.0 /100 | #277 | Tragic 42.9% |
| Immigrants from Africa | 0.0 /100 | #278 | Tragic 42.9% |
| Sierra Leoneans | 0.0 /100 | #279 | Tragic 42.9% |
| Immigrants from Ecuador | 0.0 /100 | #280 | Tragic 42.9% |
| Immigrants from Guatemala | 0.0 /100 | #281 | Tragic 42.8% |
| Bermudans | 0.0 /100 | #282 | Tragic 42.4% |
| Inupiat | 0.0 /100 | #283 | Tragic 42.4% |
| Cheyenne | 0.0 /100 | #284 | Tragic 42.3% |
Immigrants from Eastern Africa Married-couple Households Correlation Summary
| Measurement | Immigrants from Eastern Africa Data | Married-couple Households Data |
| Minimum | 0.073% | 15.8% |
| Maximum | 33.0% | 80.4% |
| Range | 32.9% | 64.5% |
| Mean | 8.4% | 43.7% |
| Median | 6.8% | 42.7% |
| Interquartile 25% (IQ1) | 3.3% | 37.2% |
| Interquartile 75% (IQ3) | 10.9% | 46.4% |
| Interquartile Range (IQR) | 7.6% | 9.2% |
| Standard Deviation (Sample) | 7.1% | 11.8% |
| Standard Deviation (Population) | 7.1% | 11.7% |
Correlation Details
| Immigrants from Eastern Africa Percentile | Sample Size | Married-couple Households |
[ 0.0% - 0.5% ] 0.073% | 181,295,228 | 46.4% |
[ 0.0% - 0.5% ] 0.23% | 69,836,132 | 44.8% |
[ 0.0% - 0.5% ] 0.41% | 33,881,792 | 45.6% |
[ 0.5% - 1.0% ] 0.57% | 20,721,478 | 42.8% |
[ 0.5% - 1.0% ] 0.74% | 11,296,722 | 42.0% |
[ 0.5% - 1.0% ] 0.90% | 6,849,332 | 44.3% |
[ 1.0% - 1.5% ] 1.06% | 5,293,654 | 43.9% |
[ 1.0% - 1.5% ] 1.24% | 4,510,969 | 42.4% |
[ 1.0% - 1.5% ] 1.39% | 2,026,061 | 46.5% |
[ 1.5% - 2.0% ] 1.56% | 3,406,600 | 39.7% |
[ 1.5% - 2.0% ] 1.72% | 1,512,814 | 46.0% |
[ 1.5% - 2.0% ] 1.91% | 971,729 | 43.4% |
[ 2.0% - 2.5% ] 2.06% | 1,466,027 | 43.2% |
[ 2.0% - 2.5% ] 2.22% | 1,497,627 | 42.3% |
[ 2.0% - 2.5% ] 2.37% | 1,667,383 | 38.6% |
[ 2.5% - 3.0% ] 2.56% | 633,855 | 48.6% |
[ 2.5% - 3.0% ] 2.71% | 675,661 | 45.0% |
[ 2.5% - 3.0% ] 2.92% | 704,192 | 41.1% |
[ 3.0% - 3.5% ] 3.06% | 673,311 | 45.8% |
[ 3.0% - 3.5% ] 3.20% | 260,767 | 49.5% |
[ 3.0% - 3.5% ] 3.40% | 445,037 | 42.0% |
[ 3.5% - 4.0% ] 3.55% | 561,380 | 45.9% |
[ 3.5% - 4.0% ] 3.72% | 785,381 | 38.5% |
[ 3.5% - 4.0% ] 3.88% | 268,330 | 44.3% |
[ 4.0% - 4.5% ] 4.06% | 190,405 | 46.9% |
[ 4.0% - 4.5% ] 4.21% | 63,699 | 32.5% |
[ 4.0% - 4.5% ] 4.35% | 145,822 | 53.6% |
[ 4.0% - 4.5% ] 4.48% | 312,088 | 32.4% |
[ 4.5% - 5.0% ] 4.71% | 372,083 | 39.5% |
[ 4.5% - 5.0% ] 4.90% | 583,075 | 32.6% |
[ 4.5% - 5.0% ] 4.99% | 146,510 | 41.5% |
[ 5.0% - 5.5% ] 5.27% | 20,228 | 67.8% |
[ 5.0% - 5.5% ] 5.34% | 146,778 | 36.2% |
[ 5.5% - 6.0% ] 5.52% | 149,843 | 43.2% |
[ 5.5% - 6.0% ] 5.66% | 60,781 | 44.9% |
[ 5.5% - 6.0% ] 5.82% | 8,232 | 50.0% |
[ 5.5% - 6.0% ] 5.97% | 32,524 | 36.6% |
[ 6.0% - 6.5% ] 6.31% | 44,512 | 38.5% |
[ 6.5% - 7.0% ] 6.52% | 141,127 | 32.7% |
[ 6.5% - 7.0% ] 6.67% | 167,562 | 37.8% |
[ 6.5% - 7.0% ] 6.87% | 114,071 | 33.8% |
[ 7.0% - 7.5% ] 7.04% | 81,317 | 42.1% |
[ 7.0% - 7.5% ] 7.16% | 40,566 | 34.7% |
[ 7.0% - 7.5% ] 7.35% | 75,527 | 29.2% |
[ 7.0% - 7.5% ] 7.44% | 112,595 | 37.8% |
[ 7.5% - 8.0% ] 7.71% | 121,282 | 33.8% |
[ 7.5% - 8.0% ] 7.84% | 14,521 | 59.9% |
[ 8.0% - 8.5% ] 8.01% | 73,858 | 43.9% |
[ 8.0% - 8.5% ] 8.18% | 20,561 | 46.8% |
[ 8.0% - 8.5% ] 8.33% | 19,531 | 30.6% |
[ 8.5% - 9.0% ] 8.56% | 25,823 | 42.7% |
[ 8.5% - 9.0% ] 8.62% | 86,918 | 41.7% |
[ 8.5% - 9.0% ] 8.97% | 535 | 39.8% |
[ 9.0% - 9.5% ] 9.33% | 24,308 | 47.3% |
[ 9.0% - 9.5% ] 9.48% | 42,084 | 36.4% |
[ 9.5% - 10.0% ] 9.74% | 6,497 | 46.5% |
[ 9.5% - 10.0% ] 9.92% | 32,014 | 27.9% |
[ 10.0% - 10.5% ] 10.12% | 1,403 | 40.9% |
[ 10.0% - 10.5% ] 10.45% | 3,914 | 31.9% |
[ 10.5% - 11.0% ] 10.62% | 631 | 66.9% |
[ 11.0% - 11.5% ] 11.23% | 4,346 | 34.1% |
[ 12.5% - 13.0% ] 12.79% | 30,927 | 38.8% |
[ 13.0% - 13.5% ] 13.02% | 338 | 41.7% |
[ 13.0% - 13.5% ] 13.17% | 8,290 | 45.3% |
[ 13.0% - 13.5% ] 13.22% | 121 | 20.5% |
[ 13.5% - 14.0% ] 13.95% | 28,172 | 15.8% |
[ 14.0% - 14.5% ] 14.17% | 27,523 | 35.1% |
[ 14.0% - 14.5% ] 14.18% | 7,703 | 43.9% |
[ 15.0% - 15.5% ] 15.16% | 3,693 | 35.2% |
[ 16.5% - 17.0% ] 16.54% | 133 | 47.5% |
[ 17.0% - 17.5% ] 17.07% | 82 | 46.9% |
[ 17.5% - 18.0% ] 17.82% | 26,684 | 45.6% |
[ 18.0% - 18.5% ] 18.03% | 14,553 | 45.5% |
[ 22.0% - 22.5% ] 22.30% | 1,157 | 28.1% |
[ 23.0% - 23.5% ] 23.22% | 267 | 74.0% |
[ 23.0% - 23.5% ] 23.25% | 4,572 | 72.3% |
[ 24.0% - 24.5% ] 24.37% | 439 | 60.9% |
[ 24.5% - 25.0% ] 24.74% | 97 | 76.7% |
[ 30.0% - 30.5% ] 30.48% | 105 | 80.4% |
[ 32.5% - 33.0% ] 32.97% | 182 | 75.4% |