Immigrants from Eastern Africa Self-Care Disability
COMPARE
Immigrants from Eastern Africa
Select to Compare
Self-Care Disability
Immigrants from Eastern Africa Self-Care Disability
2.3%
SELF-CARE DISABILITY
99.9/ 100
METRIC RATING
38th/ 347
METRIC RANK
Immigrants from Eastern Africa Self-Care Disability Correlation Chart
The statistical analysis conducted on geographies consisting of 354,752,249 people shows a mild positive correlation between the proportion of Immigrants from Eastern Africa and percentage of population with self-care disability in the United States with a correlation coefficient (R) of 0.373 and weighted average of 2.3%. On average, for every 1% (one percent) increase in Immigrants from Eastern Africa within a typical geography, there is an increase of 0.064% in percentage of population with self-care disability.
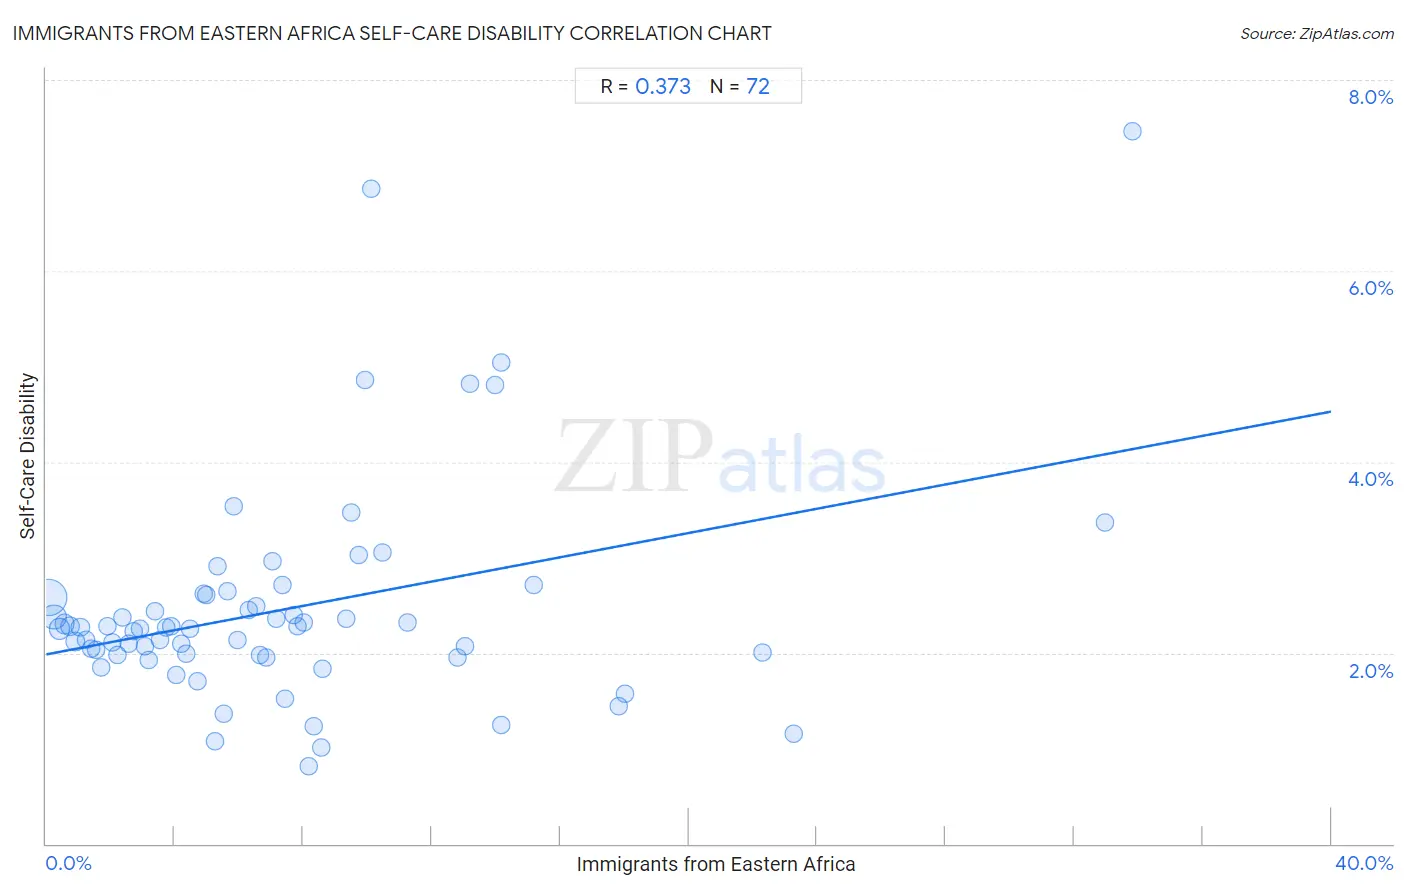
It is essential to understand that the correlation between the percentage of Immigrants from Eastern Africa and percentage of population with self-care disability does not imply a direct cause-and-effect relationship. It remains uncertain whether the presence of Immigrants from Eastern Africa influences an upward or downward trend in the level of percentage of population with self-care disability within an area, or if Immigrants from Eastern Africa simply ended up residing in those areas with higher or lower levels of percentage of population with self-care disability due to other factors.
Demographics Similar to Immigrants from Eastern Africa by Self-Care Disability
In terms of self-care disability, the demographic groups most similar to Immigrants from Eastern Africa are Immigrants from Bulgaria (2.3%, a difference of 0.10%), Immigrants from Sweden (2.3%, a difference of 0.13%), Iranian (2.3%, a difference of 0.15%), Immigrants from Sudan (2.3%, a difference of 0.22%), and Immigrants from Lithuania (2.3%, a difference of 0.30%).
| Demographics | Rating | Rank | Self-Care Disability |
| Danes | 99.9 /100 | #31 | Exceptional 2.3% |
| Burmese | 99.9 /100 | #32 | Exceptional 2.3% |
| Immigrants from Korea | 99.9 /100 | #33 | Exceptional 2.3% |
| Immigrants from Turkey | 99.9 /100 | #34 | Exceptional 2.3% |
| Immigrants from Australia | 99.9 /100 | #35 | Exceptional 2.3% |
| Immigrants from Lithuania | 99.9 /100 | #36 | Exceptional 2.3% |
| Immigrants from Sweden | 99.9 /100 | #37 | Exceptional 2.3% |
| Immigrants from Eastern Africa | 99.9 /100 | #38 | Exceptional 2.3% |
| Immigrants from Bulgaria | 99.8 /100 | #39 | Exceptional 2.3% |
| Iranians | 99.8 /100 | #40 | Exceptional 2.3% |
| Immigrants from Sudan | 99.8 /100 | #41 | Exceptional 2.3% |
| Immigrants from Uganda | 99.8 /100 | #42 | Exceptional 2.3% |
| Immigrants from Pakistan | 99.8 /100 | #43 | Exceptional 2.3% |
| Immigrants from South Africa | 99.8 /100 | #44 | Exceptional 2.3% |
| Norwegians | 99.8 /100 | #45 | Exceptional 2.3% |
Immigrants from Eastern Africa Self-Care Disability Correlation Summary
| Measurement | Immigrants from Eastern Africa Data | Self-Care Disability Data |
| Minimum | 0.073% | 0.81% |
| Maximum | 33.8% | 7.5% |
| Range | 33.7% | 6.7% |
| Mean | 7.5% | 2.5% |
| Median | 5.9% | 2.3% |
| Interquartile 25% (IQ1) | 3.0% | 2.0% |
| Interquartile 75% (IQ3) | 9.6% | 2.6% |
| Interquartile Range (IQR) | 6.6% | 0.61% |
| Standard Deviation (Sample) | 6.7% | 1.1% |
| Standard Deviation (Population) | 6.7% | 1.1% |
Correlation Details
| Immigrants from Eastern Africa Percentile | Sample Size | Self-Care Disability |
[ 0.0% - 0.5% ] 0.073% | 181,286,818 | 2.6% |
[ 0.0% - 0.5% ] 0.23% | 69,804,466 | 2.4% |
[ 0.0% - 0.5% ] 0.41% | 33,874,280 | 2.3% |
[ 0.5% - 1.0% ] 0.57% | 20,706,109 | 2.3% |
[ 0.5% - 1.0% ] 0.74% | 11,295,113 | 2.3% |
[ 0.5% - 1.0% ] 0.90% | 6,838,620 | 2.1% |
[ 1.0% - 1.5% ] 1.06% | 5,282,324 | 2.3% |
[ 1.0% - 1.5% ] 1.24% | 4,499,038 | 2.1% |
[ 1.0% - 1.5% ] 1.39% | 2,026,545 | 2.0% |
[ 1.5% - 2.0% ] 1.56% | 3,404,297 | 2.0% |
[ 1.5% - 2.0% ] 1.72% | 1,509,476 | 1.8% |
[ 1.5% - 2.0% ] 1.91% | 955,348 | 2.3% |
[ 2.0% - 2.5% ] 2.06% | 1,461,616 | 2.1% |
[ 2.0% - 2.5% ] 2.22% | 1,496,824 | 2.0% |
[ 2.0% - 2.5% ] 2.37% | 1,666,379 | 2.4% |
[ 2.5% - 3.0% ] 2.56% | 631,845 | 2.1% |
[ 2.5% - 3.0% ] 2.71% | 675,661 | 2.2% |
[ 2.5% - 3.0% ] 2.92% | 704,192 | 2.3% |
[ 3.0% - 3.5% ] 3.06% | 673,311 | 2.1% |
[ 3.0% - 3.5% ] 3.20% | 260,180 | 1.9% |
[ 3.0% - 3.5% ] 3.40% | 445,037 | 2.4% |
[ 3.5% - 4.0% ] 3.55% | 558,032 | 2.1% |
[ 3.5% - 4.0% ] 3.72% | 785,892 | 2.3% |
[ 3.5% - 4.0% ] 3.88% | 266,089 | 2.3% |
[ 4.0% - 4.5% ] 4.06% | 189,772 | 1.8% |
[ 4.0% - 4.5% ] 4.21% | 63,699 | 2.1% |
[ 4.0% - 4.5% ] 4.35% | 145,660 | 2.0% |
[ 4.0% - 4.5% ] 4.48% | 309,518 | 2.2% |
[ 4.5% - 5.0% ] 4.71% | 372,083 | 1.7% |
[ 4.5% - 5.0% ] 4.90% | 583,075 | 2.6% |
[ 4.5% - 5.0% ] 4.99% | 146,510 | 2.6% |
[ 5.0% - 5.5% ] 5.27% | 20,037 | 1.1% |
[ 5.0% - 5.5% ] 5.34% | 146,778 | 2.9% |
[ 5.5% - 6.0% ] 5.52% | 148,794 | 1.4% |
[ 5.5% - 6.0% ] 5.66% | 60,781 | 2.6% |
[ 5.5% - 6.0% ] 5.82% | 8,232 | 3.5% |
[ 5.5% - 6.0% ] 5.97% | 32,524 | 2.1% |
[ 6.0% - 6.5% ] 6.31% | 44,512 | 2.4% |
[ 6.5% - 7.0% ] 6.52% | 141,127 | 2.5% |
[ 6.5% - 7.0% ] 6.67% | 167,562 | 2.0% |
[ 6.5% - 7.0% ] 6.87% | 114,071 | 1.9% |
[ 7.0% - 7.5% ] 7.04% | 81,317 | 3.0% |
[ 7.0% - 7.5% ] 7.16% | 40,566 | 2.4% |
[ 7.0% - 7.5% ] 7.35% | 75,527 | 2.7% |
[ 7.0% - 7.5% ] 7.44% | 112,595 | 1.5% |
[ 7.5% - 8.0% ] 7.71% | 120,966 | 2.4% |
[ 7.5% - 8.0% ] 7.84% | 14,521 | 2.3% |
[ 8.0% - 8.5% ] 8.01% | 73,858 | 2.3% |
[ 8.0% - 8.5% ] 8.18% | 20,561 | 0.81% |
[ 8.0% - 8.5% ] 8.33% | 19,531 | 1.2% |
[ 8.5% - 9.0% ] 8.56% | 25,823 | 1.0% |
[ 8.5% - 9.0% ] 8.62% | 86,918 | 1.8% |
[ 9.0% - 9.5% ] 9.33% | 24,308 | 2.4% |
[ 9.0% - 9.5% ] 9.48% | 42,084 | 3.5% |
[ 9.5% - 10.0% ] 9.74% | 6,497 | 3.0% |
[ 9.5% - 10.0% ] 9.92% | 32,014 | 4.9% |
[ 10.0% - 10.5% ] 10.12% | 1,403 | 6.9% |
[ 10.0% - 10.5% ] 10.45% | 3,914 | 3.0% |
[ 11.0% - 11.5% ] 11.23% | 4,346 | 2.3% |
[ 12.5% - 13.0% ] 12.79% | 30,927 | 1.9% |
[ 13.0% - 13.5% ] 13.02% | 338 | 2.1% |
[ 13.0% - 13.5% ] 13.17% | 8,290 | 4.8% |
[ 13.5% - 14.0% ] 13.95% | 28,172 | 4.8% |
[ 14.0% - 14.5% ] 14.17% | 27,523 | 1.2% |
[ 14.0% - 14.5% ] 14.18% | 7,703 | 5.0% |
[ 15.0% - 15.5% ] 15.16% | 4,280 | 2.7% |
[ 17.5% - 18.0% ] 17.82% | 26,684 | 1.4% |
[ 18.0% - 18.5% ] 18.03% | 14,553 | 1.6% |
[ 22.0% - 22.5% ] 22.30% | 1,157 | 2.0% |
[ 23.0% - 23.5% ] 23.25% | 4,572 | 1.1% |
[ 32.5% - 33.0% ] 32.97% | 182 | 3.4% |
[ 33.5% - 34.0% ] 33.82% | 8,892 | 7.5% |