Immigrants from Eastern Africa 2 or more Vehicles in Household
COMPARE
Immigrants from Eastern Africa
Select to Compare
2 or more Vehicles in Household
Immigrants from Eastern Africa 2 or more Vehicles in Household
53.7%
2+ VEHICLES AVAILABLE
5.1/ 100
METRIC RATING
226th/ 347
METRIC RANK
Immigrants from Eastern Africa 2 or more Vehicles in Household Correlation Chart
The statistical analysis conducted on geographies consisting of 354,928,878 people shows a slight negative correlation between the proportion of Immigrants from Eastern Africa and percentage of households with 2 or more vehicles available in the United States with a correlation coefficient (R) of -0.083 and weighted average of 53.7%. On average, for every 1% (one percent) increase in Immigrants from Eastern Africa within a typical geography, there is a decrease of 0.12% in percentage of households with 2 or more vehicles available.
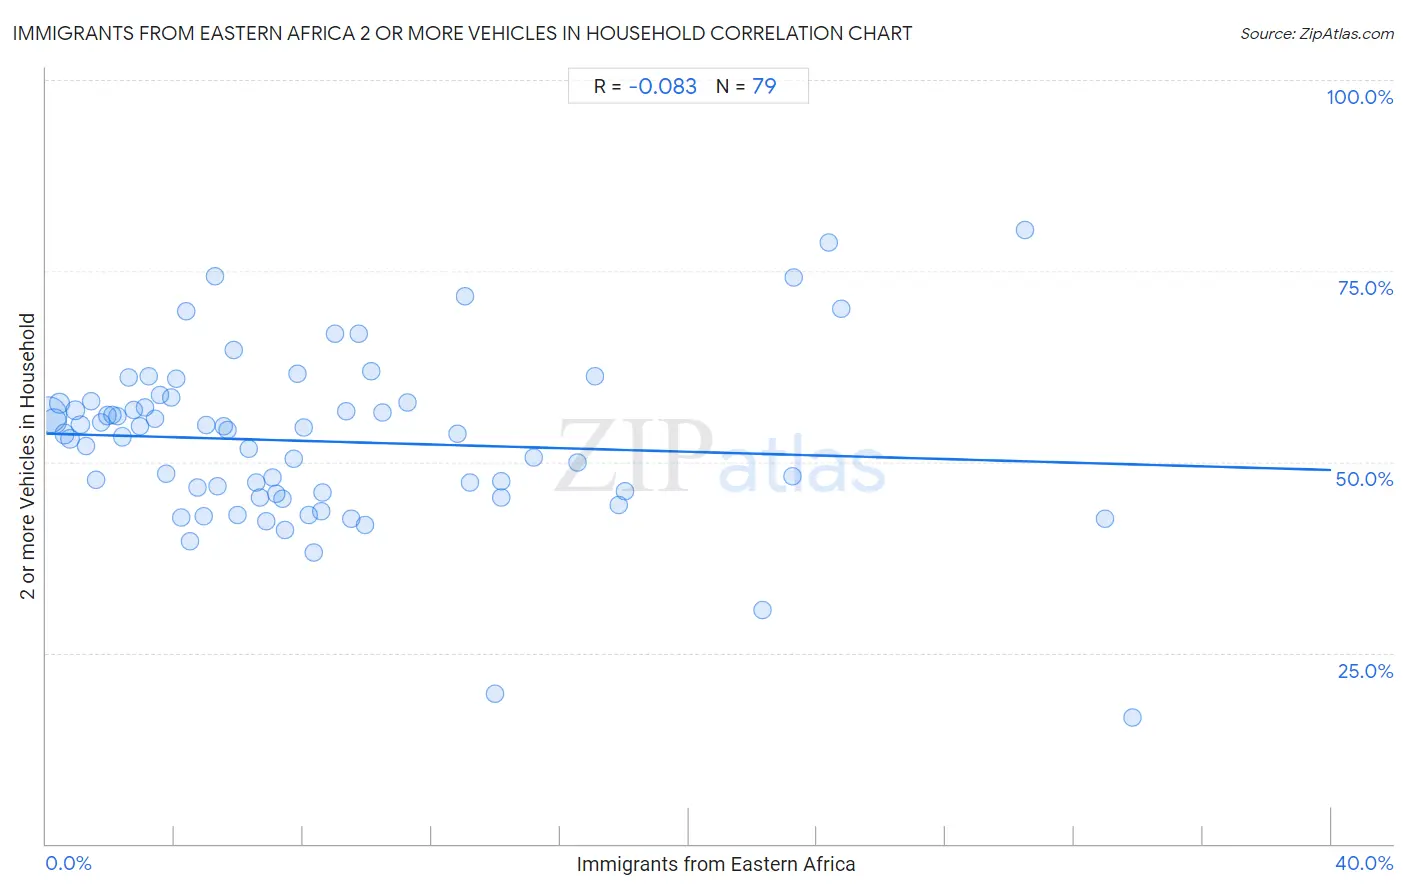
It is essential to understand that the correlation between the percentage of Immigrants from Eastern Africa and percentage of households with 2 or more vehicles available does not imply a direct cause-and-effect relationship. It remains uncertain whether the presence of Immigrants from Eastern Africa influences an upward or downward trend in the level of percentage of households with 2 or more vehicles available within an area, or if Immigrants from Eastern Africa simply ended up residing in those areas with higher or lower levels of percentage of households with 2 or more vehicles available due to other factors.
Demographics Similar to Immigrants from Eastern Africa by 2 or more Vehicles in Household
In terms of 2 or more vehicles in household, the demographic groups most similar to Immigrants from Eastern Africa are Immigrants from Egypt (53.8%, a difference of 0.020%), Brazilian (53.8%, a difference of 0.030%), Immigrants from Bosnia and Herzegovina (53.8%, a difference of 0.070%), Kiowa (53.9%, a difference of 0.20%), and Immigrants from Singapore (53.9%, a difference of 0.21%).
| Demographics | Rating | Rank | 2 or more Vehicles in Household |
| South American Indians | 6.5 /100 | #219 | Tragic 53.9% |
| Taiwanese | 6.3 /100 | #220 | Tragic 53.9% |
| Immigrants from Singapore | 6.3 /100 | #221 | Tragic 53.9% |
| Kiowa | 6.2 /100 | #222 | Tragic 53.9% |
| Immigrants from Bosnia and Herzegovina | 5.5 /100 | #223 | Tragic 53.8% |
| Brazilians | 5.3 /100 | #224 | Tragic 53.8% |
| Immigrants from Egypt | 5.2 /100 | #225 | Tragic 53.8% |
| Immigrants from Eastern Africa | 5.1 /100 | #226 | Tragic 53.7% |
| Sudanese | 4.1 /100 | #227 | Tragic 53.6% |
| Alaska Natives | 3.9 /100 | #228 | Tragic 53.6% |
| Immigrants from Turkey | 3.8 /100 | #229 | Tragic 53.6% |
| Immigrants from Nepal | 3.6 /100 | #230 | Tragic 53.5% |
| Panamanians | 3.4 /100 | #231 | Tragic 53.5% |
| Immigrants from Guatemala | 3.2 /100 | #232 | Tragic 53.5% |
| Ugandans | 3.2 /100 | #233 | Tragic 53.5% |
Immigrants from Eastern Africa 2 or more Vehicles in Household Correlation Summary
| Measurement | Immigrants from Eastern Africa Data | 2 or more Vehicles in Household Data |
| Minimum | 0.073% | 16.4% |
| Maximum | 33.8% | 80.4% |
| Range | 33.7% | 63.9% |
| Mean | 8.7% | 52.7% |
| Median | 6.7% | 53.7% |
| Interquartile 25% (IQ1) | 3.2% | 45.9% |
| Interquartile 75% (IQ3) | 11.2% | 57.8% |
| Interquartile Range (IQR) | 8.0% | 11.9% |
| Standard Deviation (Sample) | 7.7% | 11.1% |
| Standard Deviation (Population) | 7.7% | 11.0% |
Correlation Details
| Immigrants from Eastern Africa Percentile | Sample Size | 2 or more Vehicles in Household |
[ 0.0% - 0.5% ] 0.073% | 181,300,851 | 56.1% |
[ 0.0% - 0.5% ] 0.23% | 69,857,267 | 55.3% |
[ 0.0% - 0.5% ] 0.41% | 33,886,777 | 57.7% |
[ 0.5% - 1.0% ] 0.57% | 20,727,379 | 53.6% |
[ 0.5% - 1.0% ] 0.74% | 11,297,844 | 53.0% |
[ 0.5% - 1.0% ] 0.90% | 6,849,332 | 56.8% |
[ 1.0% - 1.5% ] 1.06% | 5,293,654 | 54.9% |
[ 1.0% - 1.5% ] 1.24% | 4,508,975 | 52.0% |
[ 1.0% - 1.5% ] 1.39% | 2,026,061 | 57.9% |
[ 1.5% - 2.0% ] 1.56% | 3,406,600 | 47.6% |
[ 1.5% - 2.0% ] 1.72% | 1,514,551 | 55.1% |
[ 1.5% - 2.0% ] 1.91% | 971,729 | 56.1% |
[ 2.0% - 2.5% ] 2.06% | 1,466,027 | 56.2% |
[ 2.0% - 2.5% ] 2.22% | 1,497,627 | 55.9% |
[ 2.0% - 2.5% ] 2.37% | 1,667,039 | 53.3% |
[ 2.5% - 3.0% ] 2.56% | 633,855 | 61.1% |
[ 2.5% - 3.0% ] 2.71% | 675,661 | 56.7% |
[ 2.5% - 3.0% ] 2.92% | 704,192 | 54.6% |
[ 3.0% - 3.5% ] 3.06% | 673,311 | 57.1% |
[ 3.0% - 3.5% ] 3.20% | 260,767 | 61.2% |
[ 3.0% - 3.5% ] 3.40% | 445,037 | 55.6% |
[ 3.5% - 4.0% ] 3.55% | 561,380 | 58.7% |
[ 3.5% - 4.0% ] 3.72% | 785,381 | 48.4% |
[ 3.5% - 4.0% ] 3.88% | 268,330 | 58.5% |
[ 4.0% - 4.5% ] 4.06% | 190,405 | 60.8% |
[ 4.0% - 4.5% ] 4.21% | 63,699 | 42.7% |
[ 4.0% - 4.5% ] 4.35% | 145,822 | 69.8% |
[ 4.0% - 4.5% ] 4.48% | 310,266 | 39.6% |
[ 4.5% - 5.0% ] 4.71% | 372,083 | 46.6% |
[ 4.5% - 5.0% ] 4.90% | 583,399 | 42.9% |
[ 4.5% - 5.0% ] 4.99% | 146,510 | 54.9% |
[ 5.0% - 5.5% ] 5.27% | 20,228 | 74.3% |
[ 5.0% - 5.5% ] 5.34% | 146,778 | 46.9% |
[ 5.5% - 6.0% ] 5.52% | 149,843 | 54.6% |
[ 5.5% - 6.0% ] 5.66% | 60,781 | 54.3% |
[ 5.5% - 6.0% ] 5.82% | 8,232 | 64.6% |
[ 5.5% - 6.0% ] 5.97% | 32,524 | 43.1% |
[ 6.0% - 6.5% ] 6.31% | 44,512 | 51.8% |
[ 6.5% - 7.0% ] 6.52% | 141,127 | 47.2% |
[ 6.5% - 7.0% ] 6.67% | 167,562 | 45.4% |
[ 6.5% - 7.0% ] 6.87% | 114,071 | 42.2% |
[ 7.0% - 7.5% ] 7.04% | 81,317 | 48.0% |
[ 7.0% - 7.5% ] 7.16% | 40,566 | 45.9% |
[ 7.0% - 7.5% ] 7.35% | 75,527 | 45.1% |
[ 7.0% - 7.5% ] 7.44% | 112,595 | 41.0% |
[ 7.5% - 8.0% ] 7.71% | 121,282 | 50.3% |
[ 7.5% - 8.0% ] 7.84% | 14,521 | 61.5% |
[ 8.0% - 8.5% ] 8.01% | 73,858 | 54.5% |
[ 8.0% - 8.5% ] 8.18% | 20,561 | 43.0% |
[ 8.0% - 8.5% ] 8.33% | 19,531 | 38.1% |
[ 8.5% - 9.0% ] 8.56% | 25,823 | 43.5% |
[ 8.5% - 9.0% ] 8.62% | 86,918 | 45.9% |
[ 8.5% - 9.0% ] 8.97% | 535 | 66.8% |
[ 9.0% - 9.5% ] 9.33% | 24,308 | 56.6% |
[ 9.0% - 9.5% ] 9.48% | 42,084 | 42.6% |
[ 9.5% - 10.0% ] 9.74% | 6,497 | 66.8% |
[ 9.5% - 10.0% ] 9.92% | 32,014 | 41.7% |
[ 10.0% - 10.5% ] 10.12% | 1,403 | 61.8% |
[ 10.0% - 10.5% ] 10.45% | 3,914 | 56.5% |
[ 11.0% - 11.5% ] 11.23% | 4,346 | 57.8% |
[ 12.5% - 13.0% ] 12.79% | 30,927 | 53.7% |
[ 13.0% - 13.5% ] 13.02% | 338 | 71.7% |
[ 13.0% - 13.5% ] 13.17% | 8,290 | 47.3% |
[ 13.5% - 14.0% ] 13.95% | 28,172 | 19.7% |
[ 14.0% - 14.5% ] 14.17% | 27,523 | 47.4% |
[ 14.0% - 14.5% ] 14.18% | 7,703 | 45.3% |
[ 15.0% - 15.5% ] 15.16% | 3,693 | 50.7% |
[ 16.5% - 17.0% ] 16.54% | 133 | 50.0% |
[ 17.0% - 17.5% ] 17.07% | 82 | 61.2% |
[ 17.5% - 18.0% ] 17.82% | 26,684 | 44.4% |
[ 18.0% - 18.5% ] 18.03% | 14,553 | 46.1% |
[ 22.0% - 22.5% ] 22.30% | 1,157 | 30.6% |
[ 23.0% - 23.5% ] 23.22% | 267 | 48.1% |
[ 23.0% - 23.5% ] 23.25% | 4,572 | 74.2% |
[ 24.0% - 24.5% ] 24.37% | 439 | 78.8% |
[ 24.5% - 25.0% ] 24.74% | 97 | 70.0% |
[ 30.0% - 30.5% ] 30.48% | 105 | 80.4% |
[ 32.5% - 33.0% ] 32.97% | 182 | 42.6% |
[ 33.5% - 34.0% ] 33.82% | 8,892 | 16.4% |