Immigrants from Eastern Africa Disability Age Under 5

COMPARE

Immigrants from Eastern Africa
Race
Ancestry
AfghanAfricanAlaska NativeAlaskan AthabascanAlbanianAleutAlsatianAmericanApacheArabArapahoArgentineanArmenianAssyrian/Chaldean/SyriacAustralianAustrianBahamianBangladeshiBarbadianBasqueBelgianBelizeanBermudanBhutaneseBlackfeetBolivianBrazilianBritishBritish West IndianBulgarianBurmeseCajunCambodianCanadianCape VerdeanCarpatho RusynCelticCentral AmericanCentral American IndianCherokeeCheyenneChickasawChileanChineseChippewaChoctawColombianColvilleComancheCosta RicanCreeCreekCroatianCrowCubanCypriotCzechCzechoslovakianDanishDelawareDominicanDutchDutch West IndianEastern EuropeanEcuadorianEgyptianEnglishEstonianEthiopianEuropeanFijianFilipinoFinnishFrenchFrench American IndianFrench CanadianGermanGerman RussianGhanaianGreekGuamanian/ChamorroGuatemalanGuyaneseHaitianHmongHonduranHopiHoumaHungarianIcelanderIndian (Asian)IndonesianInupiatIranianIraqiIrishIroquoisIsraeliItalianJamaicanJapaneseJordanianKenyanKiowaKoreanLaotianLatvianLebaneseLiberianLithuanianLumbeeLuxembourgerMacedonianMalaysianMalteseMarshalleseMenomineeMexicanMexican American IndianMongolianMoroccanNative HawaiianNavajoNepaleseNew ZealanderNicaraguanNigerianNorthern EuropeanNorwegianOkinawanOsageOttawaPaiutePakistaniPalestinianPanamanianParaguayanPennsylvania GermanPeruvianPimaPolishPortuguesePotawatomiPuebloPuerto RicanPuget Sound SalishRomanianRussianSalvadoranSamoanScandinavianScotch-IrishScottishSeminoleSenegaleseSerbianShoshoneSierra LeoneanSiouxSlavicSlovakSloveneSomaliSouth AfricanSouth AmericanSouth American IndianSoviet UnionSpaniardSpanishSpanish AmericanSpanish American IndianSri LankanSubsaharan AfricanSudaneseSwedishSwissSyrianTaiwaneseThaiTlingit-HaidaTohono O'OdhamTonganTrinidadian and TobagonianTsimshianTurkishU.S. Virgin IslanderUgandanUkrainianUruguayanUteVenezuelanVietnameseWelshWest IndianYakamaYaquiYugoslavianYumanYup'ikZimbabwean
Immigration
NonimmigrantsImmigrantsAfghanistanAfricaAlbaniaArgentinaArmeniaAsiaAustraliaAustriaBahamasBangladeshBarbadosBelarusBelgiumBelizeBoliviaBosnia and HerzegovinaBrazilBulgariaBurma/MyanmarCabo VerdeCambodiaCameroonCanadaCaribbeanCentral AmericaChileChinaColombiaCongoCosta RicaCroatiaCubaCzechoslovakiaDenmarkDominicaDominican RepublicEastern AfricaEastern AsiaEastern EuropeEcuadorEgyptEl SalvadorEnglandEritreaEthiopiaEuropeFijiFranceGermanyGhanaGreeceGrenadaGuatemalaGuyanaHaitiHondurasHong KongHungaryIndiaIndonesiaIranIraqIrelandIsraelItalyJamaicaJapanJordanKazakhstanKenyaKoreaKuwaitLaosLatin AmericaLatviaLebanonLiberiaLithuaniaMalaysiaMexicoMicronesiaMiddle AfricaMoldovaMoroccoNepalNetherlandsNicaraguaNigeriaNorth AmericaNorth MacedoniaNorthern AfricaNorthern EuropeNorwayOceaniaPakistanPanamaPeruPhilippinesPolandPortugalRomaniaRussiaSaudi ArabiaScotlandSenegalSerbiaSierra LeoneSingaporeSomaliaSouth AfricaSouth AmericaSouth Central AsiaSouth Eastern AsiaSouthern EuropeSpainSri LankaSt. Vincent and the GrenadinesSudanSwedenSwitzerlandSyriaTaiwanThailandTrinidad and TobagoTurkeyUgandaUkraineUruguayUzbekistanVenezuelaVietnamWest IndiesWestern AfricaWestern AsiaWestern EuropeYemenZaireZimbabweAzores
Select to Compare
Race
Ancestry
AfghanAfricanAlaska NativeAlaskan AthabascanAlbanianAleutAlsatianAmericanApacheArabArapahoArgentineanArmenianAssyrian/Chaldean/SyriacAustralianAustrianBahamianBangladeshiBarbadianBasqueBelgianBelizeanBermudanBhutaneseBlackfeetBolivianBrazilianBritishBritish West IndianBulgarianBurmeseCajunCambodianCanadianCape VerdeanCarpatho RusynCelticCentral AmericanCentral American IndianCherokeeCheyenneChickasawChileanChineseChippewaChoctawColombianColvilleComancheCosta RicanCreeCreekCroatianCrowCubanCypriotCzechCzechoslovakianDanishDelawareDominicanDutchDutch West IndianEastern EuropeanEcuadorianEgyptianEnglishEstonianEthiopianEuropeanFijianFilipinoFinnishFrenchFrench American IndianFrench CanadianGermanGerman RussianGhanaianGreekGuamanian/ChamorroGuatemalanGuyaneseHaitianHmongHonduranHopiHoumaHungarianIcelanderIndian (Asian)IndonesianInupiatIranianIraqiIrishIroquoisIsraeliItalianJamaicanJapaneseJordanianKenyanKiowaKoreanLaotianLatvianLebaneseLiberianLithuanianLumbeeLuxembourgerMacedonianMalaysianMalteseMarshalleseMenomineeMexicanMexican American IndianMongolianMoroccanNative HawaiianNavajoNepaleseNew ZealanderNicaraguanNigerianNorthern EuropeanNorwegianOkinawanOsageOttawaPaiutePakistaniPalestinianPanamanianParaguayanPennsylvania GermanPeruvianPimaPolishPortuguesePotawatomiPuebloPuerto RicanPuget Sound SalishRomanianRussianSalvadoranSamoanScandinavianScotch-IrishScottishSeminoleSenegaleseSerbianShoshoneSierra LeoneanSiouxSlavicSlovakSloveneSomaliSouth AfricanSouth AmericanSouth American IndianSoviet UnionSpaniardSpanishSpanish AmericanSpanish American IndianSri LankanSubsaharan AfricanSudaneseSwedishSwissSyrianTaiwaneseThaiTlingit-HaidaTohono O'OdhamTonganTrinidadian and TobagonianTsimshianTurkishU.S. Virgin IslanderUgandanUkrainianUruguayanUteVenezuelanVietnameseWelshWest IndianYakamaYaquiYugoslavianYumanYup'ikZimbabwean
Immigration
NonimmigrantsImmigrantsAfghanistanAfricaAlbaniaArgentinaArmeniaAsiaAustraliaAustriaBahamasBangladeshBarbadosBelarusBelgiumBelizeBoliviaBosnia and HerzegovinaBrazilBulgariaBurma/MyanmarCabo VerdeCambodiaCameroonCanadaCaribbeanCentral AmericaChileChinaColombiaCongoCosta RicaCroatiaCubaCzechoslovakiaDenmarkDominicaDominican RepublicEastern AsiaEastern EuropeEcuadorEgyptEl SalvadorEnglandEritreaEthiopiaEuropeFijiFranceGermanyGhanaGreeceGrenadaGuatemalaGuyanaHaitiHondurasHong KongHungaryIndiaIndonesiaIranIraqIrelandIsraelItalyJamaicaJapanJordanKazakhstanKenyaKoreaKuwaitLaosLatin AmericaLatviaLebanonLiberiaLithuaniaMalaysiaMexicoMicronesiaMiddle AfricaMoldovaMoroccoNepalNetherlandsNicaraguaNigeriaNorth AmericaNorth MacedoniaNorthern AfricaNorthern EuropeNorwayOceaniaPakistanPanamaPeruPhilippinesPolandPortugalRomaniaRussiaSaudi ArabiaScotlandSenegalSerbiaSierra LeoneSingaporeSomaliaSouth AfricaSouth AmericaSouth Central AsiaSouth Eastern AsiaSouthern EuropeSpainSri LankaSt. Vincent and the GrenadinesSudanSwedenSwitzerlandSyriaTaiwanThailandTrinidad and TobagoTurkeyUgandaUkraineUruguayUzbekistanVenezuelaVietnamWest IndiesWestern AfricaWestern AsiaWestern EuropeYemenZaireZimbabweAzores
Disability Age Under 5
Income
Poverty
Unemployment
Labor Participation
Family Structure
Vehicle Availability
Education Level
Disability

Immigrants from Eastern Africa Disability Age Under 5
Excellent

1.2%
DISABILITY | AGE UNDER 5
83.1/ 100
METRIC RATING
137th/ 347
METRIC RANK

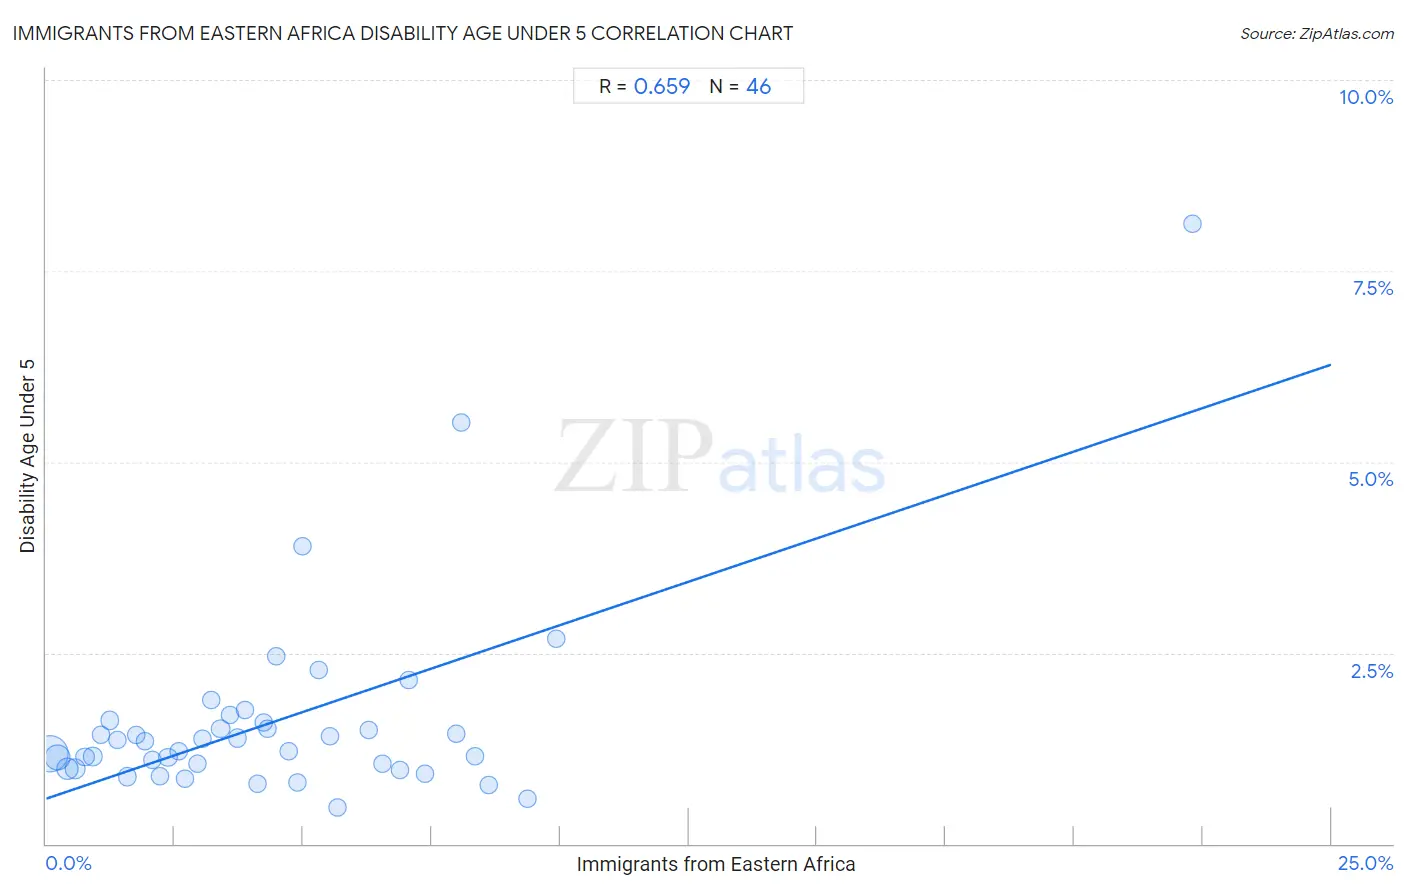
Immigrants from Eastern Africa Disability Age Under 5 Correlation Chart

The statistical analysis conducted on geographies consisting of 202,266,724 people shows a significant positive correlation between the proportion of Immigrants from Eastern Africa and percentage of population with a disability under the age of 5 in the United States with a correlation coefficient (R) of 0.659 and weighted average of 1.2%. On average, for every 1% (one percent) increase in Immigrants from Eastern Africa within a typical geography, there is an increase of 0.23% in percentage of population with a disability under the age of 5.
Immigrants from Eastern Africa Disability Age Under 5
It is essential to understand that the correlation between the percentage of Immigrants from Eastern Africa and percentage of population with a disability under the age of 5 does not imply a direct cause-and-effect relationship. It remains uncertain whether the presence of Immigrants from Eastern Africa influences an upward or downward trend in the level of percentage of population with a disability under the age of 5 within an area, or if Immigrants from Eastern Africa simply ended up residing in those areas with higher or lower levels of percentage of population with a disability under the age of 5 due to other factors.

Demographics Similar to Immigrants from Eastern Africa by Disability Age Under 5

In terms of disability age under 5, the demographic groups most similar to Immigrants from Eastern Africa are Immigrants from Czechoslovakia (1.2%, a difference of 0.050%), Moroccan (1.2%, a difference of 0.090%), Fijian (1.2%, a difference of 0.27%), New Zealander (1.2%, a difference of 0.28%), and Somali (1.2%, a difference of 0.37%).
DemographicsRating | RankDisability Age Under 5
Koreans
87.7
/100
|
#130
Excellent
1.2%
Immigrants from Serbia
87.6
/100
|
#131
Excellent
1.2%
Immigrants from Eastern Europe
87.3
/100
|
#132
Excellent
1.2%
Immigrants from Spain
86.5
/100
|
#133
Excellent
1.2%
Argentineans
85.7
/100
|
#134
Excellent
1.2%
Fijians
84.7
/100
|
#135
Excellent
1.2%
Moroccans
83.6
/100
|
#136
Excellent
1.2%
Immigrants from Eastern Africa
83.1
/100
|
#137
Excellent
1.2%
Immigrants from Czechoslovakia
82.8
/100
|
#138
Excellent
1.2%
New Zealanders
81.4
/100
|
#139
Excellent
1.2%
Somalis
80.8
/100
|
#140
Excellent
1.2%
Immigrants from Honduras
80.4
/100
|
#141
Excellent
1.2%
Immigrants from Colombia
79.3
/100
|
#142
Good
1.2%
Alsatians
79.3
/100
|
#143
Good
1.2%
Immigrants from Middle Africa
79.3
/100
|
#144
Good
1.2%

Immigrants from Eastern Africa Disability Age Under 5 Correlation Summary

MeasurementImmigrants from Eastern Africa DataDisability Age Under 5 Data
Minimum0.075%0.48%
Maximum22.3%8.1%
Range22.2%7.6%
Mean4.4%1.6%
Median3.8%1.3%
Interquartile 25% (IQ1)1.9%0.98%
Interquartile 75% (IQ3)6.3%1.6%
Interquartile Range (IQR)4.4%0.60%
Standard Deviation (Sample)3.8%1.3%
Standard Deviation (Population)3.7%1.3%

Correlation Details

Immigrants from Eastern Africa PercentileSample SizeDisability Age Under 5
[
0.0%
-
0.5%
]
0.075%
101,926,4781.2%
[
0.0%
-
0.5%
]
0.23%
40,911,2351.1%
[
0.0%
-
0.5%
]
0.42%
20,609,3130.98%
[
0.5%
-
1.0%
]
0.56%
12,669,2570.97%
[
0.5%
-
1.0%
]
0.75%
6,123,8021.1%
[
0.5%
-
1.0%
]
0.91%
3,742,5701.1%
[
1.0%
-
1.5%
]
1.07%
2,722,1401.4%
[
1.0%
-
1.5%
]
1.23%
2,556,5771.6%
[
1.0%
-
1.5%
]
1.38%
914,8011.4%
[
1.5%
-
2.0%
]
1.58%
1,994,4390.88%
[
1.5%
-
2.0%
]
1.74%
434,2481.4%
[
1.5%
-
2.0%
]
1.92%
363,2371.3%
[
2.0%
-
2.5%
]
2.06%
1,033,9041.1%
[
2.0%
-
2.5%
]
2.21%
592,7200.88%
[
2.0%
-
2.5%
]
2.37%
1,309,9611.1%
[
2.5%
-
3.0%
]
2.57%
289,4141.2%
[
2.5%
-
3.0%
]
2.71%
456,2670.85%
[
2.5%
-
3.0%
]
2.94%
341,3341.0%
[
3.0%
-
3.5%
]
3.05%
421,0981.4%
[
3.0%
-
3.5%
]
3.22%
96,4851.9%
[
3.0%
-
3.5%
]
3.39%
189,1571.5%
[
3.5%
-
4.0%
]
3.57%
203,0591.7%
[
3.5%
-
4.0%
]
3.73%
583,8161.4%
[
3.5%
-
4.0%
]
3.86%
140,5561.7%
[
4.0%
-
4.5%
]
4.11%
36,2650.79%
[
4.0%
-
4.5%
]
4.22%
17,0991.6%
[
4.0%
-
4.5%
]
4.30%
43,7021.5%
[
4.0%
-
4.5%
]
4.48%
116,8412.5%
[
4.5%
-
5.0%
]
4.71%
246,7671.2%
[
4.5%
-
5.0%
]
4.90%
465,1380.80%
[
4.5%
-
5.0%
]
4.99%
128,4983.9%
[
5.0%
-
5.5%
]
5.30%
86,1842.3%
[
5.5%
-
6.0%
]
5.52%
48,9301.4%
[
5.5%
-
6.0%
]
5.67%
48,8740.48%
[
6.0%
-
6.5%
]
6.28%
30,9731.5%
[
6.5%
-
7.0%
]
6.53%
36,7241.0%
[
6.5%
-
7.0%
]
6.87%
77,2590.96%
[
7.0%
-
7.5%
]
7.04%
81,3172.2%
[
7.0%
-
7.5%
]
7.38%
43,3910.91%
[
7.5%
-
8.0%
]
7.98%
22,8671.4%
[
8.0%
-
8.5%
]
8.08%
3,0195.5%
[
8.0%
-
8.5%
]
8.33%
19,5311.2%
[
8.5%
-
9.0%
]
8.60%
49,7110.78%
[
9.0%
-
9.5%
]
9.36%
5,9840.59%
[
9.5%
-
10.0%
]
9.92%
30,6252.7%
[
22.0%
-
22.5%
]
22.30%
1,1578.1%