Immigrants from Colombia GED/Equivalency
COMPARE
Immigrants from Colombia
Select to Compare
GED/Equivalency
Immigrants from Colombia GED/Equivalency
84.4%
GED/EQUIVALENCY
4.5/ 100
METRIC RATING
230th/ 347
METRIC RANK
Immigrants from Colombia GED/Equivalency Correlation Chart
The statistical analysis conducted on geographies consisting of 378,643,668 people shows a poor positive correlation between the proportion of Immigrants from Colombia and percentage of population with at least ged/equivalency education in the United States with a correlation coefficient (R) of 0.199 and weighted average of 84.4%. On average, for every 1% (one percent) increase in Immigrants from Colombia within a typical geography, there is an increase of 0.19% in percentage of population with at least ged/equivalency education.
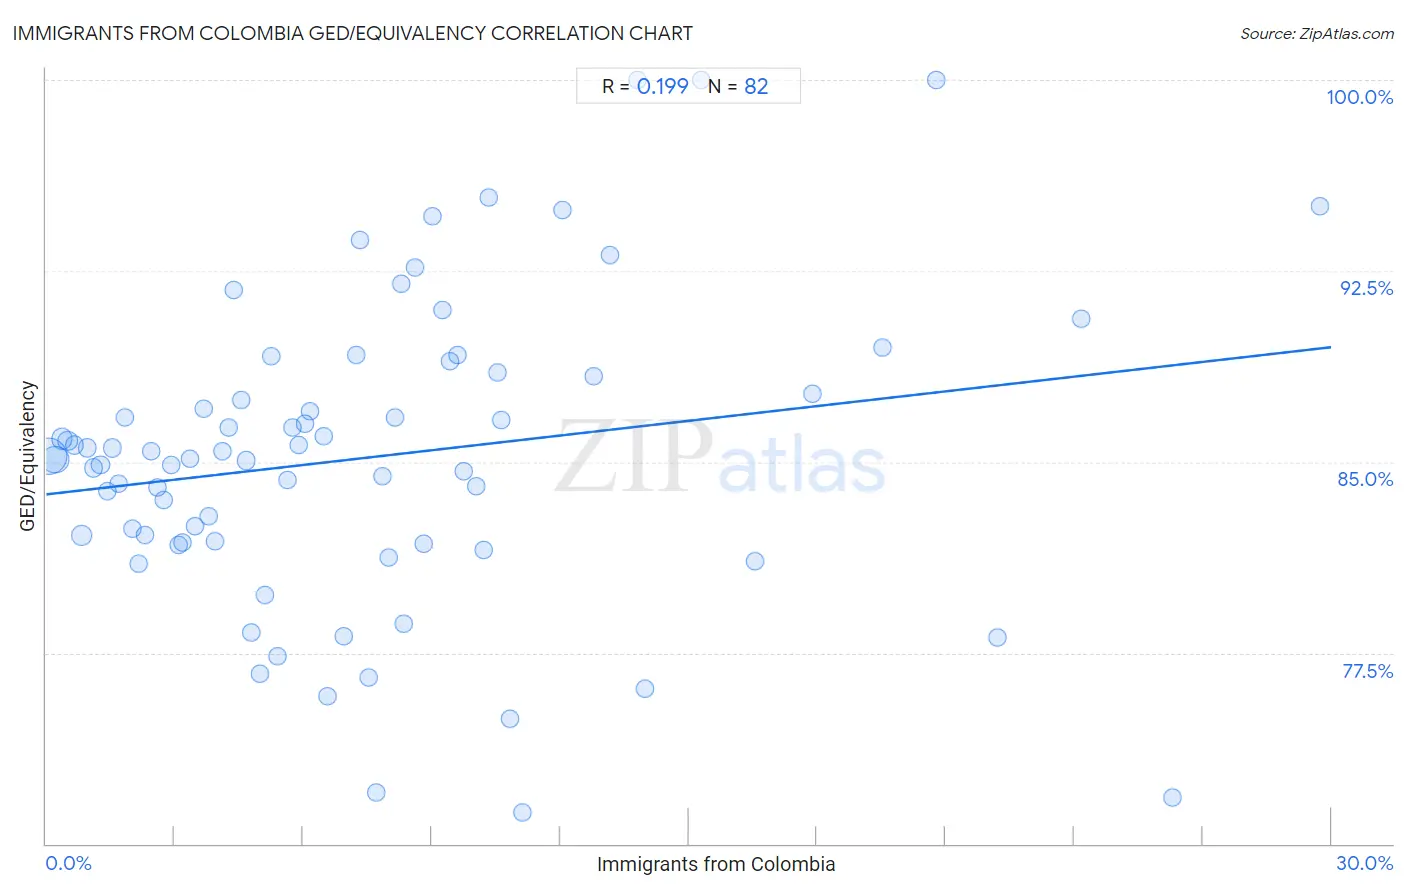
It is essential to understand that the correlation between the percentage of Immigrants from Colombia and percentage of population with at least ged/equivalency education does not imply a direct cause-and-effect relationship. It remains uncertain whether the presence of Immigrants from Colombia influences an upward or downward trend in the level of percentage of population with at least ged/equivalency education within an area, or if Immigrants from Colombia simply ended up residing in those areas with higher or lower levels of percentage of population with at least ged/equivalency education due to other factors.
Demographics Similar to Immigrants from Colombia by GED/Equivalency
In terms of ged/equivalency, the demographic groups most similar to Immigrants from Colombia are Immigrants from Uruguay (84.4%, a difference of 0.010%), Immigrants from Middle Africa (84.4%, a difference of 0.030%), Immigrants from Liberia (84.4%, a difference of 0.040%), Immigrants from South America (84.4%, a difference of 0.040%), and Immigrants from Panama (84.4%, a difference of 0.050%).
| Demographics | Rating | Rank | GED/Equivalency |
| Immigrants from Uzbekistan | 7.1 /100 | #223 | Tragic 84.6% |
| French American Indians | 6.3 /100 | #224 | Tragic 84.6% |
| Immigrants from Thailand | 5.8 /100 | #225 | Tragic 84.5% |
| Immigrants from Zaire | 5.5 /100 | #226 | Tragic 84.5% |
| Immigrants from Costa Rica | 5.4 /100 | #227 | Tragic 84.5% |
| Immigrants from Liberia | 4.9 /100 | #228 | Tragic 84.4% |
| Immigrants from Uruguay | 4.6 /100 | #229 | Tragic 84.4% |
| Immigrants from Colombia | 4.5 /100 | #230 | Tragic 84.4% |
| Immigrants from Middle Africa | 4.3 /100 | #231 | Tragic 84.4% |
| Immigrants from South America | 4.2 /100 | #232 | Tragic 84.4% |
| Immigrants from Panama | 4.1 /100 | #233 | Tragic 84.4% |
| Immigrants from Nigeria | 3.6 /100 | #234 | Tragic 84.3% |
| Ghanaians | 3.5 /100 | #235 | Tragic 84.3% |
| Immigrants from Eritrea | 3.5 /100 | #236 | Tragic 84.3% |
| Sub-Saharan Africans | 3.0 /100 | #237 | Tragic 84.2% |
Immigrants from Colombia GED/Equivalency Correlation Summary
| Measurement | Immigrants from Colombia Data | GED/Equivalency Data |
| Minimum | 0.069% | 71.2% |
| Maximum | 29.7% | 100.0% |
| Range | 29.7% | 28.8% |
| Mean | 7.5% | 85.2% |
| Median | 6.1% | 85.2% |
| Interquartile 25% (IQ1) | 3.1% | 81.9% |
| Interquartile 75% (IQ3) | 10.0% | 88.4% |
| Interquartile Range (IQR) | 7.0% | 6.5% |
| Standard Deviation (Sample) | 6.2% | 6.0% |
| Standard Deviation (Population) | 6.2% | 6.0% |
Correlation Details
| Immigrants from Colombia Percentile | Sample Size | GED/Equivalency |
[ 0.0% - 0.5% ] 0.069% | 175,605,766 | 85.2% |
[ 0.0% - 0.5% ] 0.21% | 89,559,036 | 85.1% |
[ 0.0% - 0.5% ] 0.37% | 33,695,597 | 85.9% |
[ 0.5% - 1.0% ] 0.51% | 18,800,866 | 85.8% |
[ 0.5% - 1.0% ] 0.66% | 10,462,348 | 85.7% |
[ 0.5% - 1.0% ] 0.83% | 15,666,676 | 82.1% |
[ 0.5% - 1.0% ] 0.96% | 4,862,811 | 85.6% |
[ 1.0% - 1.5% ] 1.11% | 4,351,434 | 84.8% |
[ 1.0% - 1.5% ] 1.26% | 2,966,364 | 84.9% |
[ 1.0% - 1.5% ] 1.42% | 2,394,281 | 83.8% |
[ 1.5% - 2.0% ] 1.55% | 2,126,164 | 85.5% |
[ 1.5% - 2.0% ] 1.70% | 1,628,138 | 84.1% |
[ 1.5% - 2.0% ] 1.84% | 1,384,156 | 86.8% |
[ 2.0% - 2.5% ] 2.01% | 995,818 | 82.4% |
[ 2.0% - 2.5% ] 2.16% | 1,415,650 | 81.0% |
[ 2.0% - 2.5% ] 2.30% | 597,394 | 82.1% |
[ 2.0% - 2.5% ] 2.44% | 701,817 | 85.4% |
[ 2.5% - 3.0% ] 2.60% | 669,818 | 84.0% |
[ 2.5% - 3.0% ] 2.75% | 700,589 | 83.5% |
[ 2.5% - 3.0% ] 2.91% | 769,485 | 84.9% |
[ 3.0% - 3.5% ] 3.08% | 1,043,598 | 81.7% |
[ 3.0% - 3.5% ] 3.17% | 528,669 | 81.9% |
[ 3.0% - 3.5% ] 3.34% | 449,447 | 85.1% |
[ 3.0% - 3.5% ] 3.47% | 804,095 | 82.5% |
[ 3.5% - 4.0% ] 3.67% | 487,801 | 87.1% |
[ 3.5% - 4.0% ] 3.80% | 522,074 | 82.9% |
[ 3.5% - 4.0% ] 3.95% | 621,554 | 81.9% |
[ 4.0% - 4.5% ] 4.12% | 391,299 | 85.4% |
[ 4.0% - 4.5% ] 4.25% | 324,853 | 86.4% |
[ 4.0% - 4.5% ] 4.39% | 118,938 | 91.7% |
[ 4.5% - 5.0% ] 4.56% | 180,514 | 87.4% |
[ 4.5% - 5.0% ] 4.66% | 275,327 | 85.0% |
[ 4.5% - 5.0% ] 4.78% | 92,461 | 78.3% |
[ 4.5% - 5.0% ] 4.98% | 168,461 | 76.7% |
[ 5.0% - 5.5% ] 5.11% | 430,423 | 79.8% |
[ 5.0% - 5.5% ] 5.25% | 337,142 | 89.1% |
[ 5.0% - 5.5% ] 5.40% | 95,850 | 77.4% |
[ 5.5% - 6.0% ] 5.63% | 70,445 | 84.3% |
[ 5.5% - 6.0% ] 5.74% | 41,193 | 86.4% |
[ 5.5% - 6.0% ] 5.89% | 258,669 | 85.7% |
[ 6.0% - 6.5% ] 6.03% | 131,861 | 86.5% |
[ 6.0% - 6.5% ] 6.16% | 110,819 | 87.0% |
[ 6.0% - 6.5% ] 6.48% | 126,255 | 86.0% |
[ 6.5% - 7.0% ] 6.57% | 98,113 | 75.8% |
[ 6.5% - 7.0% ] 6.94% | 66,333 | 78.2% |
[ 7.0% - 7.5% ] 7.25% | 35,967 | 89.2% |
[ 7.0% - 7.5% ] 7.32% | 33,204 | 93.7% |
[ 7.5% - 8.0% ] 7.52% | 85,062 | 76.6% |
[ 7.5% - 8.0% ] 7.71% | 135,665 | 72.0% |
[ 7.5% - 8.0% ] 7.84% | 34,809 | 84.4% |
[ 7.5% - 8.0% ] 7.98% | 67,213 | 81.3% |
[ 8.0% - 8.5% ] 8.13% | 70,030 | 86.7% |
[ 8.0% - 8.5% ] 8.28% | 28,693 | 92.0% |
[ 8.0% - 8.5% ] 8.34% | 121,169 | 78.6% |
[ 8.5% - 9.0% ] 8.61% | 50,017 | 92.6% |
[ 8.5% - 9.0% ] 8.82% | 150,087 | 81.8% |
[ 9.0% - 9.5% ] 9.02% | 110,087 | 94.6% |
[ 9.0% - 9.5% ] 9.26% | 57,557 | 91.0% |
[ 9.0% - 9.5% ] 9.42% | 45,818 | 88.9% |
[ 9.5% - 10.0% ] 9.60% | 39,141 | 89.2% |
[ 9.5% - 10.0% ] 9.74% | 115,726 | 84.6% |
[ 10.0% - 10.5% ] 10.04% | 110,071 | 84.0% |
[ 10.0% - 10.5% ] 10.21% | 58,702 | 81.5% |
[ 10.0% - 10.5% ] 10.34% | 6,202 | 95.4% |
[ 10.5% - 11.0% ] 10.54% | 16,651 | 88.5% |
[ 10.5% - 11.0% ] 10.63% | 15,622 | 86.7% |
[ 10.5% - 11.0% ] 10.84% | 45,357 | 74.9% |
[ 11.0% - 11.5% ] 11.11% | 18,426 | 71.2% |
[ 12.0% - 12.5% ] 12.05% | 31,514 | 94.9% |
[ 12.5% - 13.0% ] 12.78% | 7,217 | 88.4% |
[ 13.0% - 13.5% ] 13.16% | 342 | 93.1% |
[ 13.5% - 14.0% ] 13.79% | 58 | 100.0% |
[ 13.5% - 14.0% ] 13.98% | 11,069 | 76.1% |
[ 15.0% - 15.5% ] 15.29% | 255 | 100.0% |
[ 16.5% - 17.0% ] 16.54% | 133 | 81.1% |
[ 17.5% - 18.0% ] 17.88% | 6,186 | 87.7% |
[ 19.5% - 20.0% ] 19.51% | 41 | 89.5% |
[ 20.5% - 21.0% ] 20.78% | 154 | 100.0% |
[ 22.0% - 22.5% ] 22.22% | 180 | 78.1% |
[ 24.0% - 24.5% ] 24.16% | 269 | 90.6% |
[ 26.0% - 26.5% ] 26.29% | 1,761 | 71.8% |
[ 29.5% - 30.0% ] 29.74% | 2,811 | 95.0% |