Immigrants from Colombia 4 or more Vehicles in Household
COMPARE
Immigrants from Colombia
Select to Compare
4 or more Vehicles in Household
Immigrants from Colombia 4 or more Vehicles in Household
5.4%
4+ VEHICLES AVAILABLE
0.2/ 100
METRIC RATING
286th/ 347
METRIC RANK
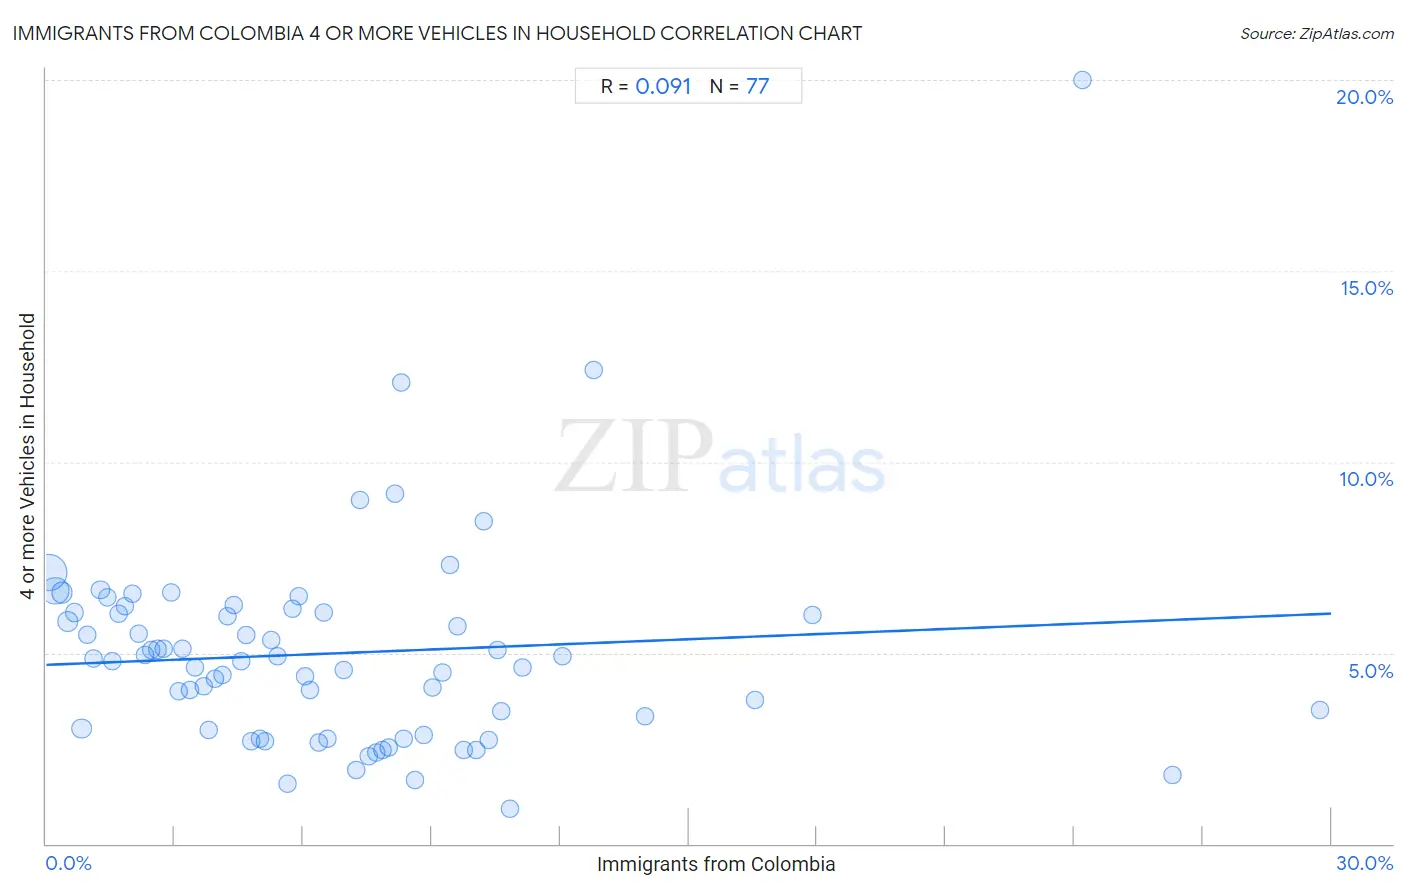
Immigrants from Colombia 4 or more Vehicles in Household Correlation Chart
The statistical analysis conducted on geographies consisting of 377,020,120 people shows a slight positive correlation between the proportion of Immigrants from Colombia and percentage of households with 4 or more vehicles available in the United States with a correlation coefficient (R) of 0.091 and weighted average of 5.4%. On average, for every 1% (one percent) increase in Immigrants from Colombia within a typical geography, there is an increase of 0.045% in percentage of households with 4 or more vehicles available.
It is essential to understand that the correlation between the percentage of Immigrants from Colombia and percentage of households with 4 or more vehicles available does not imply a direct cause-and-effect relationship. It remains uncertain whether the presence of Immigrants from Colombia influences an upward or downward trend in the level of percentage of households with 4 or more vehicles available within an area, or if Immigrants from Colombia simply ended up residing in those areas with higher or lower levels of percentage of households with 4 or more vehicles available due to other factors.
Demographics Similar to Immigrants from Colombia by 4 or more Vehicles in Household
In terms of 4 or more vehicles in household, the demographic groups most similar to Immigrants from Colombia are Immigrants from Liberia (5.4%, a difference of 0.040%), Immigrants from Croatia (5.4%, a difference of 0.10%), Venezuelan (5.3%, a difference of 0.28%), Brazilian (5.4%, a difference of 0.38%), and Immigrants from Bosnia and Herzegovina (5.3%, a difference of 0.42%).
| Demographics | Rating | Rank | 4 or more Vehicles in Household |
| Immigrants from Uruguay | 0.3 /100 | #279 | Tragic 5.4% |
| Alsatians | 0.3 /100 | #280 | Tragic 5.4% |
| Immigrants from Western Africa | 0.3 /100 | #281 | Tragic 5.4% |
| Immigrants from Spain | 0.3 /100 | #282 | Tragic 5.4% |
| Immigrants from Ireland | 0.3 /100 | #283 | Tragic 5.4% |
| Brazilians | 0.3 /100 | #284 | Tragic 5.4% |
| Immigrants from Liberia | 0.2 /100 | #285 | Tragic 5.4% |
| Immigrants from Colombia | 0.2 /100 | #286 | Tragic 5.4% |
| Immigrants from Croatia | 0.2 /100 | #287 | Tragic 5.4% |
| Venezuelans | 0.2 /100 | #288 | Tragic 5.3% |
| Immigrants from Bosnia and Herzegovina | 0.2 /100 | #289 | Tragic 5.3% |
| Immigrants from Russia | 0.2 /100 | #290 | Tragic 5.3% |
| Immigrants from Bahamas | 0.1 /100 | #291 | Tragic 5.3% |
| Liberians | 0.1 /100 | #292 | Tragic 5.3% |
| Immigrants from Congo | 0.1 /100 | #293 | Tragic 5.2% |
Immigrants from Colombia 4 or more Vehicles in Household Correlation Summary
| Measurement | Immigrants from Colombia Data | 4 or more Vehicles in Household Data |
| Minimum | 0.069% | 0.92% |
| Maximum | 29.7% | 20.0% |
| Range | 29.7% | 19.1% |
| Mean | 6.7% | 5.0% |
| Median | 5.7% | 4.8% |
| Interquartile 25% (IQ1) | 2.8% | 2.9% |
| Interquartile 75% (IQ3) | 9.1% | 6.0% |
| Interquartile Range (IQR) | 6.3% | 3.1% |
| Standard Deviation (Sample) | 5.6% | 2.8% |
| Standard Deviation (Population) | 5.6% | 2.7% |
Correlation Details
| Immigrants from Colombia Percentile | Sample Size | 4 or more Vehicles in Household |
[ 0.0% - 0.5% ] 0.069% | 175,327,211 | 7.1% |
[ 0.0% - 0.5% ] 0.21% | 89,158,698 | 6.6% |
[ 0.0% - 0.5% ] 0.37% | 33,473,018 | 6.6% |
[ 0.5% - 1.0% ] 0.51% | 18,628,410 | 5.8% |
[ 0.5% - 1.0% ] 0.66% | 10,289,316 | 6.1% |
[ 0.5% - 1.0% ] 0.83% | 15,652,629 | 3.0% |
[ 0.5% - 1.0% ] 0.96% | 4,787,212 | 5.5% |
[ 1.0% - 1.5% ] 1.11% | 4,288,149 | 4.8% |
[ 1.0% - 1.5% ] 1.26% | 2,872,900 | 6.6% |
[ 1.0% - 1.5% ] 1.42% | 2,387,001 | 6.4% |
[ 1.5% - 2.0% ] 1.55% | 2,108,793 | 4.8% |
[ 1.5% - 2.0% ] 1.70% | 1,618,572 | 6.0% |
[ 1.5% - 2.0% ] 1.84% | 1,372,214 | 6.2% |
[ 2.0% - 2.5% ] 2.01% | 995,818 | 6.5% |
[ 2.0% - 2.5% ] 2.16% | 1,412,818 | 5.5% |
[ 2.0% - 2.5% ] 2.30% | 581,459 | 4.9% |
[ 2.0% - 2.5% ] 2.45% | 688,431 | 5.1% |
[ 2.5% - 3.0% ] 2.60% | 669,621 | 5.1% |
[ 2.5% - 3.0% ] 2.75% | 697,835 | 5.1% |
[ 2.5% - 3.0% ] 2.91% | 769,485 | 6.6% |
[ 3.0% - 3.5% ] 3.08% | 1,043,598 | 4.0% |
[ 3.0% - 3.5% ] 3.17% | 528,669 | 5.1% |
[ 3.0% - 3.5% ] 3.34% | 449,447 | 4.0% |
[ 3.0% - 3.5% ] 3.47% | 797,829 | 4.6% |
[ 3.5% - 4.0% ] 3.67% | 484,095 | 4.1% |
[ 3.5% - 4.0% ] 3.80% | 522,074 | 3.0% |
[ 3.5% - 4.0% ] 3.95% | 621,554 | 4.3% |
[ 4.0% - 4.5% ] 4.12% | 389,882 | 4.4% |
[ 4.0% - 4.5% ] 4.25% | 297,914 | 6.0% |
[ 4.0% - 4.5% ] 4.39% | 116,706 | 6.3% |
[ 4.5% - 5.0% ] 4.56% | 180,514 | 4.8% |
[ 4.5% - 5.0% ] 4.67% | 270,735 | 5.5% |
[ 4.5% - 5.0% ] 4.78% | 92,461 | 2.7% |
[ 4.5% - 5.0% ] 4.98% | 167,153 | 2.8% |
[ 5.0% - 5.5% ] 5.11% | 430,423 | 2.7% |
[ 5.0% - 5.5% ] 5.25% | 333,983 | 5.3% |
[ 5.0% - 5.5% ] 5.40% | 95,759 | 4.9% |
[ 5.5% - 6.0% ] 5.63% | 70,445 | 1.6% |
[ 5.5% - 6.0% ] 5.74% | 41,193 | 6.1% |
[ 5.5% - 6.0% ] 5.89% | 258,669 | 6.5% |
[ 6.0% - 6.5% ] 6.03% | 131,861 | 4.4% |
[ 6.0% - 6.5% ] 6.16% | 110,819 | 4.0% |
[ 6.0% - 6.5% ] 6.38% | 45,434 | 2.6% |
[ 6.0% - 6.5% ] 6.48% | 126,100 | 6.0% |
[ 6.5% - 7.0% ] 6.57% | 98,113 | 2.7% |
[ 6.5% - 7.0% ] 6.94% | 66,333 | 4.5% |
[ 7.0% - 7.5% ] 7.25% | 35,967 | 1.9% |
[ 7.0% - 7.5% ] 7.32% | 32,520 | 9.0% |
[ 7.5% - 8.0% ] 7.52% | 85,062 | 2.3% |
[ 7.5% - 8.0% ] 7.71% | 135,665 | 2.4% |
[ 7.5% - 8.0% ] 7.84% | 34,809 | 2.5% |
[ 8.0% - 8.5% ] 8.00% | 44,673 | 2.5% |
[ 8.0% - 8.5% ] 8.13% | 68,157 | 9.2% |
[ 8.0% - 8.5% ] 8.28% | 27,837 | 12.1% |
[ 8.0% - 8.5% ] 8.34% | 121,169 | 2.7% |
[ 8.5% - 9.0% ] 8.62% | 32,881 | 1.7% |
[ 8.5% - 9.0% ] 8.82% | 150,087 | 2.8% |
[ 9.0% - 9.5% ] 9.02% | 110,087 | 4.1% |
[ 9.0% - 9.5% ] 9.26% | 57,557 | 4.5% |
[ 9.0% - 9.5% ] 9.42% | 45,818 | 7.3% |
[ 9.5% - 10.0% ] 9.60% | 39,141 | 5.7% |
[ 9.5% - 10.0% ] 9.74% | 115,726 | 2.5% |
[ 10.0% - 10.5% ] 10.04% | 109,774 | 2.5% |
[ 10.0% - 10.5% ] 10.21% | 58,702 | 8.4% |
[ 10.0% - 10.5% ] 10.34% | 6,202 | 2.7% |
[ 10.5% - 11.0% ] 10.54% | 16,651 | 5.1% |
[ 10.5% - 11.0% ] 10.63% | 15,622 | 3.5% |
[ 10.5% - 11.0% ] 10.84% | 45,357 | 0.92% |
[ 11.0% - 11.5% ] 11.11% | 18,426 | 4.6% |
[ 12.0% - 12.5% ] 12.05% | 31,514 | 4.9% |
[ 12.5% - 13.0% ] 12.78% | 7,217 | 12.4% |
[ 13.5% - 14.0% ] 13.98% | 11,069 | 3.4% |
[ 16.5% - 17.0% ] 16.54% | 133 | 3.8% |
[ 17.5% - 18.0% ] 17.88% | 6,186 | 6.0% |
[ 24.0% - 24.5% ] 24.19% | 186 | 20.0% |
[ 26.0% - 26.5% ] 26.29% | 1,761 | 1.8% |
[ 29.5% - 30.0% ] 29.74% | 2,811 | 3.5% |