Immigrants from Colombia Wage/Income Gap
COMPARE
Immigrants from Colombia
Select to Compare
Wage/Income Gap
Immigrants from Colombia Wage/Income Gap
24.3%
WAGE/INCOME GAP
97.0/ 100
METRIC RATING
112th/ 347
METRIC RANK
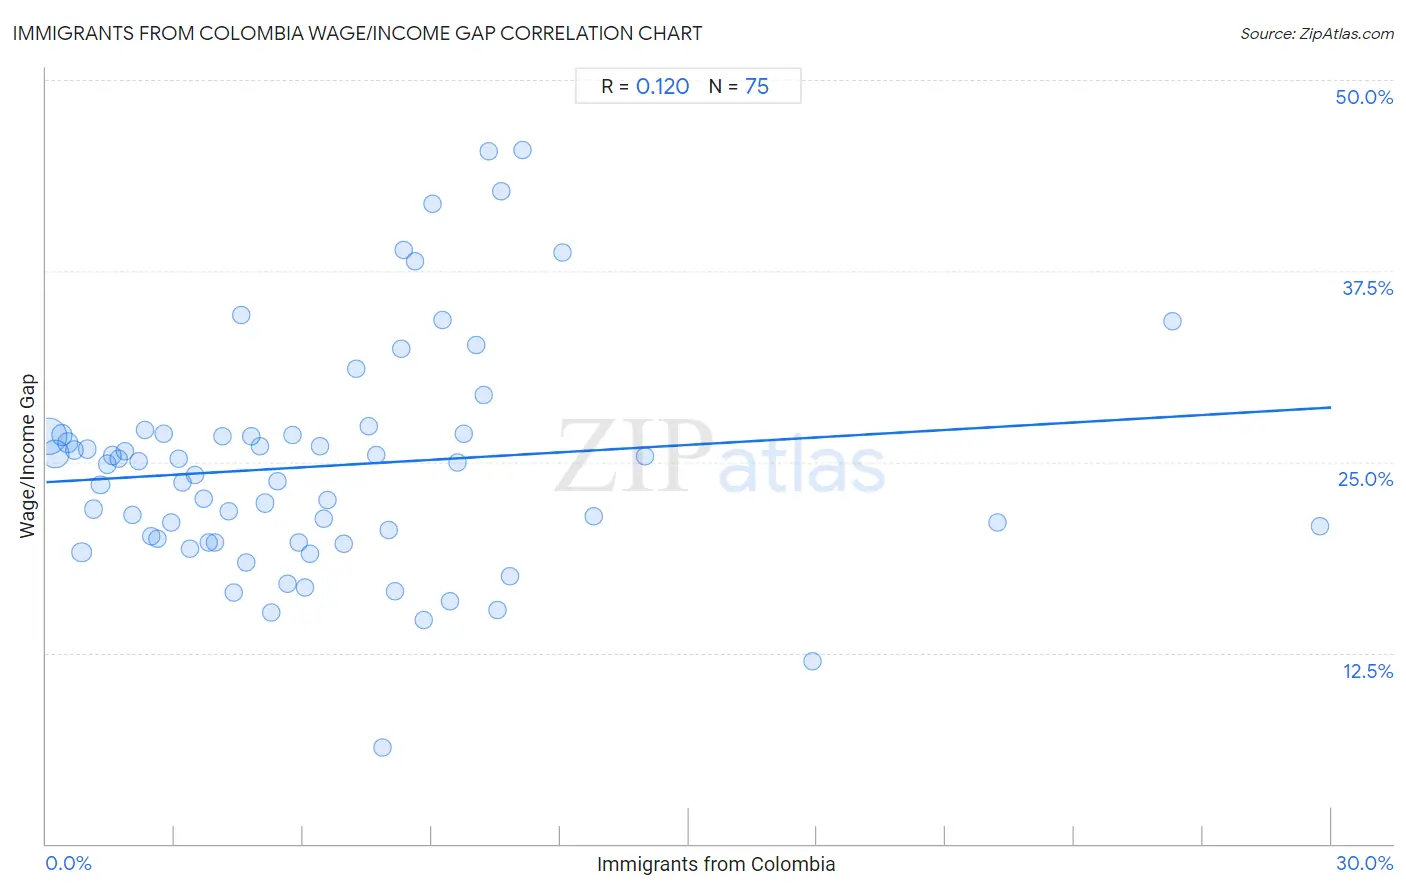
Immigrants from Colombia Wage/Income Gap Correlation Chart
The statistical analysis conducted on geographies consisting of 378,481,077 people shows a poor positive correlation between the proportion of Immigrants from Colombia and wage/income gap percentage in the United States with a correlation coefficient (R) of 0.120 and weighted average of 24.3%. On average, for every 1% (one percent) increase in Immigrants from Colombia within a typical geography, there is an increase of 0.16% in wage/income gap percentage.
It is essential to understand that the correlation between the percentage of Immigrants from Colombia and wage/income gap percentage does not imply a direct cause-and-effect relationship. It remains uncertain whether the presence of Immigrants from Colombia influences an upward or downward trend in the level of wage/income gap percentage within an area, or if Immigrants from Colombia simply ended up residing in those areas with higher or lower levels of wage/income gap percentage due to other factors.
Demographics Similar to Immigrants from Colombia by Wage/Income Gap
In terms of wage/income gap, the demographic groups most similar to Immigrants from Colombia are Sioux (24.3%, a difference of 0.050%), Panamanian (24.4%, a difference of 0.25%), Immigrants from Kenya (24.4%, a difference of 0.31%), Soviet Union (24.2%, a difference of 0.40%), and Alaska Native (24.4%, a difference of 0.48%).
| Demographics | Rating | Rank | Wage/Income Gap |
| Moroccans | 98.6 /100 | #105 | Exceptional 24.0% |
| Sudanese | 98.6 /100 | #106 | Exceptional 24.0% |
| Yaqui | 98.4 /100 | #107 | Exceptional 24.0% |
| Immigrants from Albania | 98.4 /100 | #108 | Exceptional 24.0% |
| Ugandans | 98.3 /100 | #109 | Exceptional 24.1% |
| Immigrants from Morocco | 98.1 /100 | #110 | Exceptional 24.1% |
| Soviet Union | 97.6 /100 | #111 | Exceptional 24.2% |
| Immigrants from Colombia | 97.0 /100 | #112 | Exceptional 24.3% |
| Sioux | 96.9 /100 | #113 | Exceptional 24.3% |
| Panamanians | 96.5 /100 | #114 | Exceptional 24.4% |
| Immigrants from Kenya | 96.4 /100 | #115 | Exceptional 24.4% |
| Alaska Natives | 96.0 /100 | #116 | Exceptional 24.4% |
| Immigrants from Afghanistan | 95.9 /100 | #117 | Exceptional 24.4% |
| Immigrants from Micronesia | 95.8 /100 | #118 | Exceptional 24.4% |
| Kenyans | 95.8 /100 | #119 | Exceptional 24.5% |
Immigrants from Colombia Wage/Income Gap Correlation Summary
| Measurement | Immigrants from Colombia Data | Wage/Income Gap Data |
| Minimum | 0.069% | 6.3% |
| Maximum | 29.7% | 45.5% |
| Range | 29.7% | 39.1% |
| Mean | 6.6% | 24.7% |
| Median | 5.6% | 24.8% |
| Interquartile 25% (IQ1) | 2.8% | 19.7% |
| Interquartile 75% (IQ3) | 9.0% | 26.7% |
| Interquartile Range (IQR) | 6.3% | 7.0% |
| Standard Deviation (Sample) | 5.5% | 7.5% |
| Standard Deviation (Population) | 5.5% | 7.4% |
Correlation Details
| Immigrants from Colombia Percentile | Sample Size | Wage/Income Gap |
[ 0.0% - 0.5% ] 0.069% | 175,588,380 | 26.7% |
[ 0.0% - 0.5% ] 0.21% | 89,549,531 | 25.5% |
[ 0.0% - 0.5% ] 0.37% | 33,655,724 | 26.7% |
[ 0.5% - 1.0% ] 0.51% | 18,791,204 | 26.2% |
[ 0.5% - 1.0% ] 0.66% | 10,452,902 | 25.8% |
[ 0.5% - 1.0% ] 0.83% | 15,647,700 | 19.1% |
[ 0.5% - 1.0% ] 0.96% | 4,855,202 | 25.8% |
[ 1.0% - 1.5% ] 1.11% | 4,345,108 | 21.9% |
[ 1.0% - 1.5% ] 1.26% | 2,957,635 | 23.5% |
[ 1.0% - 1.5% ] 1.42% | 2,393,584 | 24.8% |
[ 1.5% - 2.0% ] 1.55% | 2,125,721 | 25.4% |
[ 1.5% - 2.0% ] 1.70% | 1,621,641 | 25.2% |
[ 1.5% - 2.0% ] 1.84% | 1,376,204 | 25.7% |
[ 2.0% - 2.5% ] 2.01% | 994,493 | 21.5% |
[ 2.0% - 2.5% ] 2.16% | 1,413,477 | 25.0% |
[ 2.0% - 2.5% ] 2.30% | 596,660 | 27.1% |
[ 2.0% - 2.5% ] 2.44% | 694,284 | 20.1% |
[ 2.5% - 3.0% ] 2.60% | 668,934 | 19.9% |
[ 2.5% - 3.0% ] 2.75% | 700,301 | 26.9% |
[ 2.5% - 3.0% ] 2.91% | 768,372 | 21.0% |
[ 3.0% - 3.5% ] 3.08% | 1,042,357 | 25.2% |
[ 3.0% - 3.5% ] 3.17% | 528,043 | 23.7% |
[ 3.0% - 3.5% ] 3.34% | 447,091 | 19.4% |
[ 3.0% - 3.5% ] 3.47% | 804,095 | 24.1% |
[ 3.5% - 4.0% ] 3.67% | 485,449 | 22.6% |
[ 3.5% - 4.0% ] 3.80% | 522,074 | 19.7% |
[ 3.5% - 4.0% ] 3.95% | 621,554 | 19.7% |
[ 4.0% - 4.5% ] 4.12% | 390,801 | 26.7% |
[ 4.0% - 4.5% ] 4.25% | 324,806 | 21.8% |
[ 4.0% - 4.5% ] 4.39% | 116,517 | 16.4% |
[ 4.5% - 5.0% ] 4.56% | 180,514 | 34.6% |
[ 4.5% - 5.0% ] 4.66% | 272,359 | 18.4% |
[ 4.5% - 5.0% ] 4.78% | 92,461 | 26.7% |
[ 4.5% - 5.0% ] 4.98% | 168,461 | 26.0% |
[ 5.0% - 5.5% ] 5.11% | 430,423 | 22.3% |
[ 5.0% - 5.5% ] 5.25% | 337,142 | 15.2% |
[ 5.0% - 5.5% ] 5.40% | 95,850 | 23.7% |
[ 5.5% - 6.0% ] 5.63% | 70,197 | 17.0% |
[ 5.5% - 6.0% ] 5.74% | 41,193 | 26.7% |
[ 5.5% - 6.0% ] 5.89% | 258,669 | 19.7% |
[ 6.0% - 6.5% ] 6.03% | 131,861 | 16.8% |
[ 6.0% - 6.5% ] 6.16% | 110,819 | 19.0% |
[ 6.0% - 6.5% ] 6.38% | 44,718 | 26.1% |
[ 6.0% - 6.5% ] 6.48% | 126,100 | 21.3% |
[ 6.5% - 7.0% ] 6.57% | 98,113 | 22.5% |
[ 6.5% - 7.0% ] 6.94% | 66,333 | 19.7% |
[ 7.0% - 7.5% ] 7.25% | 35,967 | 31.1% |
[ 7.5% - 8.0% ] 7.52% | 85,062 | 27.3% |
[ 7.5% - 8.0% ] 7.71% | 135,665 | 25.5% |
[ 7.5% - 8.0% ] 7.84% | 34,809 | 6.3% |
[ 7.5% - 8.0% ] 7.98% | 67,213 | 20.5% |
[ 8.0% - 8.5% ] 8.13% | 68,157 | 16.6% |
[ 8.0% - 8.5% ] 8.28% | 28,693 | 32.4% |
[ 8.0% - 8.5% ] 8.34% | 121,169 | 38.9% |
[ 8.5% - 9.0% ] 8.61% | 50,017 | 38.1% |
[ 8.5% - 9.0% ] 8.82% | 150,087 | 14.6% |
[ 9.0% - 9.5% ] 9.02% | 110,087 | 41.9% |
[ 9.0% - 9.5% ] 9.26% | 57,138 | 34.3% |
[ 9.0% - 9.5% ] 9.42% | 45,818 | 15.9% |
[ 9.5% - 10.0% ] 9.60% | 39,141 | 25.0% |
[ 9.5% - 10.0% ] 9.74% | 115,726 | 26.8% |
[ 10.0% - 10.5% ] 10.04% | 109,774 | 32.6% |
[ 10.0% - 10.5% ] 10.21% | 58,702 | 29.4% |
[ 10.0% - 10.5% ] 10.34% | 6,202 | 45.3% |
[ 10.5% - 11.0% ] 10.54% | 16,450 | 15.3% |
[ 10.5% - 11.0% ] 10.63% | 15,622 | 42.7% |
[ 10.5% - 11.0% ] 10.84% | 45,357 | 17.5% |
[ 11.0% - 11.5% ] 11.11% | 18,426 | 45.5% |
[ 12.0% - 12.5% ] 12.05% | 31,514 | 38.7% |
[ 12.5% - 13.0% ] 12.78% | 7,217 | 21.4% |
[ 13.5% - 14.0% ] 13.98% | 11,069 | 25.3% |
[ 17.5% - 18.0% ] 17.88% | 6,186 | 11.9% |
[ 22.0% - 22.5% ] 22.22% | 180 | 21.0% |
[ 26.0% - 26.5% ] 26.29% | 1,761 | 34.2% |
[ 29.5% - 30.0% ] 29.74% | 2,811 | 20.8% |