Immigrants from Colombia Disability Age 5 to 17
COMPARE
Immigrants from Colombia
Select to Compare
Disability Age 5 to 17
Immigrants from Colombia Disability Age 5 to 17
5.4%
DISABILITY | AGE 5 TO 17
92.9/ 100
METRIC RATING
132nd/ 347
METRIC RANK
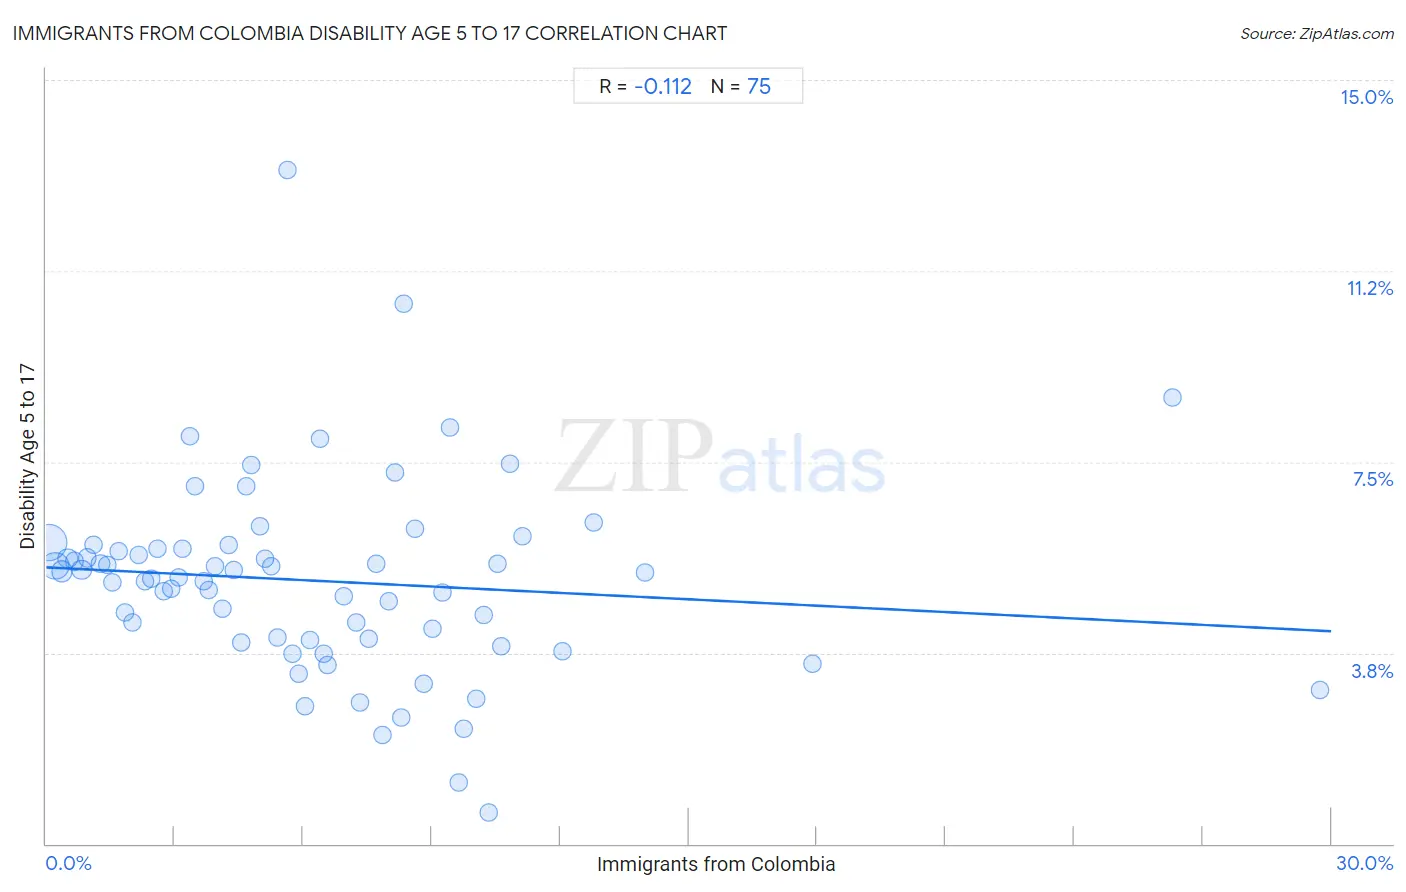
Immigrants from Colombia Disability Age 5 to 17 Correlation Chart
The statistical analysis conducted on geographies consisting of 376,032,819 people shows a poor negative correlation between the proportion of Immigrants from Colombia and percentage of population with a disability between the ages 5 and 17 in the United States with a correlation coefficient (R) of -0.112 and weighted average of 5.4%. On average, for every 1% (one percent) increase in Immigrants from Colombia within a typical geography, there is a decrease of 0.042% in percentage of population with a disability between the ages 5 and 17.
It is essential to understand that the correlation between the percentage of Immigrants from Colombia and percentage of population with a disability between the ages 5 and 17 does not imply a direct cause-and-effect relationship. It remains uncertain whether the presence of Immigrants from Colombia influences an upward or downward trend in the level of percentage of population with a disability between the ages 5 and 17 within an area, or if Immigrants from Colombia simply ended up residing in those areas with higher or lower levels of percentage of population with a disability between the ages 5 and 17 due to other factors.
Demographics Similar to Immigrants from Colombia by Disability Age 5 to 17
In terms of disability age 5 to 17, the demographic groups most similar to Immigrants from Colombia are Arab (5.4%, a difference of 0.020%), Venezuelan (5.4%, a difference of 0.030%), Yuman (5.4%, a difference of 0.11%), Immigrants from Belize (5.4%, a difference of 0.21%), and Immigrants from Bulgaria (5.4%, a difference of 0.25%).
| Demographics | Rating | Rank | Disability Age 5 to 17 |
| Immigrants from Chile | 95.0 /100 | #125 | Exceptional 5.4% |
| New Zealanders | 95.0 /100 | #126 | Exceptional 5.4% |
| Latvians | 95.0 /100 | #127 | Exceptional 5.4% |
| Immigrants from Venezuela | 94.5 /100 | #128 | Exceptional 5.4% |
| Romanians | 94.1 /100 | #129 | Exceptional 5.4% |
| Immigrants from Bulgaria | 94.0 /100 | #130 | Exceptional 5.4% |
| Arabs | 92.9 /100 | #131 | Exceptional 5.4% |
| Immigrants from Colombia | 92.9 /100 | #132 | Exceptional 5.4% |
| Venezuelans | 92.7 /100 | #133 | Exceptional 5.4% |
| Yuman | 92.3 /100 | #134 | Exceptional 5.4% |
| Immigrants from Belize | 91.7 /100 | #135 | Exceptional 5.4% |
| Immigrants from Denmark | 91.4 /100 | #136 | Exceptional 5.4% |
| Navajo | 90.9 /100 | #137 | Exceptional 5.4% |
| Immigrants from Oceania | 90.8 /100 | #138 | Exceptional 5.4% |
| Belizeans | 90.8 /100 | #139 | Exceptional 5.4% |
Immigrants from Colombia Disability Age 5 to 17 Correlation Summary
| Measurement | Immigrants from Colombia Data | Disability Age 5 to 17 Data |
| Minimum | 0.069% | 0.60% |
| Maximum | 29.7% | 13.2% |
| Range | 29.7% | 12.6% |
| Mean | 6.4% | 5.2% |
| Median | 5.6% | 5.2% |
| Interquartile 25% (IQ1) | 2.8% | 4.0% |
| Interquartile 75% (IQ3) | 8.8% | 5.8% |
| Interquartile Range (IQR) | 6.1% | 1.8% |
| Standard Deviation (Sample) | 5.2% | 1.9% |
| Standard Deviation (Population) | 5.1% | 1.9% |
Correlation Details
| Immigrants from Colombia Percentile | Sample Size | Disability Age 5 to 17 |
[ 0.0% - 0.5% ] 0.069% | 175,141,365 | 5.9% |
[ 0.0% - 0.5% ] 0.21% | 88,952,193 | 5.5% |
[ 0.0% - 0.5% ] 0.37% | 33,324,220 | 5.3% |
[ 0.5% - 1.0% ] 0.51% | 18,517,283 | 5.6% |
[ 0.5% - 1.0% ] 0.66% | 10,259,069 | 5.5% |
[ 0.5% - 1.0% ] 0.83% | 15,558,251 | 5.4% |
[ 0.5% - 1.0% ] 0.96% | 4,718,656 | 5.6% |
[ 1.0% - 1.5% ] 1.11% | 4,305,141 | 5.9% |
[ 1.0% - 1.5% ] 1.26% | 2,908,391 | 5.5% |
[ 1.0% - 1.5% ] 1.42% | 2,353,489 | 5.5% |
[ 1.5% - 2.0% ] 1.56% | 2,074,918 | 5.1% |
[ 1.5% - 2.0% ] 1.70% | 1,592,268 | 5.8% |
[ 1.5% - 2.0% ] 1.84% | 1,350,789 | 4.5% |
[ 2.0% - 2.5% ] 2.01% | 966,828 | 4.3% |
[ 2.0% - 2.5% ] 2.16% | 1,406,399 | 5.7% |
[ 2.0% - 2.5% ] 2.30% | 586,003 | 5.1% |
[ 2.0% - 2.5% ] 2.45% | 678,361 | 5.2% |
[ 2.5% - 3.0% ] 2.60% | 668,381 | 5.8% |
[ 2.5% - 3.0% ] 2.75% | 690,620 | 5.0% |
[ 2.5% - 3.0% ] 2.91% | 763,977 | 5.0% |
[ 3.0% - 3.5% ] 3.08% | 1,042,357 | 5.2% |
[ 3.0% - 3.5% ] 3.17% | 509,623 | 5.8% |
[ 3.0% - 3.5% ] 3.34% | 449,447 | 8.0% |
[ 3.0% - 3.5% ] 3.47% | 804,095 | 7.0% |
[ 3.5% - 4.0% ] 3.67% | 486,213 | 5.2% |
[ 3.5% - 4.0% ] 3.80% | 513,167 | 5.0% |
[ 3.5% - 4.0% ] 3.95% | 616,923 | 5.5% |
[ 4.0% - 4.5% ] 4.12% | 389,882 | 4.6% |
[ 4.0% - 4.5% ] 4.25% | 317,560 | 5.9% |
[ 4.0% - 4.5% ] 4.39% | 116,779 | 5.4% |
[ 4.5% - 5.0% ] 4.56% | 178,344 | 4.0% |
[ 4.5% - 5.0% ] 4.66% | 272,221 | 7.0% |
[ 4.5% - 5.0% ] 4.78% | 84,642 | 7.4% |
[ 4.5% - 5.0% ] 4.98% | 160,441 | 6.2% |
[ 5.0% - 5.5% ] 5.11% | 424,580 | 5.6% |
[ 5.0% - 5.5% ] 5.25% | 335,007 | 5.5% |
[ 5.0% - 5.5% ] 5.40% | 92,939 | 4.0% |
[ 5.5% - 6.0% ] 5.63% | 70,197 | 13.2% |
[ 5.5% - 6.0% ] 5.76% | 31,136 | 3.7% |
[ 5.5% - 6.0% ] 5.89% | 258,669 | 3.3% |
[ 6.0% - 6.5% ] 6.03% | 131,319 | 2.7% |
[ 6.0% - 6.5% ] 6.16% | 110,032 | 4.0% |
[ 6.0% - 6.5% ] 6.38% | 44,718 | 8.0% |
[ 6.0% - 6.5% ] 6.48% | 126,100 | 3.7% |
[ 6.5% - 7.0% ] 6.57% | 97,672 | 3.5% |
[ 6.5% - 7.0% ] 6.94% | 66,333 | 4.9% |
[ 7.0% - 7.5% ] 7.25% | 35,967 | 4.4% |
[ 7.0% - 7.5% ] 7.32% | 32,520 | 2.8% |
[ 7.5% - 8.0% ] 7.52% | 85,062 | 4.0% |
[ 7.5% - 8.0% ] 7.71% | 135,665 | 5.5% |
[ 7.5% - 8.0% ] 7.84% | 34,809 | 2.1% |
[ 7.5% - 8.0% ] 7.98% | 67,213 | 4.8% |
[ 8.0% - 8.5% ] 8.13% | 68,157 | 7.3% |
[ 8.0% - 8.5% ] 8.28% | 28,693 | 2.5% |
[ 8.0% - 8.5% ] 8.34% | 121,169 | 10.6% |
[ 8.5% - 9.0% ] 8.61% | 50,017 | 6.2% |
[ 8.5% - 9.0% ] 8.82% | 150,087 | 3.1% |
[ 9.0% - 9.5% ] 9.02% | 110,087 | 4.2% |
[ 9.0% - 9.5% ] 9.26% | 57,138 | 4.9% |
[ 9.0% - 9.5% ] 9.42% | 45,481 | 8.2% |
[ 9.5% - 10.0% ] 9.62% | 16,939 | 1.2% |
[ 9.5% - 10.0% ] 9.74% | 115,726 | 2.3% |
[ 10.0% - 10.5% ] 10.04% | 109,774 | 2.9% |
[ 10.0% - 10.5% ] 10.21% | 58,702 | 4.5% |
[ 10.0% - 10.5% ] 10.34% | 6,202 | 0.60% |
[ 10.5% - 11.0% ] 10.54% | 16,450 | 5.5% |
[ 10.5% - 11.0% ] 10.63% | 15,622 | 3.9% |
[ 10.5% - 11.0% ] 10.84% | 45,357 | 7.5% |
[ 11.0% - 11.5% ] 11.11% | 18,426 | 6.0% |
[ 12.0% - 12.5% ] 12.05% | 31,514 | 3.8% |
[ 12.5% - 13.0% ] 12.78% | 7,217 | 6.3% |
[ 13.5% - 14.0% ] 13.98% | 11,069 | 5.3% |
[ 17.5% - 18.0% ] 17.88% | 6,186 | 3.5% |
[ 26.0% - 26.5% ] 26.29% | 1,761 | 8.8% |
[ 29.5% - 30.0% ] 29.74% | 2,811 | 3.0% |