Immigrants from Colombia 2 or more Vehicles in Household
COMPARE
Immigrants from Colombia
Select to Compare
2 or more Vehicles in Household
Immigrants from Colombia 2 or more Vehicles in Household
52.0%
2+ VEHICLES AVAILABLE
0.2/ 100
METRIC RATING
267th/ 347
METRIC RANK
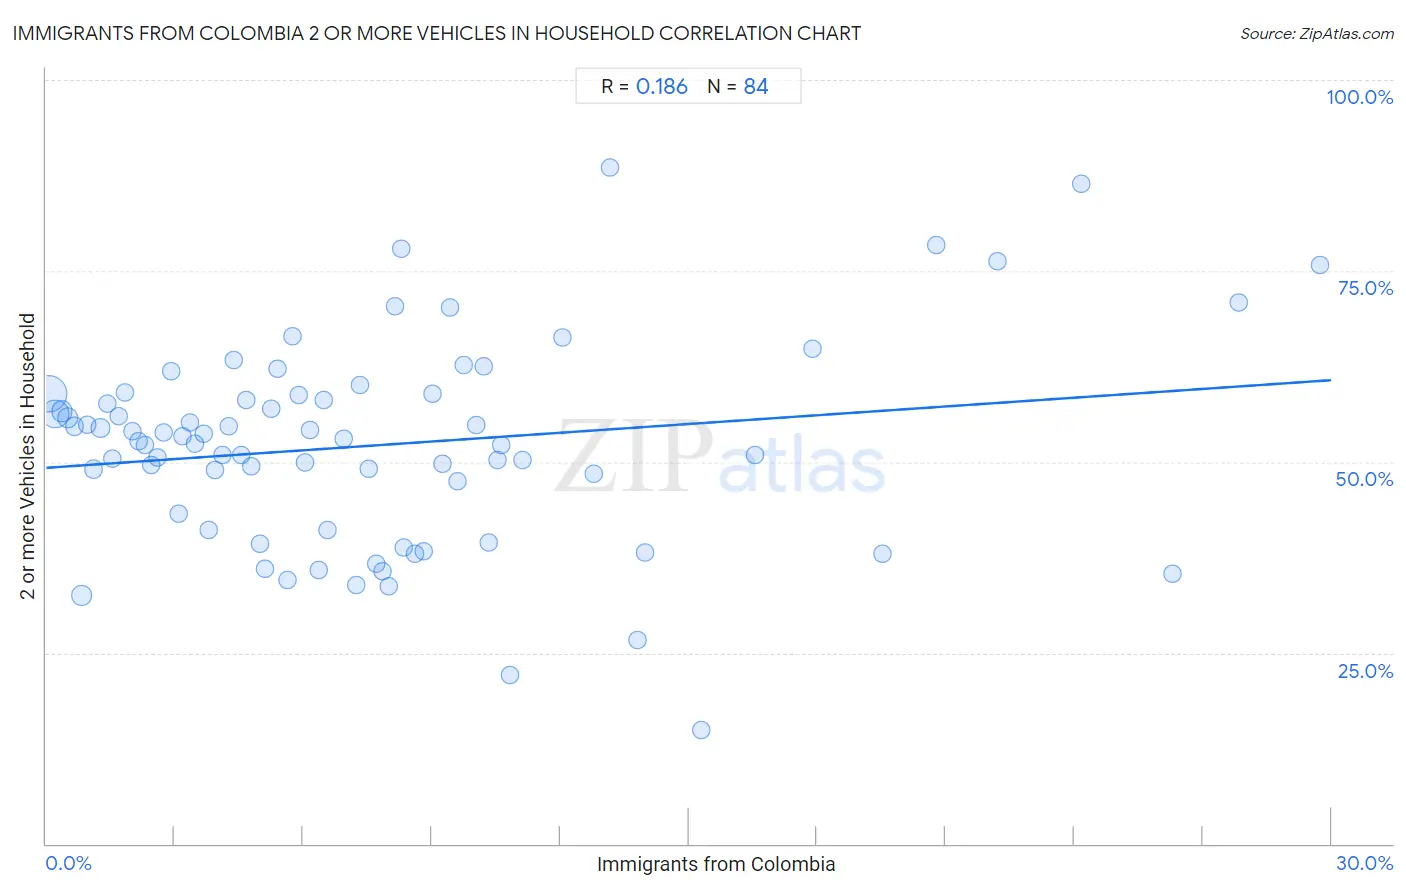
Immigrants from Colombia 2 or more Vehicles in Household Correlation Chart
The statistical analysis conducted on geographies consisting of 378,550,155 people shows a poor positive correlation between the proportion of Immigrants from Colombia and percentage of households with 2 or more vehicles available in the United States with a correlation coefficient (R) of 0.186 and weighted average of 52.0%. On average, for every 1% (one percent) increase in Immigrants from Colombia within a typical geography, there is an increase of 0.38% in percentage of households with 2 or more vehicles available.
It is essential to understand that the correlation between the percentage of Immigrants from Colombia and percentage of households with 2 or more vehicles available does not imply a direct cause-and-effect relationship. It remains uncertain whether the presence of Immigrants from Colombia influences an upward or downward trend in the level of percentage of households with 2 or more vehicles available within an area, or if Immigrants from Colombia simply ended up residing in those areas with higher or lower levels of percentage of households with 2 or more vehicles available due to other factors.
Demographics Similar to Immigrants from Colombia by 2 or more Vehicles in Household
In terms of 2 or more vehicles in household, the demographic groups most similar to Immigrants from Colombia are Pima (52.0%, a difference of 0.010%), Honduran (52.0%, a difference of 0.010%), Immigrants from Ireland (52.0%, a difference of 0.040%), Immigrants from France (52.0%, a difference of 0.050%), and Immigrants from Congo (52.1%, a difference of 0.19%).
| Demographics | Rating | Rank | 2 or more Vehicles in Household |
| Immigrants from Bahamas | 0.5 /100 | #260 | Tragic 52.5% |
| Immigrants from Australia | 0.5 /100 | #261 | Tragic 52.4% |
| Immigrants from Northern Africa | 0.4 /100 | #262 | Tragic 52.3% |
| Immigrants from Southern Europe | 0.4 /100 | #263 | Tragic 52.3% |
| Immigrants from Latvia | 0.4 /100 | #264 | Tragic 52.2% |
| Immigrants from Congo | 0.3 /100 | #265 | Tragic 52.1% |
| Immigrants from France | 0.2 /100 | #266 | Tragic 52.0% |
| Immigrants from Colombia | 0.2 /100 | #267 | Tragic 52.0% |
| Pima | 0.2 /100 | #268 | Tragic 52.0% |
| Hondurans | 0.2 /100 | #269 | Tragic 52.0% |
| Immigrants from Ireland | 0.2 /100 | #270 | Tragic 52.0% |
| South Americans | 0.2 /100 | #271 | Tragic 51.9% |
| Sub-Saharan Africans | 0.2 /100 | #272 | Tragic 51.9% |
| Israelis | 0.2 /100 | #273 | Tragic 51.9% |
| Africans | 0.2 /100 | #274 | Tragic 51.8% |
Immigrants from Colombia 2 or more Vehicles in Household Correlation Summary
| Measurement | Immigrants from Colombia Data | 2 or more Vehicles in Household Data |
| Minimum | 0.069% | 14.8% |
| Maximum | 29.7% | 88.6% |
| Range | 29.7% | 73.8% |
| Mean | 7.8% | 52.2% |
| Median | 6.3% | 52.9% |
| Interquartile 25% (IQ1) | 3.1% | 42.2% |
| Interquartile 75% (IQ3) | 10.1% | 58.8% |
| Interquartile Range (IQR) | 7.0% | 16.7% |
| Standard Deviation (Sample) | 6.5% | 13.4% |
| Standard Deviation (Population) | 6.5% | 13.3% |
Correlation Details
| Immigrants from Colombia Percentile | Sample Size | 2 or more Vehicles in Household |
[ 0.0% - 0.5% ] 0.069% | 175,559,563 | 59.0% |
[ 0.0% - 0.5% ] 0.21% | 89,517,584 | 56.3% |
[ 0.0% - 0.5% ] 0.37% | 33,660,837 | 56.6% |
[ 0.5% - 1.0% ] 0.51% | 18,795,085 | 55.8% |
[ 0.5% - 1.0% ] 0.66% | 10,462,348 | 54.7% |
[ 0.5% - 1.0% ] 0.83% | 15,666,676 | 32.5% |
[ 0.5% - 1.0% ] 0.96% | 4,858,397 | 54.9% |
[ 1.0% - 1.5% ] 1.11% | 4,348,280 | 49.0% |
[ 1.0% - 1.5% ] 1.26% | 2,965,806 | 54.4% |
[ 1.0% - 1.5% ] 1.42% | 2,394,281 | 57.6% |
[ 1.5% - 2.0% ] 1.55% | 2,126,164 | 50.4% |
[ 1.5% - 2.0% ] 1.70% | 1,625,355 | 56.0% |
[ 1.5% - 2.0% ] 1.84% | 1,384,156 | 59.1% |
[ 2.0% - 2.5% ] 2.01% | 995,818 | 54.0% |
[ 2.0% - 2.5% ] 2.16% | 1,415,650 | 52.7% |
[ 2.0% - 2.5% ] 2.30% | 597,394 | 52.2% |
[ 2.0% - 2.5% ] 2.44% | 701,817 | 49.6% |
[ 2.5% - 3.0% ] 2.60% | 669,818 | 50.6% |
[ 2.5% - 3.0% ] 2.75% | 700,589 | 53.9% |
[ 2.5% - 3.0% ] 2.91% | 769,485 | 61.8% |
[ 3.0% - 3.5% ] 3.08% | 1,043,598 | 43.1% |
[ 3.0% - 3.5% ] 3.17% | 528,669 | 53.3% |
[ 3.0% - 3.5% ] 3.34% | 449,447 | 55.2% |
[ 3.0% - 3.5% ] 3.47% | 804,095 | 52.3% |
[ 3.5% - 4.0% ] 3.67% | 487,801 | 53.6% |
[ 3.5% - 4.0% ] 3.80% | 522,074 | 41.2% |
[ 3.5% - 4.0% ] 3.95% | 621,554 | 48.9% |
[ 4.0% - 4.5% ] 4.12% | 391,299 | 51.0% |
[ 4.0% - 4.5% ] 4.25% | 324,853 | 54.6% |
[ 4.0% - 4.5% ] 4.39% | 118,938 | 63.3% |
[ 4.5% - 5.0% ] 4.56% | 180,514 | 50.9% |
[ 4.5% - 5.0% ] 4.66% | 275,327 | 58.1% |
[ 4.5% - 5.0% ] 4.78% | 92,461 | 49.4% |
[ 4.5% - 5.0% ] 4.98% | 168,461 | 39.3% |
[ 5.0% - 5.5% ] 5.11% | 430,423 | 36.0% |
[ 5.0% - 5.5% ] 5.25% | 337,142 | 56.9% |
[ 5.0% - 5.5% ] 5.40% | 95,850 | 62.2% |
[ 5.5% - 6.0% ] 5.63% | 70,445 | 34.6% |
[ 5.5% - 6.0% ] 5.74% | 41,193 | 66.5% |
[ 5.5% - 6.0% ] 5.89% | 258,669 | 58.7% |
[ 6.0% - 6.5% ] 6.03% | 131,861 | 50.0% |
[ 6.0% - 6.5% ] 6.16% | 110,819 | 54.1% |
[ 6.0% - 6.5% ] 6.38% | 45,434 | 35.9% |
[ 6.0% - 6.5% ] 6.48% | 126,255 | 58.1% |
[ 6.5% - 7.0% ] 6.57% | 98,113 | 41.1% |
[ 6.5% - 7.0% ] 6.94% | 66,333 | 53.0% |
[ 7.0% - 7.5% ] 7.25% | 35,967 | 33.8% |
[ 7.0% - 7.5% ] 7.32% | 33,204 | 60.0% |
[ 7.5% - 8.0% ] 7.52% | 85,062 | 49.1% |
[ 7.5% - 8.0% ] 7.71% | 135,665 | 36.6% |
[ 7.5% - 8.0% ] 7.84% | 34,809 | 35.7% |
[ 7.5% - 8.0% ] 7.98% | 67,213 | 33.7% |
[ 8.0% - 8.5% ] 8.13% | 70,030 | 70.5% |
[ 8.0% - 8.5% ] 8.28% | 28,693 | 77.9% |
[ 8.0% - 8.5% ] 8.34% | 121,169 | 38.8% |
[ 8.5% - 9.0% ] 8.61% | 50,017 | 38.0% |
[ 8.5% - 9.0% ] 8.82% | 150,087 | 38.2% |
[ 9.0% - 9.5% ] 9.02% | 110,087 | 59.0% |
[ 9.0% - 9.5% ] 9.26% | 57,557 | 49.7% |
[ 9.0% - 9.5% ] 9.42% | 45,818 | 70.2% |
[ 9.5% - 10.0% ] 9.60% | 39,141 | 47.5% |
[ 9.5% - 10.0% ] 9.74% | 115,726 | 62.7% |
[ 10.0% - 10.5% ] 10.04% | 110,071 | 54.8% |
[ 10.0% - 10.5% ] 10.21% | 58,702 | 62.6% |
[ 10.0% - 10.5% ] 10.34% | 6,202 | 39.4% |
[ 10.5% - 11.0% ] 10.54% | 16,651 | 50.3% |
[ 10.5% - 11.0% ] 10.63% | 15,622 | 52.2% |
[ 10.5% - 11.0% ] 10.84% | 45,357 | 22.1% |
[ 11.0% - 11.5% ] 11.11% | 18,426 | 50.3% |
[ 12.0% - 12.5% ] 12.05% | 31,514 | 66.3% |
[ 12.5% - 13.0% ] 12.78% | 7,217 | 48.4% |
[ 13.0% - 13.5% ] 13.16% | 342 | 88.6% |
[ 13.5% - 14.0% ] 13.79% | 58 | 26.7% |
[ 13.5% - 14.0% ] 13.98% | 11,069 | 38.2% |
[ 15.0% - 15.5% ] 15.29% | 255 | 14.8% |
[ 16.5% - 17.0% ] 16.54% | 133 | 50.9% |
[ 17.5% - 18.0% ] 17.88% | 6,186 | 64.7% |
[ 19.5% - 20.0% ] 19.51% | 41 | 37.9% |
[ 20.5% - 21.0% ] 20.78% | 154 | 78.3% |
[ 22.0% - 22.5% ] 22.22% | 180 | 76.2% |
[ 24.0% - 24.5% ] 24.16% | 269 | 86.4% |
[ 26.0% - 26.5% ] 26.29% | 1,761 | 35.4% |
[ 27.5% - 28.0% ] 27.85% | 158 | 70.8% |
[ 29.5% - 30.0% ] 29.74% | 2,811 | 75.8% |