Immigrants from Austria vs Welsh Married-Couple Family Poverty
COMPARE
Immigrants from Austria
Welsh
Married-Couple Family Poverty
Married-Couple Family Poverty Comparison
Immigrants from Austria
Welsh
4.5%
MARRIED-COUPLE FAMILY POVERTY
99.2/ 100
METRIC RATING
74th/ 347
METRIC RANK
4.3%
MARRIED-COUPLE FAMILY POVERTY
99.7/ 100
METRIC RATING
53rd/ 347
METRIC RANK
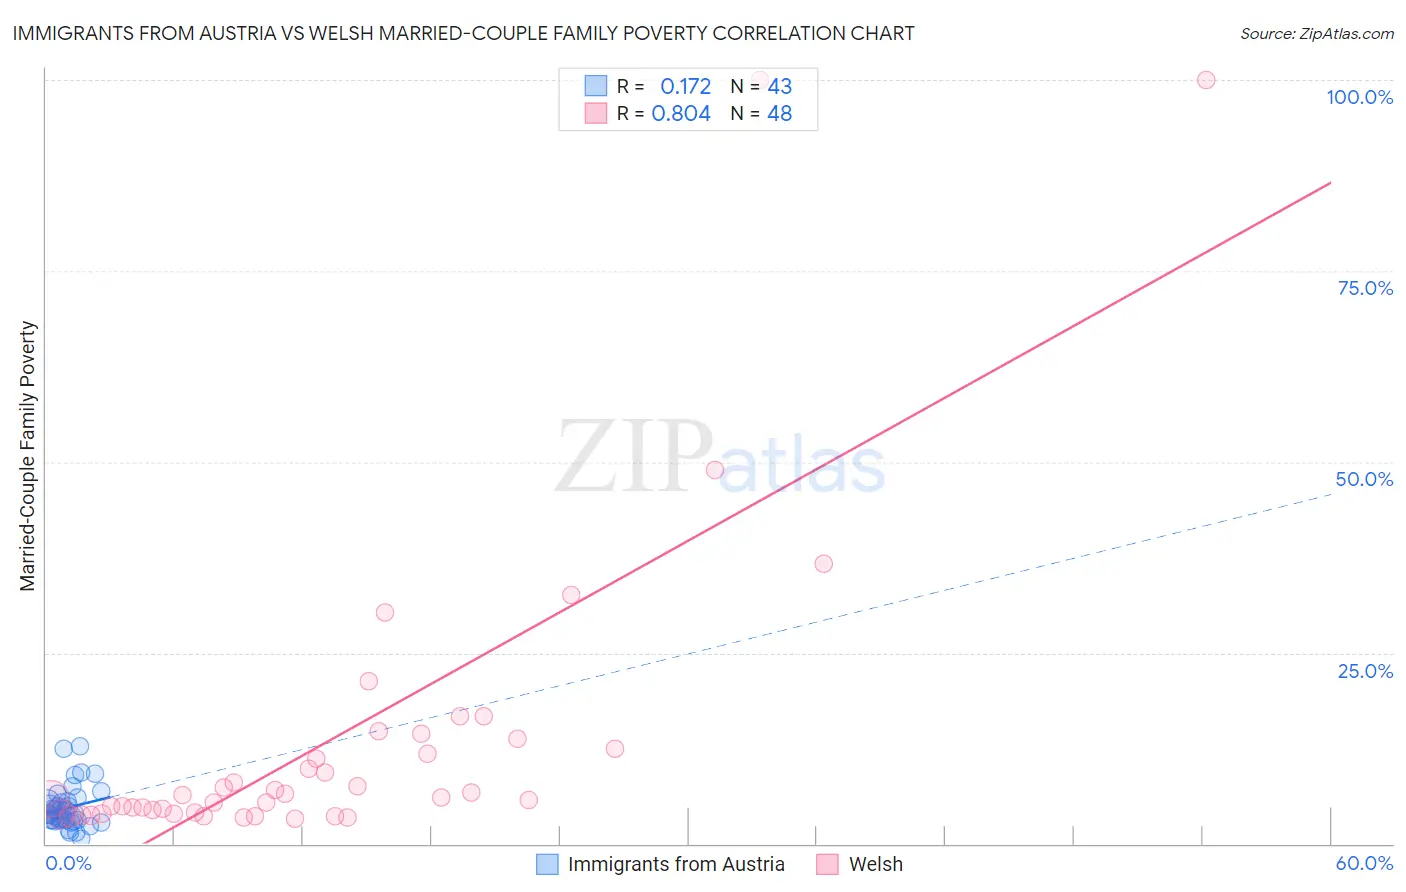
Immigrants from Austria vs Welsh Married-Couple Family Poverty Correlation Chart
The statistical analysis conducted on geographies consisting of 167,372,686 people shows a poor positive correlation between the proportion of Immigrants from Austria and poverty level among married-couple families in the United States with a correlation coefficient (R) of 0.172 and weighted average of 4.5%. Similarly, the statistical analysis conducted on geographies consisting of 518,114,778 people shows a very strong positive correlation between the proportion of Welsh and poverty level among married-couple families in the United States with a correlation coefficient (R) of 0.804 and weighted average of 4.3%, a difference of 3.6%.
Married-Couple Family Poverty Correlation Summary
| Measurement | Immigrants from Austria | Welsh |
| Minimum | 0.61% | 3.3% |
| Maximum | 12.7% | 100.0% |
| Range | 12.1% | 96.7% |
| Mean | 4.7% | 13.6% |
| Median | 3.9% | 6.3% |
| Interquartile 25% (IQ1) | 3.0% | 4.1% |
| Interquartile 75% (IQ3) | 5.5% | 13.2% |
| Interquartile Range (IQR) | 2.4% | 9.1% |
| Standard Deviation (Sample) | 2.6% | 20.5% |
| Standard Deviation (Population) | 2.6% | 20.3% |
Similar Demographics by Married-Couple Family Poverty
Demographics Similar to Immigrants from Austria by Married-Couple Family Poverty
In terms of married-couple family poverty, the demographic groups most similar to Immigrants from Austria are Ukrainian (4.5%, a difference of 0.10%), Immigrants from England (4.5%, a difference of 0.22%), Cambodian (4.5%, a difference of 0.27%), Immigrants from North America (4.5%, a difference of 0.32%), and Immigrants from South Africa (4.5%, a difference of 0.38%).
| Demographics | Rating | Rank | Married-Couple Family Poverty |
| Immigrants | Canada | 99.4 /100 | #67 | Exceptional 4.4% |
| Slavs | 99.4 /100 | #68 | Exceptional 4.4% |
| New Zealanders | 99.4 /100 | #69 | Exceptional 4.4% |
| Immigrants | Korea | 99.4 /100 | #70 | Exceptional 4.5% |
| Immigrants | North America | 99.3 /100 | #71 | Exceptional 4.5% |
| Immigrants | England | 99.3 /100 | #72 | Exceptional 4.5% |
| Ukrainians | 99.2 /100 | #73 | Exceptional 4.5% |
| Immigrants | Austria | 99.2 /100 | #74 | Exceptional 4.5% |
| Cambodians | 99.2 /100 | #75 | Exceptional 4.5% |
| Immigrants | South Africa | 99.1 /100 | #76 | Exceptional 4.5% |
| Immigrants | Latvia | 99.1 /100 | #77 | Exceptional 4.5% |
| Scotch-Irish | 99.1 /100 | #78 | Exceptional 4.5% |
| Immigrants | Iran | 99.0 /100 | #79 | Exceptional 4.5% |
| Icelanders | 99.0 /100 | #80 | Exceptional 4.5% |
| Immigrants | Greece | 98.9 /100 | #81 | Exceptional 4.5% |
Demographics Similar to Welsh by Married-Couple Family Poverty
In terms of married-couple family poverty, the demographic groups most similar to Welsh are Russian (4.3%, a difference of 0.15%), Immigrants from Lithuania (4.3%, a difference of 0.18%), Burmese (4.3%, a difference of 0.19%), Austrian (4.3%, a difference of 0.26%), and Turkish (4.3%, a difference of 0.29%).
| Demographics | Rating | Rank | Married-Couple Family Poverty |
| British | 99.8 /100 | #46 | Exceptional 4.3% |
| Immigrants | South Central Asia | 99.8 /100 | #47 | Exceptional 4.3% |
| Australians | 99.7 /100 | #48 | Exceptional 4.3% |
| Turks | 99.7 /100 | #49 | Exceptional 4.3% |
| Burmese | 99.7 /100 | #50 | Exceptional 4.3% |
| Immigrants | Lithuania | 99.7 /100 | #51 | Exceptional 4.3% |
| Russians | 99.7 /100 | #52 | Exceptional 4.3% |
| Welsh | 99.7 /100 | #53 | Exceptional 4.3% |
| Austrians | 99.7 /100 | #54 | Exceptional 4.3% |
| French | 99.7 /100 | #55 | Exceptional 4.3% |
| Immigrants | Zimbabwe | 99.7 /100 | #56 | Exceptional 4.3% |
| Immigrants | Netherlands | 99.7 /100 | #57 | Exceptional 4.3% |
| Czechoslovakians | 99.7 /100 | #58 | Exceptional 4.4% |
| Immigrants | Sweden | 99.6 /100 | #59 | Exceptional 4.4% |
| Tlingit-Haida | 99.6 /100 | #60 | Exceptional 4.4% |