Immigrants from Austria 3 or more Vehicles in Household
COMPARE
Immigrants from Austria
Select to Compare
3 or more Vehicles in Household
Immigrants from Austria 3 or more Vehicles in Household
18.9%
3+ VEHICLES AVAILABLE
15.4/ 100
METRIC RATING
202nd/ 347
METRIC RANK
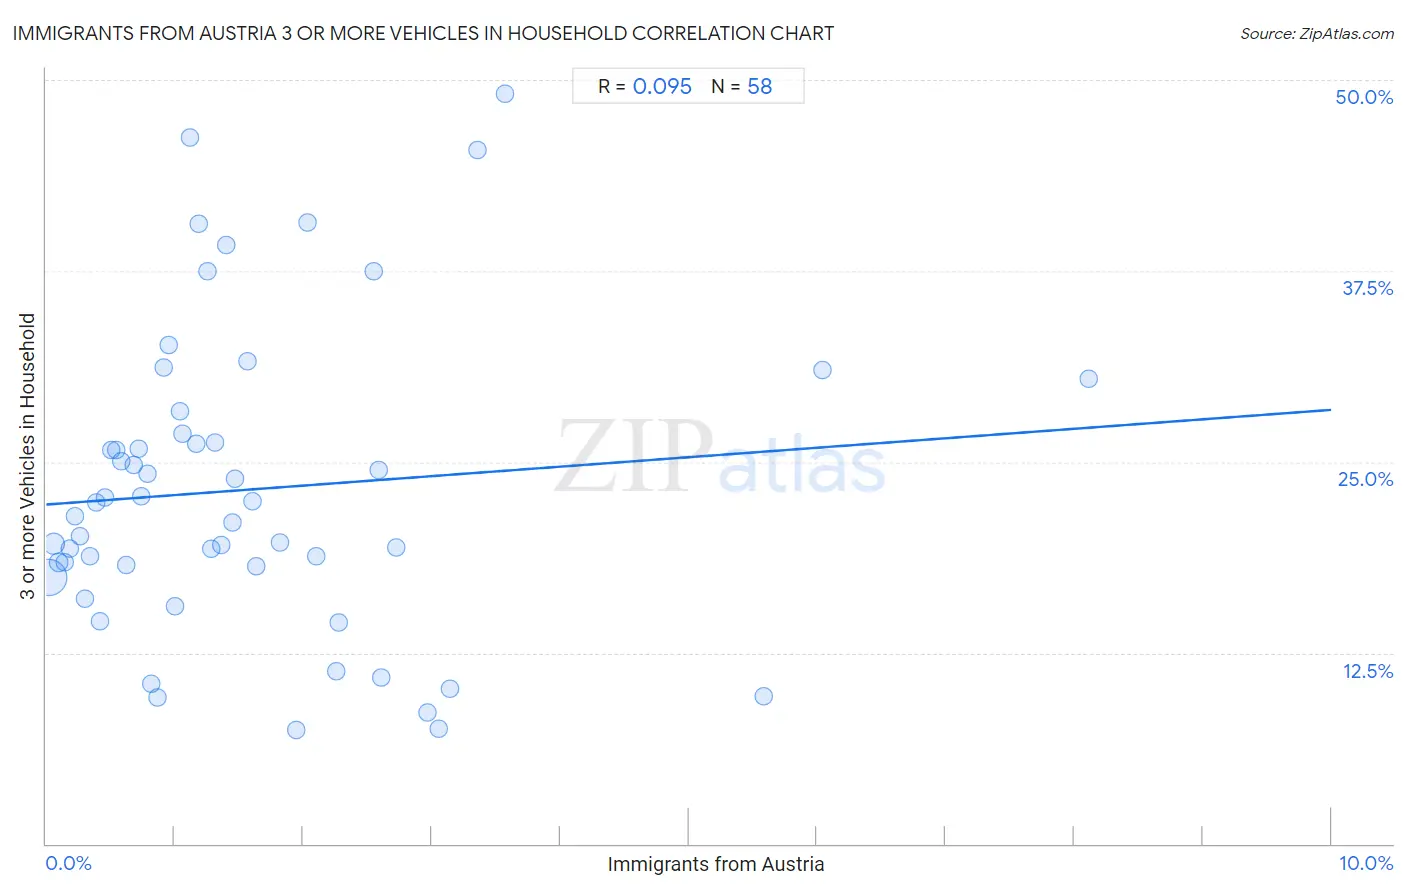
Immigrants from Austria 3 or more Vehicles in Household Correlation Chart
The statistical analysis conducted on geographies consisting of 167,924,568 people shows a slight positive correlation between the proportion of Immigrants from Austria and percentage of households with 3 or more vehicles available in the United States with a correlation coefficient (R) of 0.095 and weighted average of 18.9%. On average, for every 1% (one percent) increase in Immigrants from Austria within a typical geography, there is an increase of 0.62% in percentage of households with 3 or more vehicles available.
It is essential to understand that the correlation between the percentage of Immigrants from Austria and percentage of households with 3 or more vehicles available does not imply a direct cause-and-effect relationship. It remains uncertain whether the presence of Immigrants from Austria influences an upward or downward trend in the level of percentage of households with 3 or more vehicles available within an area, or if Immigrants from Austria simply ended up residing in those areas with higher or lower levels of percentage of households with 3 or more vehicles available due to other factors.
Demographics Similar to Immigrants from Austria by 3 or more Vehicles in Household
In terms of 3 or more vehicles in household, the demographic groups most similar to Immigrants from Austria are Tohono O'odham (18.9%, a difference of 0.090%), Immigrants from Romania (18.9%, a difference of 0.12%), Russian (18.8%, a difference of 0.19%), Immigrants from Eastern Asia (18.8%, a difference of 0.20%), and Immigrants from Chile (18.8%, a difference of 0.28%).
| Demographics | Rating | Rank | 3 or more Vehicles in Household |
| Immigrants from Moldova | 23.6 /100 | #195 | Fair 19.1% |
| Central American Indians | 22.2 /100 | #196 | Fair 19.0% |
| Immigrants from Japan | 22.0 /100 | #197 | Fair 19.0% |
| Egyptians | 19.5 /100 | #198 | Poor 19.0% |
| Immigrants from Norway | 19.0 /100 | #199 | Poor 19.0% |
| Argentineans | 18.2 /100 | #200 | Poor 18.9% |
| Arabs | 17.7 /100 | #201 | Poor 18.9% |
| Immigrants from Austria | 15.4 /100 | #202 | Poor 18.9% |
| Tohono O'odham | 14.8 /100 | #203 | Poor 18.9% |
| Immigrants from Romania | 14.6 /100 | #204 | Poor 18.9% |
| Russians | 14.2 /100 | #205 | Poor 18.8% |
| Immigrants from Eastern Asia | 14.1 /100 | #206 | Poor 18.8% |
| Immigrants from Chile | 13.6 /100 | #207 | Poor 18.8% |
| Immigrants from Burma/Myanmar | 13.6 /100 | #208 | Poor 18.8% |
| Immigrants from Egypt | 13.5 /100 | #209 | Poor 18.8% |
Immigrants from Austria 3 or more Vehicles in Household Correlation Summary
| Measurement | Immigrants from Austria Data | 3 or more Vehicles in Household Data |
| Minimum | 0.018% | 7.4% |
| Maximum | 8.1% | 49.1% |
| Range | 8.1% | 41.7% |
| Mean | 1.6% | 23.2% |
| Median | 1.2% | 21.9% |
| Interquartile 25% (IQ1) | 0.59% | 18.2% |
| Interquartile 75% (IQ3) | 2.1% | 26.9% |
| Interquartile Range (IQR) | 1.5% | 8.7% |
| Standard Deviation (Sample) | 1.5% | 9.9% |
| Standard Deviation (Population) | 1.5% | 9.8% |
Correlation Details
| Immigrants from Austria Percentile | Sample Size | 3 or more Vehicles in Household |
[ 0.0% - 0.5% ] 0.018% | 123,327,203 | 17.4% |
[ 0.0% - 0.5% ] 0.057% | 24,684,762 | 19.6% |
[ 0.0% - 0.5% ] 0.097% | 10,051,048 | 18.4% |
[ 0.0% - 0.5% ] 0.14% | 3,659,793 | 18.4% |
[ 0.0% - 0.5% ] 0.18% | 2,164,490 | 19.3% |
[ 0.0% - 0.5% ] 0.22% | 961,976 | 21.5% |
[ 0.0% - 0.5% ] 0.26% | 824,868 | 20.1% |
[ 0.0% - 0.5% ] 0.30% | 561,151 | 16.1% |
[ 0.0% - 0.5% ] 0.34% | 362,368 | 18.8% |
[ 0.0% - 0.5% ] 0.39% | 233,558 | 22.3% |
[ 0.0% - 0.5% ] 0.42% | 260,444 | 14.5% |
[ 0.0% - 0.5% ] 0.46% | 139,508 | 22.7% |
[ 0.5% - 1.0% ] 0.50% | 87,062 | 25.7% |
[ 0.5% - 1.0% ] 0.55% | 85,462 | 25.8% |
[ 0.5% - 1.0% ] 0.59% | 66,013 | 25.0% |
[ 0.5% - 1.0% ] 0.63% | 52,814 | 18.2% |
[ 0.5% - 1.0% ] 0.68% | 53,831 | 24.8% |
[ 0.5% - 1.0% ] 0.72% | 76,693 | 25.9% |
[ 0.5% - 1.0% ] 0.74% | 7,803 | 22.8% |
[ 0.5% - 1.0% ] 0.79% | 12,498 | 24.2% |
[ 0.5% - 1.0% ] 0.82% | 19,488 | 10.4% |
[ 0.5% - 1.0% ] 0.87% | 61,067 | 9.6% |
[ 0.5% - 1.0% ] 0.92% | 12,878 | 31.2% |
[ 0.5% - 1.0% ] 0.95% | 15,145 | 32.7% |
[ 0.5% - 1.0% ] 1.00% | 15,840 | 15.6% |
[ 1.0% - 1.5% ] 1.04% | 6,445 | 28.3% |
[ 1.0% - 1.5% ] 1.06% | 30,370 | 26.9% |
[ 1.0% - 1.5% ] 1.11% | 5,744 | 46.2% |
[ 1.0% - 1.5% ] 1.17% | 2,823 | 26.2% |
[ 1.0% - 1.5% ] 1.18% | 2,537 | 40.6% |
[ 1.0% - 1.5% ] 1.25% | 1,598 | 37.4% |
[ 1.0% - 1.5% ] 1.28% | 13,251 | 19.3% |
[ 1.0% - 1.5% ] 1.31% | 4,879 | 26.3% |
[ 1.0% - 1.5% ] 1.36% | 2,135 | 19.5% |
[ 1.0% - 1.5% ] 1.40% | 4,204 | 39.2% |
[ 1.0% - 1.5% ] 1.45% | 4,555 | 21.0% |
[ 1.0% - 1.5% ] 1.47% | 16,026 | 23.9% |
[ 1.5% - 2.0% ] 1.57% | 5,871 | 31.6% |
[ 1.5% - 2.0% ] 1.61% | 2,863 | 22.4% |
[ 1.5% - 2.0% ] 1.63% | 1,533 | 18.2% |
[ 1.5% - 2.0% ] 1.82% | 713 | 19.7% |
[ 1.5% - 2.0% ] 1.94% | 360 | 7.4% |
[ 2.0% - 2.5% ] 2.04% | 1,424 | 40.7% |
[ 2.0% - 2.5% ] 2.10% | 143 | 18.8% |
[ 2.0% - 2.5% ] 2.26% | 133 | 11.3% |
[ 2.0% - 2.5% ] 2.27% | 3,344 | 14.5% |
[ 2.5% - 3.0% ] 2.55% | 1,685 | 37.4% |
[ 2.5% - 3.0% ] 2.59% | 5,406 | 24.4% |
[ 2.5% - 3.0% ] 2.61% | 537 | 10.9% |
[ 2.5% - 3.0% ] 2.73% | 110 | 19.4% |
[ 2.5% - 3.0% ] 2.97% | 101 | 8.6% |
[ 3.0% - 3.5% ] 3.06% | 4,318 | 7.5% |
[ 3.0% - 3.5% ] 3.14% | 2,324 | 10.2% |
[ 3.0% - 3.5% ] 3.36% | 268 | 45.5% |
[ 3.5% - 4.0% ] 3.57% | 420 | 49.1% |
[ 5.5% - 6.0% ] 5.58% | 466 | 9.7% |
[ 6.0% - 6.5% ] 6.04% | 182 | 31.0% |
[ 8.0% - 8.5% ] 8.11% | 37 | 30.4% |