Immigrants from Austria vs Immigrants from Africa Married-Couple Family Poverty
COMPARE
Immigrants from Austria
Immigrants from Africa
Married-Couple Family Poverty
Married-Couple Family Poverty Comparison
Immigrants from Austria
Immigrants from Africa
4.5%
MARRIED-COUPLE FAMILY POVERTY
99.2/ 100
METRIC RATING
74th/ 347
METRIC RANK
5.5%
MARRIED-COUPLE FAMILY POVERTY
17.6/ 100
METRIC RATING
207th/ 347
METRIC RANK
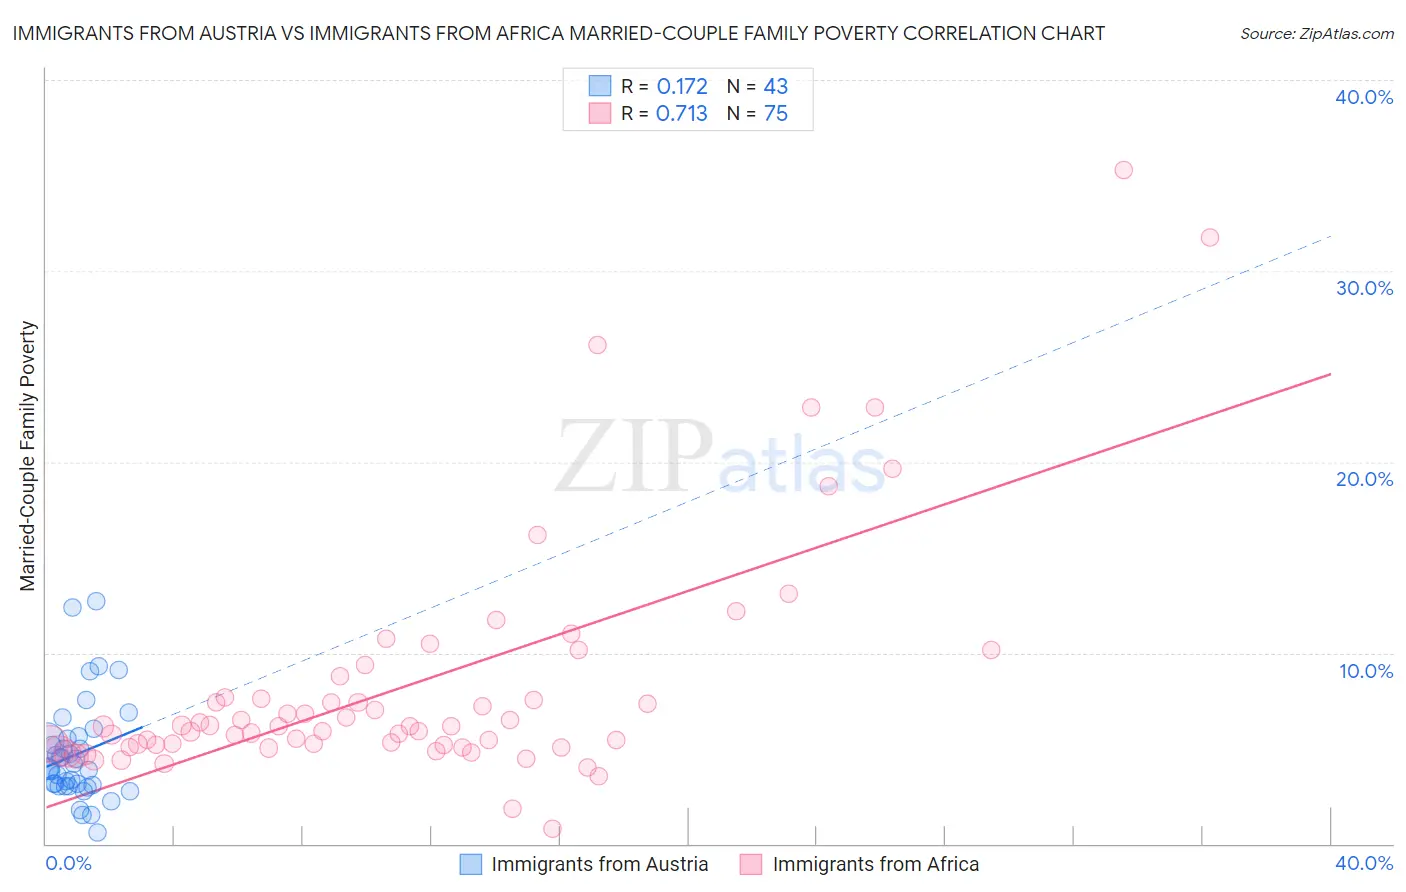
Immigrants from Austria vs Immigrants from Africa Married-Couple Family Poverty Correlation Chart
The statistical analysis conducted on geographies consisting of 167,372,686 people shows a poor positive correlation between the proportion of Immigrants from Austria and poverty level among married-couple families in the United States with a correlation coefficient (R) of 0.172 and weighted average of 4.5%. Similarly, the statistical analysis conducted on geographies consisting of 463,705,705 people shows a strong positive correlation between the proportion of Immigrants from Africa and poverty level among married-couple families in the United States with a correlation coefficient (R) of 0.713 and weighted average of 5.5%, a difference of 21.6%.
Married-Couple Family Poverty Correlation Summary
| Measurement | Immigrants from Austria | Immigrants from Africa |
| Minimum | 0.61% | 0.82% |
| Maximum | 12.7% | 35.3% |
| Range | 12.1% | 34.5% |
| Mean | 4.7% | 8.3% |
| Median | 3.9% | 6.1% |
| Interquartile 25% (IQ1) | 3.0% | 5.2% |
| Interquartile 75% (IQ3) | 5.5% | 7.6% |
| Interquartile Range (IQR) | 2.4% | 2.5% |
| Standard Deviation (Sample) | 2.6% | 6.3% |
| Standard Deviation (Population) | 2.6% | 6.2% |
Similar Demographics by Married-Couple Family Poverty
Demographics Similar to Immigrants from Austria by Married-Couple Family Poverty
In terms of married-couple family poverty, the demographic groups most similar to Immigrants from Austria are Ukrainian (4.5%, a difference of 0.10%), Immigrants from England (4.5%, a difference of 0.22%), Cambodian (4.5%, a difference of 0.27%), Immigrants from North America (4.5%, a difference of 0.32%), and Immigrants from South Africa (4.5%, a difference of 0.38%).
| Demographics | Rating | Rank | Married-Couple Family Poverty |
| Immigrants | Canada | 99.4 /100 | #67 | Exceptional 4.4% |
| Slavs | 99.4 /100 | #68 | Exceptional 4.4% |
| New Zealanders | 99.4 /100 | #69 | Exceptional 4.4% |
| Immigrants | Korea | 99.4 /100 | #70 | Exceptional 4.5% |
| Immigrants | North America | 99.3 /100 | #71 | Exceptional 4.5% |
| Immigrants | England | 99.3 /100 | #72 | Exceptional 4.5% |
| Ukrainians | 99.2 /100 | #73 | Exceptional 4.5% |
| Immigrants | Austria | 99.2 /100 | #74 | Exceptional 4.5% |
| Cambodians | 99.2 /100 | #75 | Exceptional 4.5% |
| Immigrants | South Africa | 99.1 /100 | #76 | Exceptional 4.5% |
| Immigrants | Latvia | 99.1 /100 | #77 | Exceptional 4.5% |
| Scotch-Irish | 99.1 /100 | #78 | Exceptional 4.5% |
| Immigrants | Iran | 99.0 /100 | #79 | Exceptional 4.5% |
| Icelanders | 99.0 /100 | #80 | Exceptional 4.5% |
| Immigrants | Greece | 98.9 /100 | #81 | Exceptional 4.5% |
Demographics Similar to Immigrants from Africa by Married-Couple Family Poverty
In terms of married-couple family poverty, the demographic groups most similar to Immigrants from Africa are Osage (5.4%, a difference of 0.14%), Chippewa (5.4%, a difference of 0.24%), French American Indian (5.5%, a difference of 0.32%), Immigrants from Costa Rica (5.4%, a difference of 0.33%), and Immigrants from Syria (5.5%, a difference of 0.46%).
| Demographics | Rating | Rank | Married-Couple Family Poverty |
| Immigrants | Morocco | 24.3 /100 | #200 | Fair 5.4% |
| Lebanese | 24.1 /100 | #201 | Fair 5.4% |
| Immigrants | Middle Africa | 23.8 /100 | #202 | Fair 5.4% |
| Immigrants | Peru | 21.8 /100 | #203 | Fair 5.4% |
| Immigrants | Costa Rica | 19.4 /100 | #204 | Poor 5.4% |
| Chippewa | 18.9 /100 | #205 | Poor 5.4% |
| Osage | 18.4 /100 | #206 | Poor 5.4% |
| Immigrants | Africa | 17.6 /100 | #207 | Poor 5.5% |
| French American Indians | 16.1 /100 | #208 | Poor 5.5% |
| Immigrants | Syria | 15.4 /100 | #209 | Poor 5.5% |
| Immigrants | Micronesia | 14.4 /100 | #210 | Poor 5.5% |
| Nigerians | 14.3 /100 | #211 | Poor 5.5% |
| Immigrants | Thailand | 14.0 /100 | #212 | Poor 5.5% |
| Immigrants | Liberia | 13.3 /100 | #213 | Poor 5.5% |
| Iroquois | 13.1 /100 | #214 | Poor 5.5% |