Immigrants from Austria vs Cheyenne Married-Couple Family Poverty
COMPARE
Immigrants from Austria
Cheyenne
Married-Couple Family Poverty
Married-Couple Family Poverty Comparison
Immigrants from Austria
Cheyenne
4.5%
MARRIED-COUPLE FAMILY POVERTY
99.2/ 100
METRIC RATING
74th/ 347
METRIC RANK
9.4%
MARRIED-COUPLE FAMILY POVERTY
0.0/ 100
METRIC RATING
338th/ 347
METRIC RANK
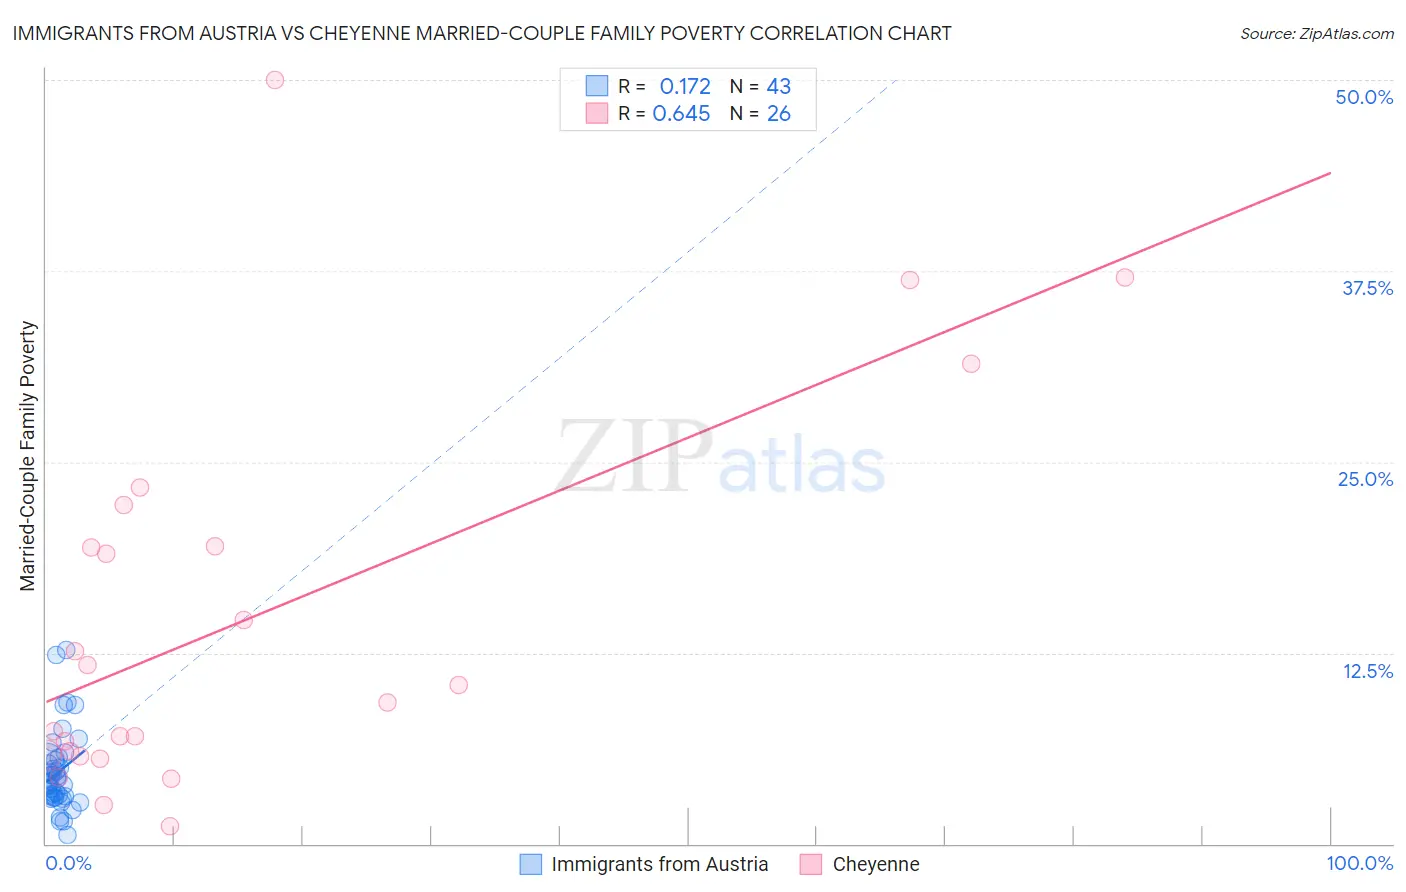
Immigrants from Austria vs Cheyenne Married-Couple Family Poverty Correlation Chart
The statistical analysis conducted on geographies consisting of 167,372,686 people shows a poor positive correlation between the proportion of Immigrants from Austria and poverty level among married-couple families in the United States with a correlation coefficient (R) of 0.172 and weighted average of 4.5%. Similarly, the statistical analysis conducted on geographies consisting of 80,557,927 people shows a significant positive correlation between the proportion of Cheyenne and poverty level among married-couple families in the United States with a correlation coefficient (R) of 0.645 and weighted average of 9.4%, a difference of 110.4%.
Married-Couple Family Poverty Correlation Summary
| Measurement | Immigrants from Austria | Cheyenne |
| Minimum | 0.61% | 1.1% |
| Maximum | 12.7% | 50.0% |
| Range | 12.1% | 48.9% |
| Mean | 4.7% | 14.7% |
| Median | 3.9% | 9.8% |
| Interquartile 25% (IQ1) | 3.0% | 5.8% |
| Interquartile 75% (IQ3) | 5.5% | 19.4% |
| Interquartile Range (IQR) | 2.4% | 13.7% |
| Standard Deviation (Sample) | 2.6% | 12.5% |
| Standard Deviation (Population) | 2.6% | 12.2% |
Similar Demographics by Married-Couple Family Poverty
Demographics Similar to Immigrants from Austria by Married-Couple Family Poverty
In terms of married-couple family poverty, the demographic groups most similar to Immigrants from Austria are Ukrainian (4.5%, a difference of 0.10%), Immigrants from England (4.5%, a difference of 0.22%), Cambodian (4.5%, a difference of 0.27%), Immigrants from North America (4.5%, a difference of 0.32%), and Immigrants from South Africa (4.5%, a difference of 0.38%).
| Demographics | Rating | Rank | Married-Couple Family Poverty |
| Immigrants | Canada | 99.4 /100 | #67 | Exceptional 4.4% |
| Slavs | 99.4 /100 | #68 | Exceptional 4.4% |
| New Zealanders | 99.4 /100 | #69 | Exceptional 4.4% |
| Immigrants | Korea | 99.4 /100 | #70 | Exceptional 4.5% |
| Immigrants | North America | 99.3 /100 | #71 | Exceptional 4.5% |
| Immigrants | England | 99.3 /100 | #72 | Exceptional 4.5% |
| Ukrainians | 99.2 /100 | #73 | Exceptional 4.5% |
| Immigrants | Austria | 99.2 /100 | #74 | Exceptional 4.5% |
| Cambodians | 99.2 /100 | #75 | Exceptional 4.5% |
| Immigrants | South Africa | 99.1 /100 | #76 | Exceptional 4.5% |
| Immigrants | Latvia | 99.1 /100 | #77 | Exceptional 4.5% |
| Scotch-Irish | 99.1 /100 | #78 | Exceptional 4.5% |
| Immigrants | Iran | 99.0 /100 | #79 | Exceptional 4.5% |
| Icelanders | 99.0 /100 | #80 | Exceptional 4.5% |
| Immigrants | Greece | 98.9 /100 | #81 | Exceptional 4.5% |
Demographics Similar to Cheyenne by Married-Couple Family Poverty
In terms of married-couple family poverty, the demographic groups most similar to Cheyenne are Crow (9.6%, a difference of 1.3%), Yuman (9.7%, a difference of 3.2%), Yakama (9.0%, a difference of 5.3%), Apache (9.0%, a difference of 5.4%), and Sioux (8.7%, a difference of 8.5%).
| Demographics | Rating | Rank | Married-Couple Family Poverty |
| Central American Indians | 0.0 /100 | #331 | Tragic 8.3% |
| Dominicans | 0.0 /100 | #332 | Tragic 8.3% |
| Lumbee | 0.0 /100 | #333 | Tragic 8.3% |
| Immigrants | Dominican Republic | 0.0 /100 | #334 | Tragic 8.4% |
| Sioux | 0.0 /100 | #335 | Tragic 8.7% |
| Apache | 0.0 /100 | #336 | Tragic 9.0% |
| Yakama | 0.0 /100 | #337 | Tragic 9.0% |
| Cheyenne | 0.0 /100 | #338 | Tragic 9.4% |
| Crow | 0.0 /100 | #339 | Tragic 9.6% |
| Yuman | 0.0 /100 | #340 | Tragic 9.7% |
| Pueblo | 0.0 /100 | #341 | Tragic 11.1% |
| Tohono O'odham | 0.0 /100 | #342 | Tragic 11.2% |
| Pima | 0.0 /100 | #343 | Tragic 11.4% |
| Navajo | 0.0 /100 | #344 | Tragic 11.9% |
| Puerto Ricans | 0.0 /100 | #345 | Tragic 12.6% |