Immigrants from Austria vs Immigrants from Guyana Married-Couple Family Poverty
COMPARE
Immigrants from Austria
Immigrants from Guyana
Married-Couple Family Poverty
Married-Couple Family Poverty Comparison
Immigrants from Austria
Immigrants from Guyana
4.5%
MARRIED-COUPLE FAMILY POVERTY
99.2/ 100
METRIC RATING
74th/ 347
METRIC RANK
6.7%
MARRIED-COUPLE FAMILY POVERTY
0.0/ 100
METRIC RATING
298th/ 347
METRIC RANK
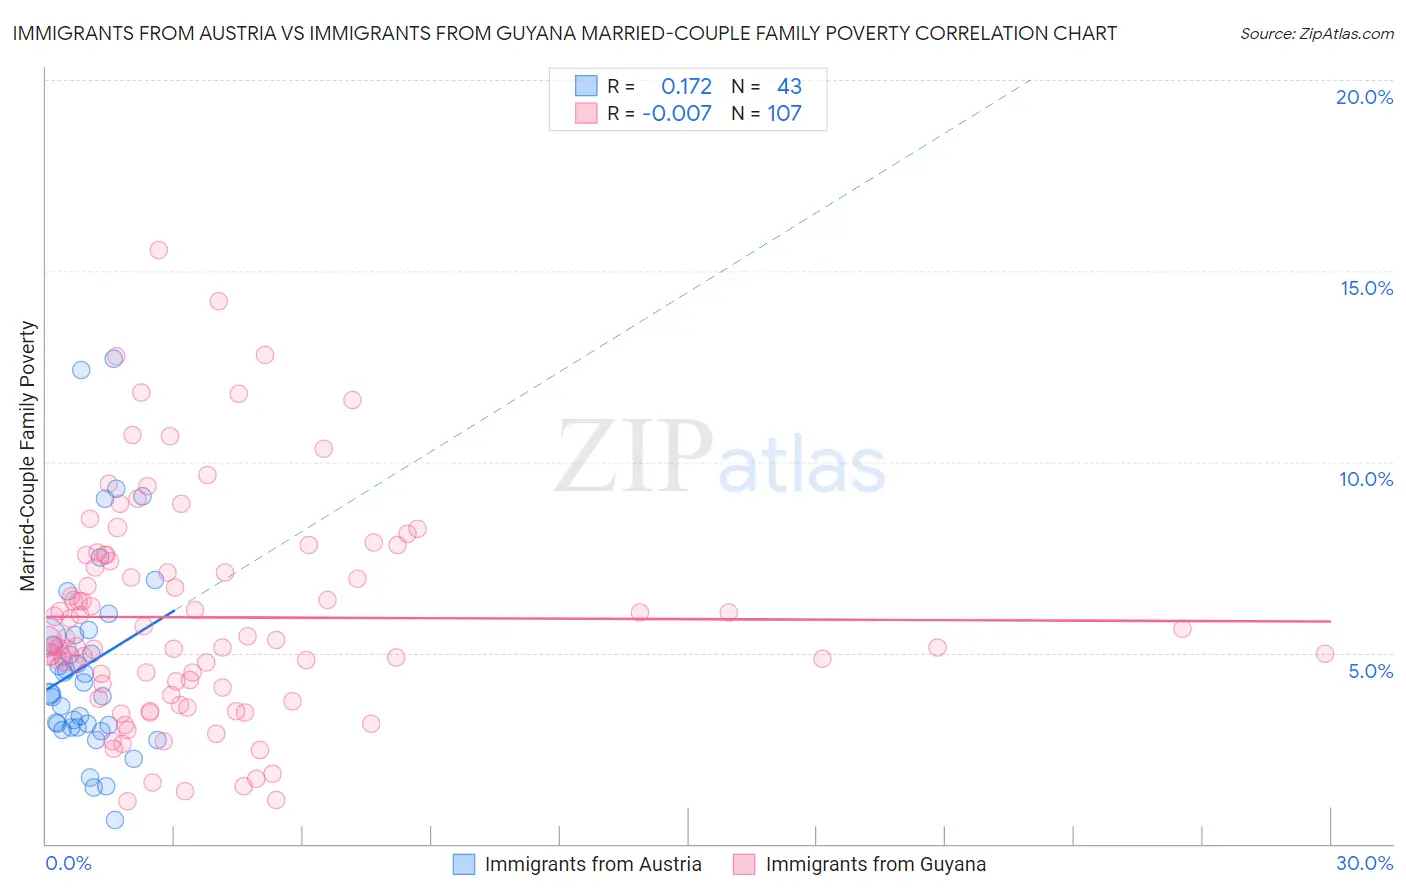
Immigrants from Austria vs Immigrants from Guyana Married-Couple Family Poverty Correlation Chart
The statistical analysis conducted on geographies consisting of 167,372,686 people shows a poor positive correlation between the proportion of Immigrants from Austria and poverty level among married-couple families in the United States with a correlation coefficient (R) of 0.172 and weighted average of 4.5%. Similarly, the statistical analysis conducted on geographies consisting of 182,855,108 people shows no correlation between the proportion of Immigrants from Guyana and poverty level among married-couple families in the United States with a correlation coefficient (R) of -0.007 and weighted average of 6.7%, a difference of 48.3%.
Married-Couple Family Poverty Correlation Summary
| Measurement | Immigrants from Austria | Immigrants from Guyana |
| Minimum | 0.61% | 1.1% |
| Maximum | 12.7% | 15.5% |
| Range | 12.1% | 14.4% |
| Mean | 4.7% | 5.9% |
| Median | 3.9% | 5.3% |
| Interquartile 25% (IQ1) | 3.0% | 4.1% |
| Interquartile 75% (IQ3) | 5.5% | 7.6% |
| Interquartile Range (IQR) | 2.4% | 3.5% |
| Standard Deviation (Sample) | 2.6% | 2.9% |
| Standard Deviation (Population) | 2.6% | 2.8% |
Similar Demographics by Married-Couple Family Poverty
Demographics Similar to Immigrants from Austria by Married-Couple Family Poverty
In terms of married-couple family poverty, the demographic groups most similar to Immigrants from Austria are Ukrainian (4.5%, a difference of 0.10%), Immigrants from England (4.5%, a difference of 0.22%), Cambodian (4.5%, a difference of 0.27%), Immigrants from North America (4.5%, a difference of 0.32%), and Immigrants from South Africa (4.5%, a difference of 0.38%).
| Demographics | Rating | Rank | Married-Couple Family Poverty |
| Immigrants | Canada | 99.4 /100 | #67 | Exceptional 4.4% |
| Slavs | 99.4 /100 | #68 | Exceptional 4.4% |
| New Zealanders | 99.4 /100 | #69 | Exceptional 4.4% |
| Immigrants | Korea | 99.4 /100 | #70 | Exceptional 4.5% |
| Immigrants | North America | 99.3 /100 | #71 | Exceptional 4.5% |
| Immigrants | England | 99.3 /100 | #72 | Exceptional 4.5% |
| Ukrainians | 99.2 /100 | #73 | Exceptional 4.5% |
| Immigrants | Austria | 99.2 /100 | #74 | Exceptional 4.5% |
| Cambodians | 99.2 /100 | #75 | Exceptional 4.5% |
| Immigrants | South Africa | 99.1 /100 | #76 | Exceptional 4.5% |
| Immigrants | Latvia | 99.1 /100 | #77 | Exceptional 4.5% |
| Scotch-Irish | 99.1 /100 | #78 | Exceptional 4.5% |
| Immigrants | Iran | 99.0 /100 | #79 | Exceptional 4.5% |
| Icelanders | 99.0 /100 | #80 | Exceptional 4.5% |
| Immigrants | Greece | 98.9 /100 | #81 | Exceptional 4.5% |
Demographics Similar to Immigrants from Guyana by Married-Couple Family Poverty
In terms of married-couple family poverty, the demographic groups most similar to Immigrants from Guyana are U.S. Virgin Islander (6.6%, a difference of 0.070%), Kiowa (6.6%, a difference of 0.070%), Immigrants from Uzbekistan (6.6%, a difference of 0.18%), Bahamian (6.6%, a difference of 0.47%), and Nicaraguan (6.7%, a difference of 0.55%).
| Demographics | Rating | Rank | Married-Couple Family Poverty |
| Belizeans | 0.0 /100 | #291 | Tragic 6.5% |
| Immigrants | Lebanon | 0.0 /100 | #292 | Tragic 6.6% |
| Arapaho | 0.0 /100 | #293 | Tragic 6.6% |
| Bahamians | 0.0 /100 | #294 | Tragic 6.6% |
| Immigrants | Uzbekistan | 0.0 /100 | #295 | Tragic 6.6% |
| U.S. Virgin Islanders | 0.0 /100 | #296 | Tragic 6.6% |
| Kiowa | 0.0 /100 | #297 | Tragic 6.6% |
| Immigrants | Guyana | 0.0 /100 | #298 | Tragic 6.7% |
| Nicaraguans | 0.0 /100 | #299 | Tragic 6.7% |
| Immigrants | Belize | 0.0 /100 | #300 | Tragic 6.7% |
| Central Americans | 0.0 /100 | #301 | Tragic 6.7% |
| Immigrants | Ecuador | 0.0 /100 | #302 | Tragic 6.7% |
| Immigrants | El Salvador | 0.0 /100 | #303 | Tragic 6.8% |
| Cubans | 0.0 /100 | #304 | Tragic 6.8% |
| Haitians | 0.0 /100 | #305 | Tragic 6.8% |