Finnish vs Kiowa Married-Couple Family Poverty
COMPARE
Finnish
Kiowa
Married-Couple Family Poverty
Married-Couple Family Poverty Comparison
Finns
Kiowa
4.2%
MARRIED-COUPLE FAMILY POVERTY
99.9/ 100
METRIC RATING
30th/ 347
METRIC RANK
6.6%
MARRIED-COUPLE FAMILY POVERTY
0.0/ 100
METRIC RATING
297th/ 347
METRIC RANK
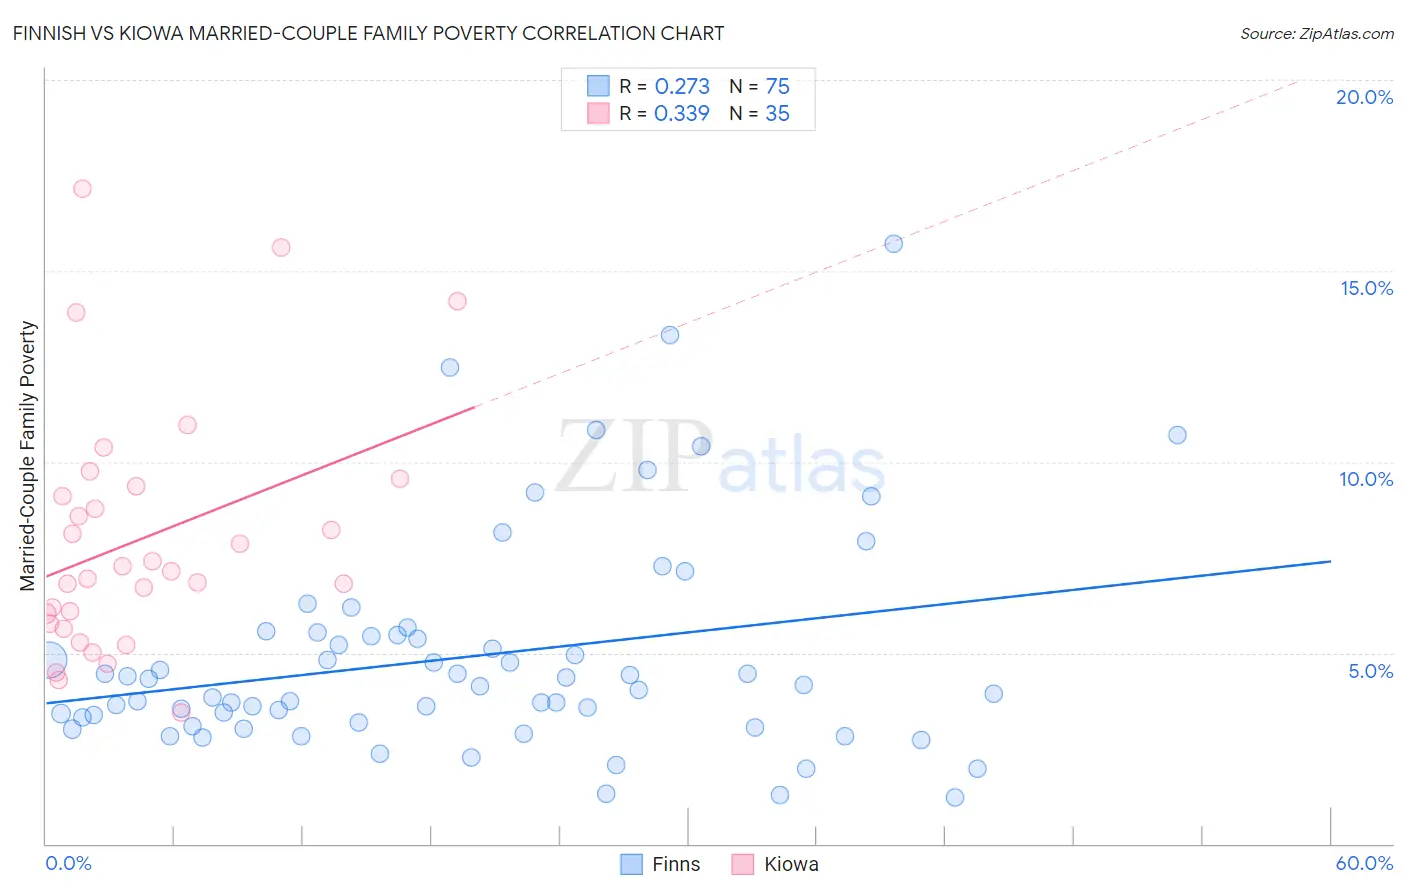
Finnish vs Kiowa Married-Couple Family Poverty Correlation Chart
The statistical analysis conducted on geographies consisting of 399,709,206 people shows a weak positive correlation between the proportion of Finns and poverty level among married-couple families in the United States with a correlation coefficient (R) of 0.273 and weighted average of 4.2%. Similarly, the statistical analysis conducted on geographies consisting of 56,003,088 people shows a mild positive correlation between the proportion of Kiowa and poverty level among married-couple families in the United States with a correlation coefficient (R) of 0.339 and weighted average of 6.6%, a difference of 59.8%.
Married-Couple Family Poverty Correlation Summary
| Measurement | Finnish | Kiowa |
| Minimum | 1.2% | 3.4% |
| Maximum | 15.7% | 17.1% |
| Range | 14.5% | 13.7% |
| Mean | 4.9% | 8.0% |
| Median | 4.1% | 7.1% |
| Interquartile 25% (IQ1) | 3.2% | 5.8% |
| Interquartile 75% (IQ3) | 5.5% | 9.4% |
| Interquartile Range (IQR) | 2.3% | 3.6% |
| Standard Deviation (Sample) | 2.8% | 3.2% |
| Standard Deviation (Population) | 2.8% | 3.2% |
Similar Demographics by Married-Couple Family Poverty
Demographics Similar to Finns by Married-Couple Family Poverty
In terms of married-couple family poverty, the demographic groups most similar to Finns are Estonian (4.2%, a difference of 0.080%), Greek (4.2%, a difference of 0.19%), Immigrants from Scotland (4.2%, a difference of 0.24%), Scandinavian (4.1%, a difference of 0.28%), and Danish (4.1%, a difference of 0.39%).
| Demographics | Rating | Rank | Married-Couple Family Poverty |
| Bhutanese | 99.9 /100 | #23 | Exceptional 4.1% |
| Eastern Europeans | 99.9 /100 | #24 | Exceptional 4.1% |
| Immigrants | Taiwan | 99.9 /100 | #25 | Exceptional 4.1% |
| Cypriots | 99.9 /100 | #26 | Exceptional 4.1% |
| Danes | 99.9 /100 | #27 | Exceptional 4.1% |
| Scandinavians | 99.9 /100 | #28 | Exceptional 4.1% |
| Immigrants | Scotland | 99.9 /100 | #29 | Exceptional 4.2% |
| Finns | 99.9 /100 | #30 | Exceptional 4.2% |
| Estonians | 99.9 /100 | #31 | Exceptional 4.2% |
| Greeks | 99.9 /100 | #32 | Exceptional 4.2% |
| Irish | 99.9 /100 | #33 | Exceptional 4.2% |
| Dutch | 99.9 /100 | #34 | Exceptional 4.2% |
| Europeans | 99.9 /100 | #35 | Exceptional 4.2% |
| English | 99.9 /100 | #36 | Exceptional 4.2% |
| Iranians | 99.9 /100 | #37 | Exceptional 4.2% |
Demographics Similar to Kiowa by Married-Couple Family Poverty
In terms of married-couple family poverty, the demographic groups most similar to Kiowa are U.S. Virgin Islander (6.6%, a difference of 0.010%), Immigrants from Guyana (6.7%, a difference of 0.070%), Immigrants from Uzbekistan (6.6%, a difference of 0.11%), Bahamian (6.6%, a difference of 0.40%), and Nicaraguan (6.7%, a difference of 0.61%).
| Demographics | Rating | Rank | Married-Couple Family Poverty |
| Immigrants | Barbados | 0.0 /100 | #290 | Tragic 6.5% |
| Belizeans | 0.0 /100 | #291 | Tragic 6.5% |
| Immigrants | Lebanon | 0.0 /100 | #292 | Tragic 6.6% |
| Arapaho | 0.0 /100 | #293 | Tragic 6.6% |
| Bahamians | 0.0 /100 | #294 | Tragic 6.6% |
| Immigrants | Uzbekistan | 0.0 /100 | #295 | Tragic 6.6% |
| U.S. Virgin Islanders | 0.0 /100 | #296 | Tragic 6.6% |
| Kiowa | 0.0 /100 | #297 | Tragic 6.6% |
| Immigrants | Guyana | 0.0 /100 | #298 | Tragic 6.7% |
| Nicaraguans | 0.0 /100 | #299 | Tragic 6.7% |
| Immigrants | Belize | 0.0 /100 | #300 | Tragic 6.7% |
| Central Americans | 0.0 /100 | #301 | Tragic 6.7% |
| Immigrants | Ecuador | 0.0 /100 | #302 | Tragic 6.7% |
| Immigrants | El Salvador | 0.0 /100 | #303 | Tragic 6.8% |
| Cubans | 0.0 /100 | #304 | Tragic 6.8% |