Finnish vs Immigrants from Bosnia and Herzegovina Married-Couple Family Poverty
COMPARE
Finnish
Immigrants from Bosnia and Herzegovina
Married-Couple Family Poverty
Married-Couple Family Poverty Comparison
Finns
Immigrants from Bosnia and Herzegovina
4.2%
MARRIED-COUPLE FAMILY POVERTY
99.9/ 100
METRIC RATING
30th/ 347
METRIC RANK
4.8%
MARRIED-COUPLE FAMILY POVERTY
92.5/ 100
METRIC RATING
125th/ 347
METRIC RANK
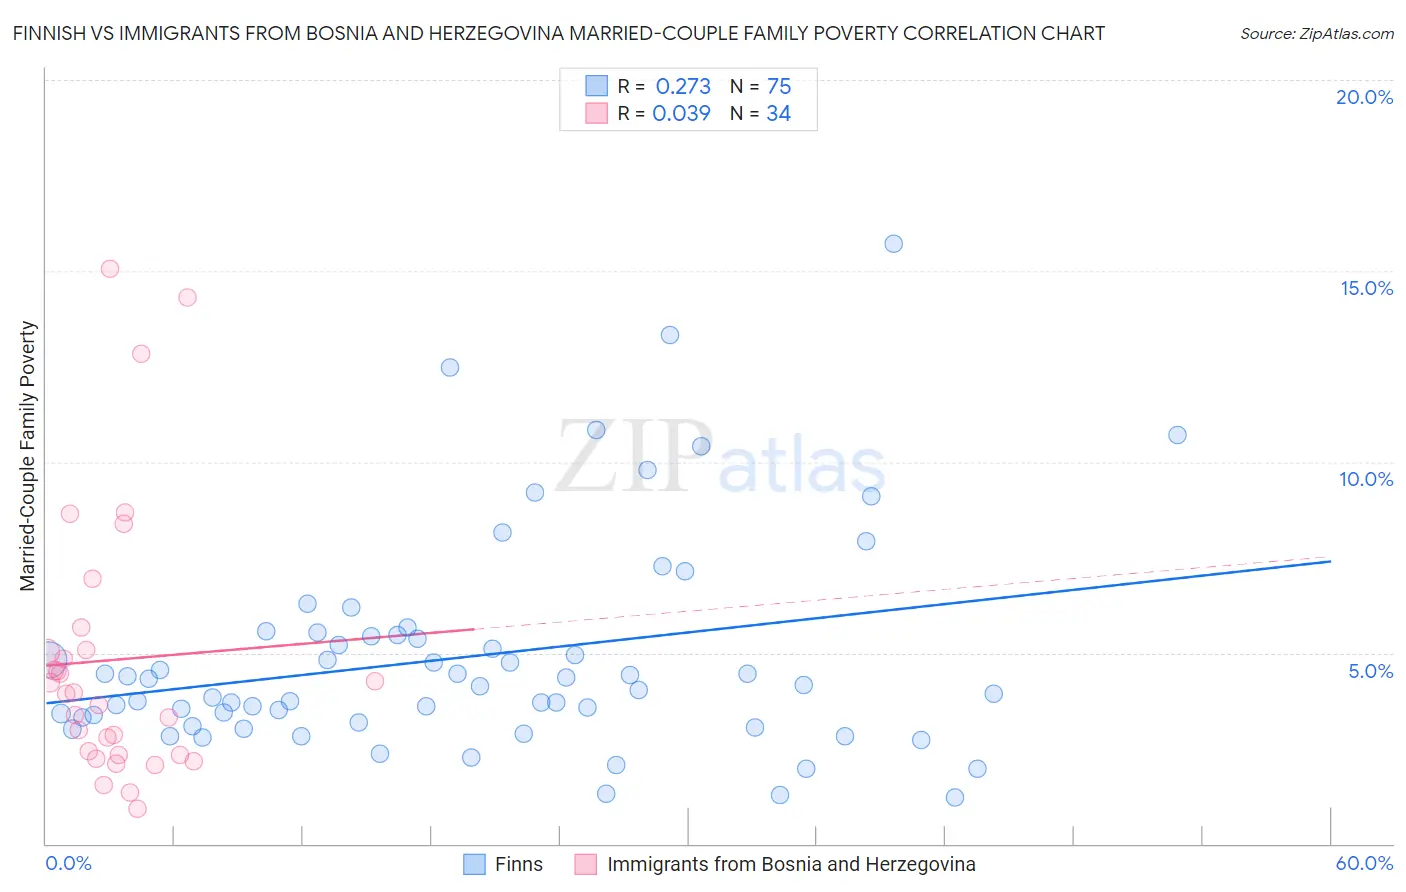
Finnish vs Immigrants from Bosnia and Herzegovina Married-Couple Family Poverty Correlation Chart
The statistical analysis conducted on geographies consisting of 399,709,206 people shows a weak positive correlation between the proportion of Finns and poverty level among married-couple families in the United States with a correlation coefficient (R) of 0.273 and weighted average of 4.2%. Similarly, the statistical analysis conducted on geographies consisting of 156,293,901 people shows no correlation between the proportion of Immigrants from Bosnia and Herzegovina and poverty level among married-couple families in the United States with a correlation coefficient (R) of 0.039 and weighted average of 4.8%, a difference of 16.3%.
Married-Couple Family Poverty Correlation Summary
| Measurement | Finnish | Immigrants from Bosnia and Herzegovina |
| Minimum | 1.2% | 0.92% |
| Maximum | 15.7% | 15.1% |
| Range | 14.5% | 14.1% |
| Mean | 4.9% | 4.8% |
| Median | 4.1% | 3.9% |
| Interquartile 25% (IQ1) | 3.2% | 2.3% |
| Interquartile 75% (IQ3) | 5.5% | 5.1% |
| Interquartile Range (IQR) | 2.3% | 2.7% |
| Standard Deviation (Sample) | 2.8% | 3.5% |
| Standard Deviation (Population) | 2.8% | 3.5% |
Similar Demographics by Married-Couple Family Poverty
Demographics Similar to Finns by Married-Couple Family Poverty
In terms of married-couple family poverty, the demographic groups most similar to Finns are Estonian (4.2%, a difference of 0.080%), Greek (4.2%, a difference of 0.19%), Immigrants from Scotland (4.2%, a difference of 0.24%), Scandinavian (4.1%, a difference of 0.28%), and Danish (4.1%, a difference of 0.39%).
| Demographics | Rating | Rank | Married-Couple Family Poverty |
| Bhutanese | 99.9 /100 | #23 | Exceptional 4.1% |
| Eastern Europeans | 99.9 /100 | #24 | Exceptional 4.1% |
| Immigrants | Taiwan | 99.9 /100 | #25 | Exceptional 4.1% |
| Cypriots | 99.9 /100 | #26 | Exceptional 4.1% |
| Danes | 99.9 /100 | #27 | Exceptional 4.1% |
| Scandinavians | 99.9 /100 | #28 | Exceptional 4.1% |
| Immigrants | Scotland | 99.9 /100 | #29 | Exceptional 4.2% |
| Finns | 99.9 /100 | #30 | Exceptional 4.2% |
| Estonians | 99.9 /100 | #31 | Exceptional 4.2% |
| Greeks | 99.9 /100 | #32 | Exceptional 4.2% |
| Irish | 99.9 /100 | #33 | Exceptional 4.2% |
| Dutch | 99.9 /100 | #34 | Exceptional 4.2% |
| Europeans | 99.9 /100 | #35 | Exceptional 4.2% |
| English | 99.9 /100 | #36 | Exceptional 4.2% |
| Iranians | 99.9 /100 | #37 | Exceptional 4.2% |
Demographics Similar to Immigrants from Bosnia and Herzegovina by Married-Couple Family Poverty
In terms of married-couple family poverty, the demographic groups most similar to Immigrants from Bosnia and Herzegovina are Romanian (4.8%, a difference of 0.020%), Immigrants from Asia (4.8%, a difference of 0.070%), Egyptian (4.8%, a difference of 0.21%), Jordanian (4.8%, a difference of 0.29%), and White/Caucasian (4.8%, a difference of 0.30%).
| Demographics | Rating | Rank | Married-Couple Family Poverty |
| Immigrants | Philippines | 94.6 /100 | #118 | Exceptional 4.8% |
| Immigrants | Eastern Asia | 94.0 /100 | #119 | Exceptional 4.8% |
| Immigrants | Southern Europe | 93.4 /100 | #120 | Exceptional 4.8% |
| Indians (Asian) | 93.2 /100 | #121 | Exceptional 4.8% |
| Whites/Caucasians | 93.1 /100 | #122 | Exceptional 4.8% |
| Jordanians | 93.1 /100 | #123 | Exceptional 4.8% |
| Romanians | 92.5 /100 | #124 | Exceptional 4.8% |
| Immigrants | Bosnia and Herzegovina | 92.5 /100 | #125 | Exceptional 4.8% |
| Immigrants | Asia | 92.3 /100 | #126 | Exceptional 4.8% |
| Egyptians | 92.0 /100 | #127 | Exceptional 4.8% |
| Palestinians | 91.2 /100 | #128 | Exceptional 4.9% |
| Immigrants | Pakistan | 90.7 /100 | #129 | Exceptional 4.9% |
| Soviet Union | 90.7 /100 | #130 | Exceptional 4.9% |
| Immigrants | Eastern Europe | 90.5 /100 | #131 | Exceptional 4.9% |
| Puget Sound Salish | 90.4 /100 | #132 | Exceptional 4.9% |