Finnish vs Paraguayan Married-Couple Family Poverty
COMPARE
Finnish
Paraguayan
Married-Couple Family Poverty
Married-Couple Family Poverty Comparison
Finns
Paraguayans
4.2%
MARRIED-COUPLE FAMILY POVERTY
99.9/ 100
METRIC RATING
30th/ 347
METRIC RANK
5.1%
MARRIED-COUPLE FAMILY POVERTY
61.5/ 100
METRIC RATING
166th/ 347
METRIC RANK
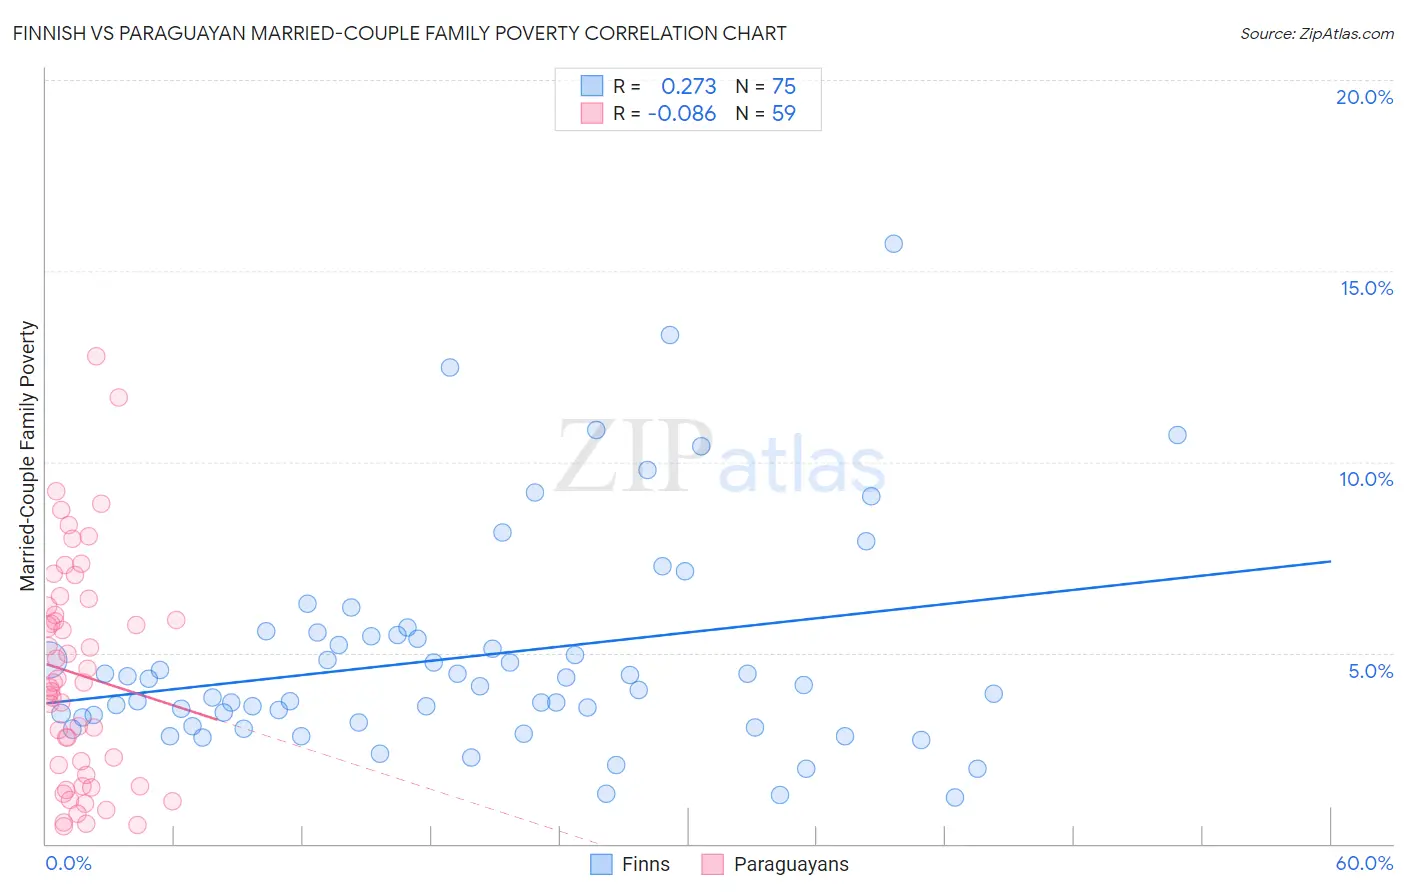
Finnish vs Paraguayan Married-Couple Family Poverty Correlation Chart
The statistical analysis conducted on geographies consisting of 399,709,206 people shows a weak positive correlation between the proportion of Finns and poverty level among married-couple families in the United States with a correlation coefficient (R) of 0.273 and weighted average of 4.2%. Similarly, the statistical analysis conducted on geographies consisting of 94,718,815 people shows a slight negative correlation between the proportion of Paraguayans and poverty level among married-couple families in the United States with a correlation coefficient (R) of -0.086 and weighted average of 5.1%, a difference of 23.7%.
Married-Couple Family Poverty Correlation Summary
| Measurement | Finnish | Paraguayan |
| Minimum | 1.2% | 0.45% |
| Maximum | 15.7% | 12.8% |
| Range | 14.5% | 12.3% |
| Mean | 4.9% | 4.4% |
| Median | 4.1% | 4.2% |
| Interquartile 25% (IQ1) | 3.2% | 1.8% |
| Interquartile 75% (IQ3) | 5.5% | 6.2% |
| Interquartile Range (IQR) | 2.3% | 4.4% |
| Standard Deviation (Sample) | 2.8% | 2.9% |
| Standard Deviation (Population) | 2.8% | 2.9% |
Similar Demographics by Married-Couple Family Poverty
Demographics Similar to Finns by Married-Couple Family Poverty
In terms of married-couple family poverty, the demographic groups most similar to Finns are Estonian (4.2%, a difference of 0.080%), Greek (4.2%, a difference of 0.19%), Immigrants from Scotland (4.2%, a difference of 0.24%), Scandinavian (4.1%, a difference of 0.28%), and Danish (4.1%, a difference of 0.39%).
| Demographics | Rating | Rank | Married-Couple Family Poverty |
| Bhutanese | 99.9 /100 | #23 | Exceptional 4.1% |
| Eastern Europeans | 99.9 /100 | #24 | Exceptional 4.1% |
| Immigrants | Taiwan | 99.9 /100 | #25 | Exceptional 4.1% |
| Cypriots | 99.9 /100 | #26 | Exceptional 4.1% |
| Danes | 99.9 /100 | #27 | Exceptional 4.1% |
| Scandinavians | 99.9 /100 | #28 | Exceptional 4.1% |
| Immigrants | Scotland | 99.9 /100 | #29 | Exceptional 4.2% |
| Finns | 99.9 /100 | #30 | Exceptional 4.2% |
| Estonians | 99.9 /100 | #31 | Exceptional 4.2% |
| Greeks | 99.9 /100 | #32 | Exceptional 4.2% |
| Irish | 99.9 /100 | #33 | Exceptional 4.2% |
| Dutch | 99.9 /100 | #34 | Exceptional 4.2% |
| Europeans | 99.9 /100 | #35 | Exceptional 4.2% |
| English | 99.9 /100 | #36 | Exceptional 4.2% |
| Iranians | 99.9 /100 | #37 | Exceptional 4.2% |
Demographics Similar to Paraguayans by Married-Couple Family Poverty
In terms of married-couple family poverty, the demographic groups most similar to Paraguayans are Costa Rican (5.1%, a difference of 0.0%), Immigrants from Malaysia (5.1%, a difference of 0.090%), Hawaiian (5.1%, a difference of 0.10%), Sierra Leonean (5.1%, a difference of 0.34%), and Immigrants from Jordan (5.1%, a difference of 0.65%).
| Demographics | Rating | Rank | Married-Couple Family Poverty |
| Immigrants | Saudi Arabia | 70.3 /100 | #159 | Good 5.1% |
| Pennsylvania Germans | 68.5 /100 | #160 | Good 5.1% |
| Ethiopians | 68.1 /100 | #161 | Good 5.1% |
| Immigrants | Jordan | 66.5 /100 | #162 | Good 5.1% |
| Sierra Leoneans | 64.1 /100 | #163 | Good 5.1% |
| Hawaiians | 62.3 /100 | #164 | Good 5.1% |
| Immigrants | Malaysia | 62.2 /100 | #165 | Good 5.1% |
| Paraguayans | 61.5 /100 | #166 | Good 5.1% |
| Costa Ricans | 61.5 /100 | #167 | Good 5.1% |
| Immigrants | Uganda | 54.9 /100 | #168 | Average 5.2% |
| Ottawa | 54.5 /100 | #169 | Average 5.2% |
| Immigrants | Argentina | 54.4 /100 | #170 | Average 5.2% |
| Bermudans | 52.9 /100 | #171 | Average 5.2% |
| Immigrants | Northern Africa | 51.3 /100 | #172 | Average 5.2% |
| Alsatians | 51.2 /100 | #173 | Average 5.2% |