Finnish vs Norwegian Married-Couple Family Poverty
COMPARE
Finnish
Norwegian
Married-Couple Family Poverty
Married-Couple Family Poverty Comparison
Finns
Norwegians
4.2%
MARRIED-COUPLE FAMILY POVERTY
99.9/ 100
METRIC RATING
30th/ 347
METRIC RANK
3.7%
MARRIED-COUPLE FAMILY POVERTY
100.0/ 100
METRIC RATING
3rd/ 347
METRIC RANK
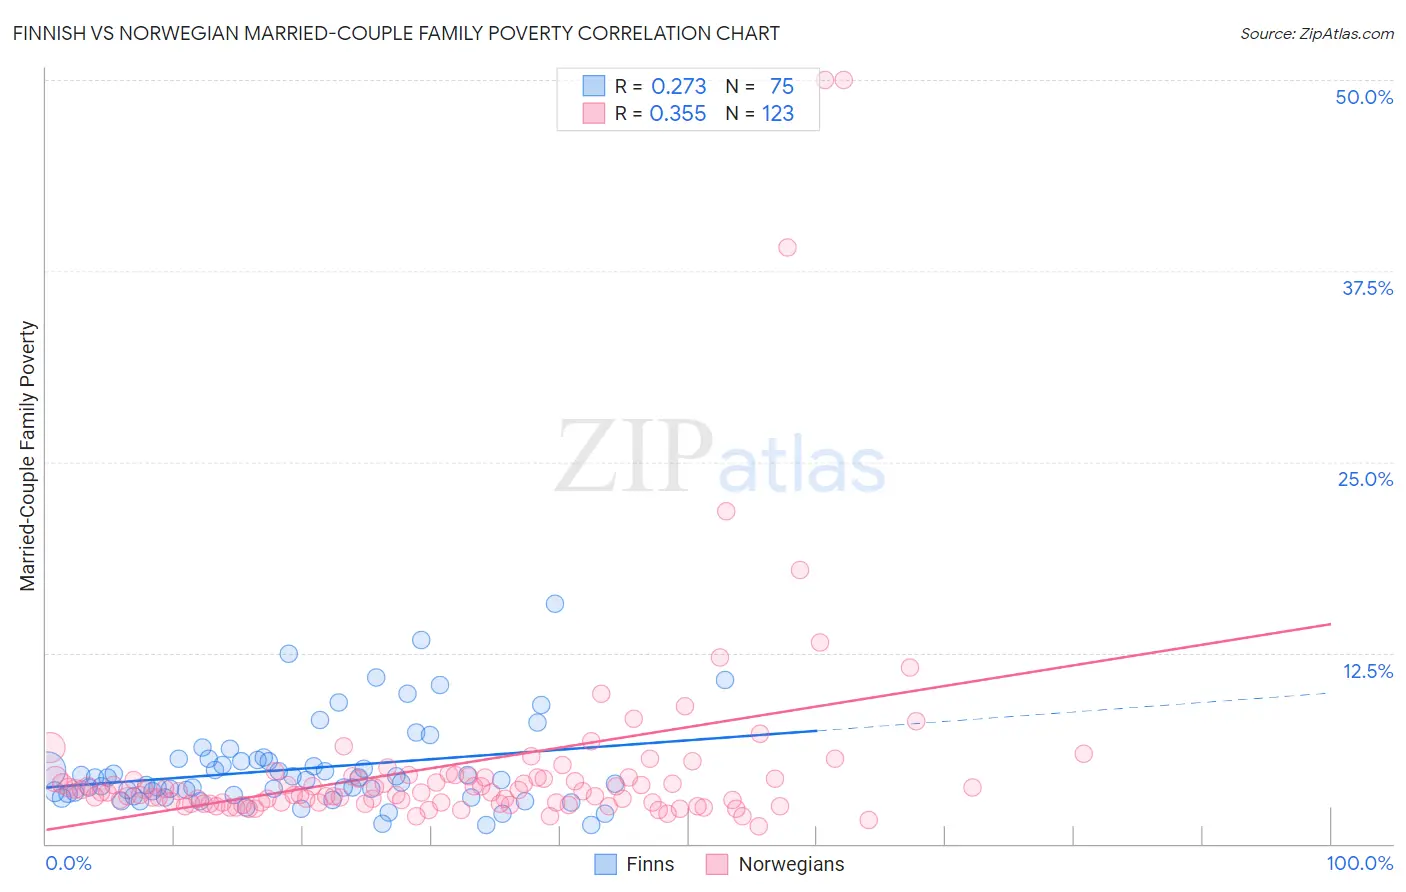
Finnish vs Norwegian Married-Couple Family Poverty Correlation Chart
The statistical analysis conducted on geographies consisting of 399,709,206 people shows a weak positive correlation between the proportion of Finns and poverty level among married-couple families in the United States with a correlation coefficient (R) of 0.273 and weighted average of 4.2%. Similarly, the statistical analysis conducted on geographies consisting of 522,229,251 people shows a mild positive correlation between the proportion of Norwegians and poverty level among married-couple families in the United States with a correlation coefficient (R) of 0.355 and weighted average of 3.7%, a difference of 12.0%.
Married-Couple Family Poverty Correlation Summary
| Measurement | Finnish | Norwegian |
| Minimum | 1.2% | 1.2% |
| Maximum | 15.7% | 50.0% |
| Range | 14.5% | 48.8% |
| Mean | 4.9% | 5.1% |
| Median | 4.1% | 3.4% |
| Interquartile 25% (IQ1) | 3.2% | 2.7% |
| Interquartile 75% (IQ3) | 5.5% | 4.4% |
| Interquartile Range (IQR) | 2.3% | 1.7% |
| Standard Deviation (Sample) | 2.8% | 7.2% |
| Standard Deviation (Population) | 2.8% | 7.1% |
Similar Demographics by Married-Couple Family Poverty
Demographics Similar to Finns by Married-Couple Family Poverty
In terms of married-couple family poverty, the demographic groups most similar to Finns are Estonian (4.2%, a difference of 0.080%), Greek (4.2%, a difference of 0.19%), Immigrants from Scotland (4.2%, a difference of 0.24%), Scandinavian (4.1%, a difference of 0.28%), and Danish (4.1%, a difference of 0.39%).
| Demographics | Rating | Rank | Married-Couple Family Poverty |
| Bhutanese | 99.9 /100 | #23 | Exceptional 4.1% |
| Eastern Europeans | 99.9 /100 | #24 | Exceptional 4.1% |
| Immigrants | Taiwan | 99.9 /100 | #25 | Exceptional 4.1% |
| Cypriots | 99.9 /100 | #26 | Exceptional 4.1% |
| Danes | 99.9 /100 | #27 | Exceptional 4.1% |
| Scandinavians | 99.9 /100 | #28 | Exceptional 4.1% |
| Immigrants | Scotland | 99.9 /100 | #29 | Exceptional 4.2% |
| Finns | 99.9 /100 | #30 | Exceptional 4.2% |
| Estonians | 99.9 /100 | #31 | Exceptional 4.2% |
| Greeks | 99.9 /100 | #32 | Exceptional 4.2% |
| Irish | 99.9 /100 | #33 | Exceptional 4.2% |
| Dutch | 99.9 /100 | #34 | Exceptional 4.2% |
| Europeans | 99.9 /100 | #35 | Exceptional 4.2% |
| English | 99.9 /100 | #36 | Exceptional 4.2% |
| Iranians | 99.9 /100 | #37 | Exceptional 4.2% |
Demographics Similar to Norwegians by Married-Couple Family Poverty
In terms of married-couple family poverty, the demographic groups most similar to Norwegians are Chinese (3.6%, a difference of 1.9%), Immigrants from India (3.6%, a difference of 2.1%), Slovene (3.8%, a difference of 3.6%), Swedish (3.9%, a difference of 3.8%), and Luxembourger (3.9%, a difference of 4.4%).
| Demographics | Rating | Rank | Married-Couple Family Poverty |
| Immigrants | India | 100.0 /100 | #1 | Exceptional 3.6% |
| Chinese | 100.0 /100 | #2 | Exceptional 3.6% |
| Norwegians | 100.0 /100 | #3 | Exceptional 3.7% |
| Slovenes | 100.0 /100 | #4 | Exceptional 3.8% |
| Swedes | 100.0 /100 | #5 | Exceptional 3.9% |
| Luxembourgers | 100.0 /100 | #6 | Exceptional 3.9% |
| Latvians | 100.0 /100 | #7 | Exceptional 3.9% |
| Thais | 100.0 /100 | #8 | Exceptional 3.9% |
| Croatians | 100.0 /100 | #9 | Exceptional 3.9% |
| Carpatho Rusyns | 100.0 /100 | #10 | Exceptional 3.9% |
| Lithuanians | 100.0 /100 | #11 | Exceptional 4.0% |
| Bulgarians | 100.0 /100 | #12 | Exceptional 4.0% |
| Czechs | 100.0 /100 | #13 | Exceptional 4.0% |
| Slovaks | 100.0 /100 | #14 | Exceptional 4.0% |
| Poles | 100.0 /100 | #15 | Exceptional 4.0% |