Finnish Disability Age Under 5
COMPARE
Finnish
Select to Compare
Disability Age Under 5
Finnish Disability Age Under 5
1.6%
DISABILITY | AGE UNDER 5
0.0/ 100
METRIC RATING
295th/ 347
METRIC RANK
Finnish Disability Age Under 5 Correlation Chart
The statistical analysis conducted on geographies consisting of 211,536,614 people shows a significant positive correlation between the proportion of Finns and percentage of population with a disability under the age of 5 in the United States with a correlation coefficient (R) of 0.667 and weighted average of 1.6%. On average, for every 1% (one percent) increase in Finns within a typical geography, there is an increase of 0.61% in percentage of population with a disability under the age of 5.
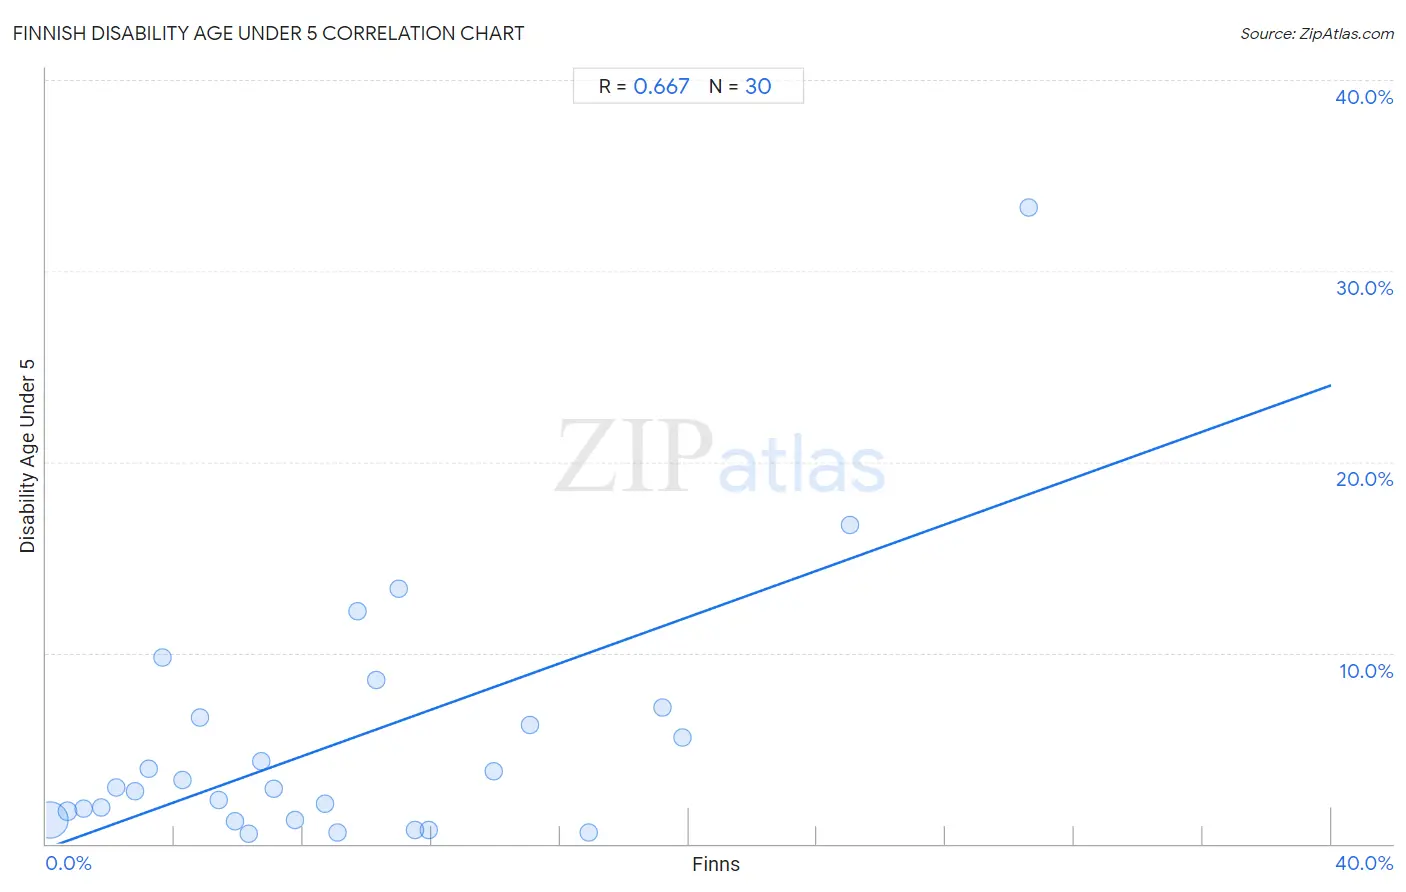
It is essential to understand that the correlation between the percentage of Finns and percentage of population with a disability under the age of 5 does not imply a direct cause-and-effect relationship. It remains uncertain whether the presence of Finns influences an upward or downward trend in the level of percentage of population with a disability under the age of 5 within an area, or if Finns simply ended up residing in those areas with higher or lower levels of percentage of population with a disability under the age of 5 due to other factors.
Demographics Similar to Finns by Disability Age Under 5
In terms of disability age under 5, the demographic groups most similar to Finns are Polish (1.6%, a difference of 0.080%), Swedish (1.6%, a difference of 0.62%), Nonimmigrants (1.6%, a difference of 1.0%), Cajun (1.6%, a difference of 1.0%), and Portuguese (1.6%, a difference of 1.6%).
| Demographics | Rating | Rank | Disability Age Under 5 |
| Estonians | 0.0 /100 | #288 | Tragic 1.5% |
| Hungarians | 0.0 /100 | #289 | Tragic 1.5% |
| Czechs | 0.0 /100 | #290 | Tragic 1.5% |
| Northern Europeans | 0.0 /100 | #291 | Tragic 1.6% |
| Italians | 0.0 /100 | #292 | Tragic 1.6% |
| Lithuanians | 0.0 /100 | #293 | Tragic 1.6% |
| Swedes | 0.0 /100 | #294 | Tragic 1.6% |
| Finns | 0.0 /100 | #295 | Tragic 1.6% |
| Poles | 0.0 /100 | #296 | Tragic 1.6% |
| Nonimmigrants | 0.0 /100 | #297 | Tragic 1.6% |
| Cajuns | 0.0 /100 | #298 | Tragic 1.6% |
| Portuguese | 0.0 /100 | #299 | Tragic 1.6% |
| Shoshone | 0.0 /100 | #300 | Tragic 1.6% |
| German Russians | 0.0 /100 | #301 | Tragic 1.6% |
| Welsh | 0.0 /100 | #302 | Tragic 1.6% |
Finnish Disability Age Under 5 Correlation Summary
| Measurement | Finnish Data | Disability Age Under 5 Data |
| Minimum | 0.12% | 0.51% |
| Maximum | 30.6% | 33.3% |
| Range | 30.5% | 32.8% |
| Mean | 9.2% | 5.3% |
| Median | 7.4% | 2.9% |
| Interquartile 25% (IQ1) | 3.6% | 1.3% |
| Interquartile 75% (IQ3) | 11.9% | 6.6% |
| Interquartile Range (IQR) | 8.3% | 5.4% |
| Standard Deviation (Sample) | 7.4% | 6.7% |
| Standard Deviation (Population) | 7.3% | 6.6% |
Correlation Details
| Finnish Percentile | Sample Size | Disability Age Under 5 |
[ 0.0% - 0.5% ] 0.12% | 194,201,113 | 1.2% |
[ 0.5% - 1.0% ] 0.67% | 12,976,646 | 1.7% |
[ 1.0% - 1.5% ] 1.17% | 2,810,297 | 1.8% |
[ 1.5% - 2.0% ] 1.71% | 716,450 | 1.9% |
[ 2.0% - 2.5% ] 2.16% | 169,825 | 2.9% |
[ 2.5% - 3.0% ] 2.76% | 104,282 | 2.7% |
[ 3.0% - 3.5% ] 3.19% | 140,290 | 3.9% |
[ 3.5% - 4.0% ] 3.61% | 17,960 | 9.8% |
[ 4.0% - 4.5% ] 4.22% | 83,930 | 3.3% |
[ 4.5% - 5.0% ] 4.80% | 20,980 | 6.6% |
[ 5.0% - 5.5% ] 5.39% | 16,465 | 2.3% |
[ 5.5% - 6.0% ] 5.87% | 35,432 | 1.2% |
[ 6.0% - 6.5% ] 6.29% | 87,667 | 0.51% |
[ 6.5% - 7.0% ] 6.71% | 18,670 | 4.3% |
[ 7.0% - 7.5% ] 7.09% | 17,355 | 2.9% |
[ 7.5% - 8.0% ] 7.74% | 2,984 | 1.3% |
[ 8.5% - 9.0% ] 8.67% | 21,897 | 2.1% |
[ 9.0% - 9.5% ] 9.08% | 16,867 | 0.60% |
[ 9.5% - 10.0% ] 9.67% | 972 | 12.2% |
[ 10.0% - 10.5% ] 10.26% | 5,670 | 8.6% |
[ 10.5% - 11.0% ] 10.99% | 91 | 13.3% |
[ 11.0% - 11.5% ] 11.49% | 16,167 | 0.75% |
[ 11.5% - 12.0% ] 11.92% | 34,474 | 0.74% |
[ 13.5% - 14.0% ] 13.92% | 1,020 | 3.8% |
[ 15.0% - 15.5% ] 15.04% | 226 | 6.2% |
[ 16.5% - 17.0% ] 16.87% | 2,608 | 0.57% |
[ 19.0% - 19.5% ] 19.19% | 12,794 | 7.1% |
[ 19.5% - 20.0% ] 19.79% | 561 | 5.6% |
[ 25.0% - 25.5% ] 25.02% | 2,274 | 16.7% |
[ 30.5% - 31.0% ] 30.60% | 647 | 33.3% |