Chilean GED/Equivalency
COMPARE
Chilean
Select to Compare
GED/Equivalency
Chilean GED/Equivalency
86.6%
GED/EQUIVALENCY
86.9/ 100
METRIC RATING
136th/ 347
METRIC RANK
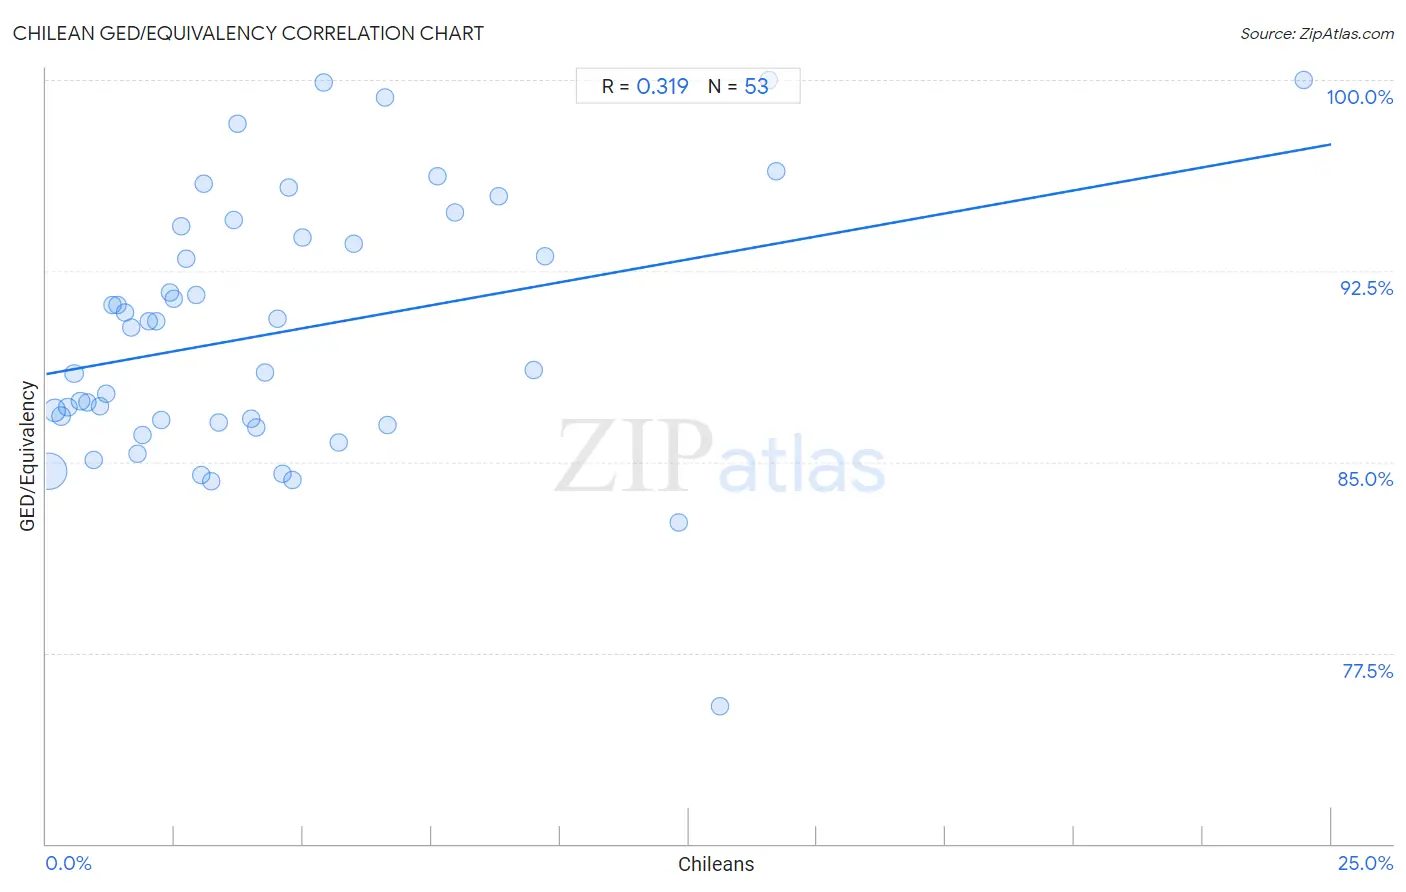
Chilean GED/Equivalency Correlation Chart
The statistical analysis conducted on geographies consisting of 256,681,007 people shows a mild positive correlation between the proportion of Chileans and percentage of population with at least ged/equivalency education in the United States with a correlation coefficient (R) of 0.319 and weighted average of 86.6%. On average, for every 1% (one percent) increase in Chileans within a typical geography, there is an increase of 0.36% in percentage of population with at least ged/equivalency education.
It is essential to understand that the correlation between the percentage of Chileans and percentage of population with at least ged/equivalency education does not imply a direct cause-and-effect relationship. It remains uncertain whether the presence of Chileans influences an upward or downward trend in the level of percentage of population with at least ged/equivalency education within an area, or if Chileans simply ended up residing in those areas with higher or lower levels of percentage of population with at least ged/equivalency education due to other factors.
Demographics Similar to Chileans by GED/Equivalency
In terms of ged/equivalency, the demographic groups most similar to Chileans are Arab (86.6%, a difference of 0.010%), Immigrants from Asia (86.6%, a difference of 0.020%), Immigrants from Argentina (86.6%, a difference of 0.020%), Albanian (86.6%, a difference of 0.040%), and Immigrants from Spain (86.7%, a difference of 0.070%).
| Demographics | Rating | Rank | GED/Equivalency |
| Immigrants from Ukraine | 88.9 /100 | #129 | Excellent 86.7% |
| Immigrants from Germany | 88.8 /100 | #130 | Excellent 86.7% |
| Immigrants from Spain | 88.5 /100 | #131 | Excellent 86.7% |
| Immigrants from Brazil | 88.4 /100 | #132 | Excellent 86.6% |
| Tsimshian | 88.3 /100 | #133 | Excellent 86.6% |
| Albanians | 87.7 /100 | #134 | Excellent 86.6% |
| Immigrants from Asia | 87.4 /100 | #135 | Excellent 86.6% |
| Chileans | 86.9 /100 | #136 | Excellent 86.6% |
| Arabs | 86.7 /100 | #137 | Excellent 86.6% |
| Immigrants from Argentina | 86.5 /100 | #138 | Excellent 86.6% |
| Immigrants from Malaysia | 85.0 /100 | #139 | Excellent 86.5% |
| Paraguayans | 84.1 /100 | #140 | Excellent 86.5% |
| Laotians | 83.2 /100 | #141 | Excellent 86.5% |
| Immigrants from Indonesia | 82.4 /100 | #142 | Excellent 86.4% |
| Immigrants from Pakistan | 82.4 /100 | #143 | Excellent 86.4% |
Chilean GED/Equivalency Correlation Summary
| Measurement | Chilean Data | GED/Equivalency Data |
| Minimum | 0.054% | 75.4% |
| Maximum | 24.5% | 100.0% |
| Range | 24.4% | 24.6% |
| Mean | 4.6% | 90.1% |
| Median | 3.2% | 90.3% |
| Interquartile 25% (IQ1) | 1.6% | 86.5% |
| Interquartile 75% (IQ3) | 5.8% | 94.0% |
| Interquartile Range (IQR) | 4.2% | 7.5% |
| Standard Deviation (Sample) | 4.5% | 5.1% |
| Standard Deviation (Population) | 4.5% | 5.1% |
Correlation Details
| Chilean Percentile | Sample Size | GED/Equivalency |
[ 0.0% - 0.5% ] 0.054% | 182,425,021 | 84.6% |
[ 0.0% - 0.5% ] 0.17% | 41,287,494 | 87.0% |
[ 0.0% - 0.5% ] 0.30% | 15,259,241 | 86.8% |
[ 0.0% - 0.5% ] 0.42% | 6,590,028 | 87.2% |
[ 0.5% - 1.0% ] 0.54% | 3,916,163 | 88.5% |
[ 0.5% - 1.0% ] 0.66% | 2,216,336 | 87.4% |
[ 0.5% - 1.0% ] 0.80% | 1,585,601 | 87.3% |
[ 0.5% - 1.0% ] 0.92% | 1,012,652 | 85.1% |
[ 1.0% - 1.5% ] 1.04% | 672,042 | 87.2% |
[ 1.0% - 1.5% ] 1.16% | 515,327 | 87.7% |
[ 1.0% - 1.5% ] 1.28% | 334,371 | 91.2% |
[ 1.0% - 1.5% ] 1.40% | 131,593 | 91.2% |
[ 1.5% - 2.0% ] 1.53% | 93,560 | 90.9% |
[ 1.5% - 2.0% ] 1.66% | 126,142 | 90.3% |
[ 1.5% - 2.0% ] 1.78% | 87,571 | 85.3% |
[ 1.5% - 2.0% ] 1.88% | 80,991 | 86.1% |
[ 2.0% - 2.5% ] 2.00% | 35,881 | 90.5% |
[ 2.0% - 2.5% ] 2.15% | 21,992 | 90.5% |
[ 2.0% - 2.5% ] 2.24% | 40,477 | 86.6% |
[ 2.0% - 2.5% ] 2.40% | 15,299 | 91.7% |
[ 2.0% - 2.5% ] 2.49% | 10,114 | 91.4% |
[ 2.5% - 3.0% ] 2.62% | 1,907 | 94.3% |
[ 2.5% - 3.0% ] 2.72% | 16,418 | 93.0% |
[ 2.5% - 3.0% ] 2.93% | 9,503 | 91.6% |
[ 3.0% - 3.5% ] 3.01% | 19,160 | 84.5% |
[ 3.0% - 3.5% ] 3.07% | 29,211 | 95.9% |
[ 3.0% - 3.5% ] 3.21% | 8,104 | 84.2% |
[ 3.0% - 3.5% ] 3.35% | 20,448 | 86.6% |
[ 3.5% - 4.0% ] 3.64% | 3,567 | 94.5% |
[ 3.5% - 4.0% ] 3.72% | 3,035 | 98.3% |
[ 3.5% - 4.0% ] 3.98% | 19,917 | 86.7% |
[ 4.0% - 4.5% ] 4.08% | 29,406 | 86.4% |
[ 4.0% - 4.5% ] 4.26% | 2,631 | 88.5% |
[ 4.5% - 5.0% ] 4.50% | 3,620 | 90.6% |
[ 4.5% - 5.0% ] 4.60% | 14,361 | 84.6% |
[ 4.5% - 5.0% ] 4.73% | 3,745 | 95.8% |
[ 4.5% - 5.0% ] 4.80% | 1,104 | 84.3% |
[ 4.5% - 5.0% ] 4.99% | 1,022 | 93.8% |
[ 5.0% - 5.5% ] 5.40% | 1,259 | 99.9% |
[ 5.5% - 6.0% ] 5.68% | 3,943 | 85.7% |
[ 5.5% - 6.0% ] 5.99% | 1,904 | 93.6% |
[ 6.5% - 7.0% ] 6.60% | 985 | 99.3% |
[ 6.5% - 7.0% ] 6.64% | 4,169 | 86.5% |
[ 7.5% - 8.0% ] 7.62% | 8,450 | 96.2% |
[ 7.5% - 8.0% ] 7.95% | 1,622 | 94.8% |
[ 8.5% - 9.0% ] 8.81% | 7,307 | 95.4% |
[ 9.0% - 9.5% ] 9.49% | 2,612 | 88.6% |
[ 9.5% - 10.0% ] 9.70% | 1,732 | 93.1% |
[ 12.0% - 12.5% ] 12.30% | 732 | 82.6% |
[ 13.0% - 13.5% ] 13.11% | 122 | 75.4% |
[ 14.0% - 14.5% ] 14.06% | 64 | 100.0% |
[ 14.0% - 14.5% ] 14.21% | 957 | 96.4% |
[ 24.0% - 24.5% ] 24.47% | 94 | 100.0% |