Chilean 4 or more Vehicles in Household

COMPARE

Chilean
Race
Ancestry
AfghanAfricanAlaska NativeAlaskan AthabascanAlbanianAleutAlsatianAmericanApacheArabArapahoArgentineanArmenianAssyrian/Chaldean/SyriacAustralianAustrianBahamianBangladeshiBarbadianBasqueBelgianBelizeanBermudanBhutaneseBlackfeetBolivianBrazilianBritishBritish West IndianBulgarianBurmeseCajunCambodianCanadianCape VerdeanCarpatho RusynCelticCentral AmericanCentral American IndianCherokeeCheyenneChickasawChileanChineseChippewaChoctawColombianColvilleComancheCosta RicanCreeCreekCroatianCrowCubanCypriotCzechCzechoslovakianDanishDelawareDominicanDutchDutch West IndianEastern EuropeanEcuadorianEgyptianEnglishEstonianEthiopianEuropeanFijianFilipinoFinnishFrenchFrench American IndianFrench CanadianGermanGerman RussianGhanaianGreekGuamanian/ChamorroGuatemalanGuyaneseHaitianHmongHonduranHopiHoumaHungarianIcelanderIndian (Asian)IndonesianInupiatIranianIraqiIrishIroquoisIsraeliItalianJamaicanJapaneseJordanianKenyanKiowaKoreanLaotianLatvianLebaneseLiberianLithuanianLumbeeLuxembourgerMacedonianMalaysianMalteseMarshalleseMenomineeMexicanMexican American IndianMongolianMoroccanNative HawaiianNavajoNepaleseNew ZealanderNicaraguanNigerianNorthern EuropeanNorwegianOkinawanOsageOttawaPaiutePakistaniPalestinianPanamanianParaguayanPennsylvania GermanPeruvianPimaPolishPortuguesePotawatomiPuebloPuerto RicanPuget Sound SalishRomanianRussianSalvadoranSamoanScandinavianScotch-IrishScottishSeminoleSenegaleseSerbianShoshoneSierra LeoneanSiouxSlavicSlovakSloveneSomaliSouth AfricanSouth AmericanSouth American IndianSoviet UnionSpaniardSpanishSpanish AmericanSpanish American IndianSri LankanSubsaharan AfricanSudaneseSwedishSwissSyrianTaiwaneseThaiTlingit-HaidaTohono O'OdhamTonganTrinidadian and TobagonianTsimshianTurkishU.S. Virgin IslanderUgandanUkrainianUruguayanUteVenezuelanVietnameseWelshWest IndianYakamaYaquiYugoslavianYumanYup'ikZimbabwean
Immigration
NonimmigrantsImmigrantsAfghanistanAfricaAlbaniaArgentinaArmeniaAsiaAustraliaAustriaBahamasBangladeshBarbadosBelarusBelgiumBelizeBoliviaBosnia and HerzegovinaBrazilBulgariaBurma/MyanmarCabo VerdeCambodiaCameroonCanadaCaribbeanCentral AmericaChileChinaColombiaCongoCosta RicaCroatiaCubaCzechoslovakiaDenmarkDominicaDominican RepublicEastern AfricaEastern AsiaEastern EuropeEcuadorEgyptEl SalvadorEnglandEritreaEthiopiaEuropeFijiFranceGermanyGhanaGreeceGrenadaGuatemalaGuyanaHaitiHondurasHong KongHungaryIndiaIndonesiaIranIraqIrelandIsraelItalyJamaicaJapanJordanKazakhstanKenyaKoreaKuwaitLaosLatin AmericaLatviaLebanonLiberiaLithuaniaMalaysiaMexicoMicronesiaMiddle AfricaMoldovaMoroccoNepalNetherlandsNicaraguaNigeriaNorth AmericaNorth MacedoniaNorthern AfricaNorthern EuropeNorwayOceaniaPakistanPanamaPeruPhilippinesPolandPortugalRomaniaRussiaSaudi ArabiaScotlandSenegalSerbiaSierra LeoneSingaporeSomaliaSouth AfricaSouth AmericaSouth Central AsiaSouth Eastern AsiaSouthern EuropeSpainSri LankaSt. Vincent and the GrenadinesSudanSwedenSwitzerlandSyriaTaiwanThailandTrinidad and TobagoTurkeyUgandaUkraineUruguayUzbekistanVenezuelaVietnamWest IndiesWestern AfricaWestern AsiaWestern EuropeYemenZaireZimbabweAzores
Select to Compare
Race
Ancestry
AfghanAfricanAlaska NativeAlaskan AthabascanAlbanianAleutAlsatianAmericanApacheArabArapahoArgentineanArmenianAssyrian/Chaldean/SyriacAustralianAustrianBahamianBangladeshiBarbadianBasqueBelgianBelizeanBermudanBhutaneseBlackfeetBolivianBrazilianBritishBritish West IndianBulgarianBurmeseCajunCambodianCanadianCape VerdeanCarpatho RusynCelticCentral AmericanCentral American IndianCherokeeCheyenneChickasawChineseChippewaChoctawColombianColvilleComancheCosta RicanCreeCreekCroatianCrowCubanCypriotCzechCzechoslovakianDanishDelawareDominicanDutchDutch West IndianEastern EuropeanEcuadorianEgyptianEnglishEstonianEthiopianEuropeanFijianFilipinoFinnishFrenchFrench American IndianFrench CanadianGermanGerman RussianGhanaianGreekGuamanian/ChamorroGuatemalanGuyaneseHaitianHmongHonduranHopiHoumaHungarianIcelanderIndian (Asian)IndonesianInupiatIranianIraqiIrishIroquoisIsraeliItalianJamaicanJapaneseJordanianKenyanKiowaKoreanLaotianLatvianLebaneseLiberianLithuanianLumbeeLuxembourgerMacedonianMalaysianMalteseMarshalleseMenomineeMexicanMexican American IndianMongolianMoroccanNative HawaiianNavajoNepaleseNew ZealanderNicaraguanNigerianNorthern EuropeanNorwegianOkinawanOsageOttawaPaiutePakistaniPalestinianPanamanianParaguayanPennsylvania GermanPeruvianPimaPolishPortuguesePotawatomiPuebloPuerto RicanPuget Sound SalishRomanianRussianSalvadoranSamoanScandinavianScotch-IrishScottishSeminoleSenegaleseSerbianShoshoneSierra LeoneanSiouxSlavicSlovakSloveneSomaliSouth AfricanSouth AmericanSouth American IndianSoviet UnionSpaniardSpanishSpanish AmericanSpanish American IndianSri LankanSubsaharan AfricanSudaneseSwedishSwissSyrianTaiwaneseThaiTlingit-HaidaTohono O'OdhamTonganTrinidadian and TobagonianTsimshianTurkishU.S. Virgin IslanderUgandanUkrainianUruguayanUteVenezuelanVietnameseWelshWest IndianYakamaYaquiYugoslavianYumanYup'ikZimbabwean
Immigration
NonimmigrantsImmigrantsAfghanistanAfricaAlbaniaArgentinaArmeniaAsiaAustraliaAustriaBahamasBangladeshBarbadosBelarusBelgiumBelizeBoliviaBosnia and HerzegovinaBrazilBulgariaBurma/MyanmarCabo VerdeCambodiaCameroonCanadaCaribbeanCentral AmericaChileChinaColombiaCongoCosta RicaCroatiaCubaCzechoslovakiaDenmarkDominicaDominican RepublicEastern AfricaEastern AsiaEastern EuropeEcuadorEgyptEl SalvadorEnglandEritreaEthiopiaEuropeFijiFranceGermanyGhanaGreeceGrenadaGuatemalaGuyanaHaitiHondurasHong KongHungaryIndiaIndonesiaIranIraqIrelandIsraelItalyJamaicaJapanJordanKazakhstanKenyaKoreaKuwaitLaosLatin AmericaLatviaLebanonLiberiaLithuaniaMalaysiaMexicoMicronesiaMiddle AfricaMoldovaMoroccoNepalNetherlandsNicaraguaNigeriaNorth AmericaNorth MacedoniaNorthern AfricaNorthern EuropeNorwayOceaniaPakistanPanamaPeruPhilippinesPolandPortugalRomaniaRussiaSaudi ArabiaScotlandSenegalSerbiaSierra LeoneSingaporeSomaliaSouth AfricaSouth AmericaSouth Central AsiaSouth Eastern AsiaSouthern EuropeSpainSri LankaSt. Vincent and the GrenadinesSudanSwedenSwitzerlandSyriaTaiwanThailandTrinidad and TobagoTurkeyUgandaUkraineUruguayUzbekistanVenezuelaVietnamWest IndiesWestern AfricaWestern AsiaWestern EuropeYemenZaireZimbabweAzores
4 or more Vehicles in Household
Income
Poverty
Unemployment
Labor Participation
Family Structure
Vehicle Availability
Education Level
Disability

Chilean 4 or more Vehicles in Household
Good

6.4%
4+ VEHICLES AVAILABLE
61.2/ 100
METRIC RATING
163rd/ 347
METRIC RANK

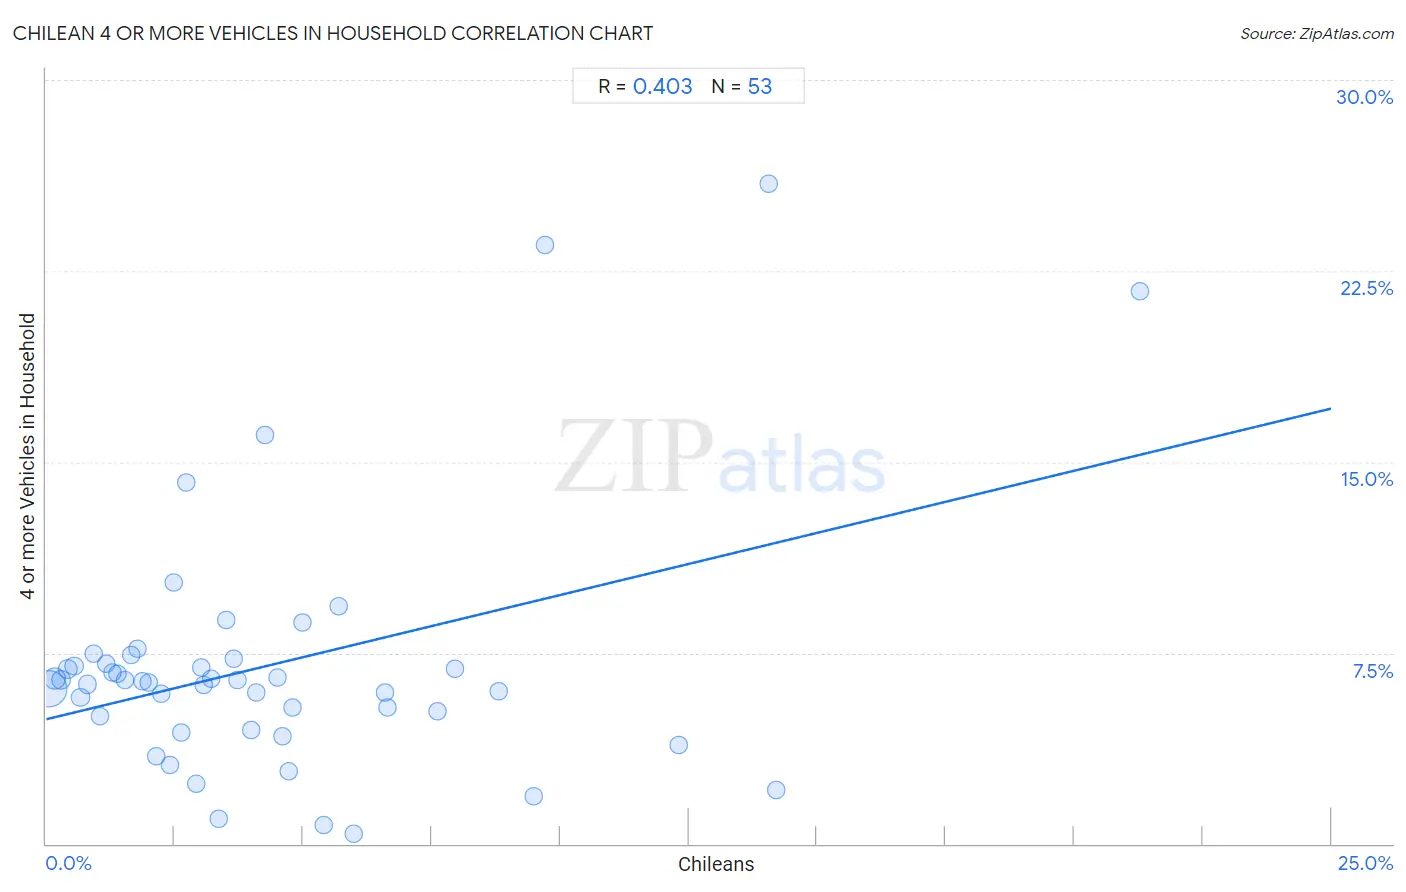
Chilean 4 or more Vehicles in Household Correlation Chart

The statistical analysis conducted on geographies consisting of 255,549,782 people shows a moderate positive correlation between the proportion of Chileans and percentage of households with 4 or more vehicles available in the United States with a correlation coefficient (R) of 0.403 and weighted average of 6.4%. On average, for every 1% (one percent) increase in Chileans within a typical geography, there is an increase of 0.49% in percentage of households with 4 or more vehicles available.
Chilean 4 or more Vehicles in Household
It is essential to understand that the correlation between the percentage of Chileans and percentage of households with 4 or more vehicles available does not imply a direct cause-and-effect relationship. It remains uncertain whether the presence of Chileans influences an upward or downward trend in the level of percentage of households with 4 or more vehicles available within an area, or if Chileans simply ended up residing in those areas with higher or lower levels of percentage of households with 4 or more vehicles available due to other factors.

Demographics Similar to Chileans by 4 or more Vehicles in Household

In terms of 4 or more vehicles in household, the demographic groups most similar to Chileans are Hungarian (6.4%, a difference of 0.010%), Immigrants from Peru (6.4%, a difference of 0.14%), Immigrants from Pakistan (6.4%, a difference of 0.22%), Immigrants from Cameroon (6.4%, a difference of 0.34%), and Immigrants from Denmark (6.4%, a difference of 0.35%).
DemographicsRating | Rank4 or more Vehicles in Household
Iranians
69.9
/100
|
#156
Good
6.5%
Peruvians
69.4
/100
|
#157
Good
6.5%
Zimbabweans
67.1
/100
|
#158
Good
6.4%
Indians (Asian)
66.3
/100
|
#159
Good
6.4%
Palestinians
65.8
/100
|
#160
Good
6.4%
Immigrants from Cameroon
64.4
/100
|
#161
Good
6.4%
Immigrants from Pakistan
63.2
/100
|
#162
Good
6.4%
Chileans
61.2
/100
|
#163
Good
6.4%
Hungarians
61.1
/100
|
#164
Good
6.4%
Immigrants from Peru
59.8
/100
|
#165
Average
6.4%
Immigrants from Denmark
57.8
/100
|
#166
Average
6.4%
Poles
56.9
/100
|
#167
Average
6.4%
Lebanese
55.8
/100
|
#168
Average
6.4%
Estonians
55.1
/100
|
#169
Average
6.4%
Immigrants from Syria
52.8
/100
|
#170
Average
6.3%

Chilean 4 or more Vehicles in Household Correlation Summary

MeasurementChilean Data4 or more Vehicles in Household Data
Minimum0.054%0.37%
Maximum21.3%25.9%
Range21.2%25.6%
Mean4.3%7.0%
Median3.2%6.4%
Interquartile 25% (IQ1)1.6%4.8%
Interquartile 75% (IQ3)5.5%7.2%
Interquartile Range (IQR)3.9%2.4%
Standard Deviation (Sample)4.1%5.0%
Standard Deviation (Population)4.1%4.9%

Correlation Details

Chilean PercentileSample Size4 or more Vehicles in Household
[
0.0%
-
0.5%
]
0.054%
181,938,1986.1%
[
0.0%
-
0.5%
]
0.17%
40,872,6566.5%
[
0.0%
-
0.5%
]
0.30%
15,215,4466.5%
[
0.0%
-
0.5%
]
0.42%
6,540,5166.9%
[
0.5%
-
1.0%
]
0.55%
3,878,2677.0%
[
0.5%
-
1.0%
]
0.67%
2,165,7875.7%
[
0.5%
-
1.0%
]
0.80%
1,576,6226.3%
[
0.5%
-
1.0%
]
0.92%
989,4957.4%
[
1.0%
-
1.5%
]
1.04%
667,5395.0%
[
1.0%
-
1.5%
]
1.16%
514,5677.1%
[
1.0%
-
1.5%
]
1.28%
332,8786.7%
[
1.0%
-
1.5%
]
1.40%
131,5936.7%
[
1.5%
-
2.0%
]
1.53%
93,5606.4%
[
1.5%
-
2.0%
]
1.66%
126,1427.4%
[
1.5%
-
2.0%
]
1.78%
84,2537.7%
[
1.5%
-
2.0%
]
1.88%
80,4706.4%
[
2.0%
-
2.5%
]
2.00%
35,8816.3%
[
2.0%
-
2.5%
]
2.15%
21,9923.4%
[
2.0%
-
2.5%
]
2.24%
40,4775.9%
[
2.0%
-
2.5%
]
2.40%
15,2993.1%
[
2.0%
-
2.5%
]
2.49%
10,11410.3%
[
2.5%
-
3.0%
]
2.62%
1,9074.4%
[
2.5%
-
3.0%
]
2.71%
14,63614.2%
[
2.5%
-
3.0%
]
2.93%
9,5032.3%
[
3.0%
-
3.5%
]
3.01%
19,1606.9%
[
3.0%
-
3.5%
]
3.07%
29,2116.2%
[
3.0%
-
3.5%
]
3.21%
8,1046.5%
[
3.0%
-
3.5%
]
3.35%
20,4480.98%
[
3.0%
-
3.5%
]
3.50%
2,5738.8%
[
3.5%
-
4.0%
]
3.64%
3,5677.3%
[
3.5%
-
4.0%
]
3.72%
3,0356.4%
[
3.5%
-
4.0%
]
3.98%
19,9174.5%
[
4.0%
-
4.5%
]
4.09%
24,0005.9%
[
4.0%
-
4.5%
]
4.26%
2,34616.0%
[
4.5%
-
5.0%
]
4.50%
3,6206.5%
[
4.5%
-
5.0%
]
4.60%
14,3614.2%
[
4.5%
-
5.0%
]
4.73%
3,7452.9%
[
4.5%
-
5.0%
]
4.80%
1,1045.3%
[
4.5%
-
5.0%
]
4.99%
1,0228.7%
[
5.0%
-
5.5%
]
5.40%
5370.72%
[
5.5%
-
6.0%
]
5.68%
3,9439.3%
[
5.5%
-
6.0%
]
5.99%
1,9040.37%
[
6.5%
-
7.0%
]
6.60%
9855.9%
[
6.5%
-
7.0%
]
6.64%
4,1695.3%
[
7.5%
-
8.0%
]
7.62%
8,4505.2%
[
7.5%
-
8.0%
]
7.95%
1,6226.9%
[
8.5%
-
9.0%
]
8.81%
7,3076.0%
[
9.0%
-
9.5%
]
9.49%
2,6121.8%
[
9.5%
-
10.0%
]
9.70%
1,73223.5%
[
12.0%
-
12.5%
]
12.30%
7323.9%
[
14.0%
-
14.5%
]
14.06%
6425.9%
[
14.0%
-
14.5%
]
14.21%
9572.1%
[
21.0%
-
21.5%
]
21.27%
75721.7%