Chilean 1 or more Vehicles in Household

COMPARE

Chilean
Race
Ancestry
AfghanAfricanAlaska NativeAlaskan AthabascanAlbanianAleutAlsatianAmericanApacheArabArapahoArgentineanArmenianAssyrian/Chaldean/SyriacAustralianAustrianBahamianBangladeshiBarbadianBasqueBelgianBelizeanBermudanBhutaneseBlackfeetBolivianBrazilianBritishBritish West IndianBulgarianBurmeseCajunCambodianCanadianCape VerdeanCarpatho RusynCelticCentral AmericanCentral American IndianCherokeeCheyenneChickasawChileanChineseChippewaChoctawColombianColvilleComancheCosta RicanCreeCreekCroatianCrowCubanCypriotCzechCzechoslovakianDanishDelawareDominicanDutchDutch West IndianEastern EuropeanEcuadorianEgyptianEnglishEstonianEthiopianEuropeanFijianFilipinoFinnishFrenchFrench American IndianFrench CanadianGermanGerman RussianGhanaianGreekGuamanian/ChamorroGuatemalanGuyaneseHaitianHmongHonduranHopiHoumaHungarianIcelanderIndian (Asian)IndonesianInupiatIranianIraqiIrishIroquoisIsraeliItalianJamaicanJapaneseJordanianKenyanKiowaKoreanLaotianLatvianLebaneseLiberianLithuanianLumbeeLuxembourgerMacedonianMalaysianMalteseMarshalleseMenomineeMexicanMexican American IndianMongolianMoroccanNative HawaiianNavajoNepaleseNew ZealanderNicaraguanNigerianNorthern EuropeanNorwegianOkinawanOsageOttawaPaiutePakistaniPalestinianPanamanianParaguayanPennsylvania GermanPeruvianPimaPolishPortuguesePotawatomiPuebloPuerto RicanPuget Sound SalishRomanianRussianSalvadoranSamoanScandinavianScotch-IrishScottishSeminoleSenegaleseSerbianShoshoneSierra LeoneanSiouxSlavicSlovakSloveneSomaliSouth AfricanSouth AmericanSouth American IndianSoviet UnionSpaniardSpanishSpanish AmericanSpanish American IndianSri LankanSubsaharan AfricanSudaneseSwedishSwissSyrianTaiwaneseThaiTlingit-HaidaTohono O'OdhamTonganTrinidadian and TobagonianTsimshianTurkishU.S. Virgin IslanderUgandanUkrainianUruguayanUteVenezuelanVietnameseWelshWest IndianYakamaYaquiYugoslavianYumanYup'ikZimbabwean
Immigration
NonimmigrantsImmigrantsAfghanistanAfricaAlbaniaArgentinaArmeniaAsiaAustraliaAustriaBahamasBangladeshBarbadosBelarusBelgiumBelizeBoliviaBosnia and HerzegovinaBrazilBulgariaBurma/MyanmarCabo VerdeCambodiaCameroonCanadaCaribbeanCentral AmericaChileChinaColombiaCongoCosta RicaCroatiaCubaCzechoslovakiaDenmarkDominicaDominican RepublicEastern AfricaEastern AsiaEastern EuropeEcuadorEgyptEl SalvadorEnglandEritreaEthiopiaEuropeFijiFranceGermanyGhanaGreeceGrenadaGuatemalaGuyanaHaitiHondurasHong KongHungaryIndiaIndonesiaIranIraqIrelandIsraelItalyJamaicaJapanJordanKazakhstanKenyaKoreaKuwaitLaosLatin AmericaLatviaLebanonLiberiaLithuaniaMalaysiaMexicoMicronesiaMiddle AfricaMoldovaMoroccoNepalNetherlandsNicaraguaNigeriaNorth AmericaNorth MacedoniaNorthern AfricaNorthern EuropeNorwayOceaniaPakistanPanamaPeruPhilippinesPolandPortugalRomaniaRussiaSaudi ArabiaScotlandSenegalSerbiaSierra LeoneSingaporeSomaliaSouth AfricaSouth AmericaSouth Central AsiaSouth Eastern AsiaSouthern EuropeSpainSri LankaSt. Vincent and the GrenadinesSudanSwedenSwitzerlandSyriaTaiwanThailandTrinidad and TobagoTurkeyUgandaUkraineUruguayUzbekistanVenezuelaVietnamWest IndiesWestern AfricaWestern AsiaWestern EuropeYemenZaireZimbabweAzores
Select to Compare
Race
Ancestry
AfghanAfricanAlaska NativeAlaskan AthabascanAlbanianAleutAlsatianAmericanApacheArabArapahoArgentineanArmenianAssyrian/Chaldean/SyriacAustralianAustrianBahamianBangladeshiBarbadianBasqueBelgianBelizeanBermudanBhutaneseBlackfeetBolivianBrazilianBritishBritish West IndianBulgarianBurmeseCajunCambodianCanadianCape VerdeanCarpatho RusynCelticCentral AmericanCentral American IndianCherokeeCheyenneChickasawChineseChippewaChoctawColombianColvilleComancheCosta RicanCreeCreekCroatianCrowCubanCypriotCzechCzechoslovakianDanishDelawareDominicanDutchDutch West IndianEastern EuropeanEcuadorianEgyptianEnglishEstonianEthiopianEuropeanFijianFilipinoFinnishFrenchFrench American IndianFrench CanadianGermanGerman RussianGhanaianGreekGuamanian/ChamorroGuatemalanGuyaneseHaitianHmongHonduranHopiHoumaHungarianIcelanderIndian (Asian)IndonesianInupiatIranianIraqiIrishIroquoisIsraeliItalianJamaicanJapaneseJordanianKenyanKiowaKoreanLaotianLatvianLebaneseLiberianLithuanianLumbeeLuxembourgerMacedonianMalaysianMalteseMarshalleseMenomineeMexicanMexican American IndianMongolianMoroccanNative HawaiianNavajoNepaleseNew ZealanderNicaraguanNigerianNorthern EuropeanNorwegianOkinawanOsageOttawaPaiutePakistaniPalestinianPanamanianParaguayanPennsylvania GermanPeruvianPimaPolishPortuguesePotawatomiPuebloPuerto RicanPuget Sound SalishRomanianRussianSalvadoranSamoanScandinavianScotch-IrishScottishSeminoleSenegaleseSerbianShoshoneSierra LeoneanSiouxSlavicSlovakSloveneSomaliSouth AfricanSouth AmericanSouth American IndianSoviet UnionSpaniardSpanishSpanish AmericanSpanish American IndianSri LankanSubsaharan AfricanSudaneseSwedishSwissSyrianTaiwaneseThaiTlingit-HaidaTohono O'OdhamTonganTrinidadian and TobagonianTsimshianTurkishU.S. Virgin IslanderUgandanUkrainianUruguayanUteVenezuelanVietnameseWelshWest IndianYakamaYaquiYugoslavianYumanYup'ikZimbabwean
Immigration
NonimmigrantsImmigrantsAfghanistanAfricaAlbaniaArgentinaArmeniaAsiaAustraliaAustriaBahamasBangladeshBarbadosBelarusBelgiumBelizeBoliviaBosnia and HerzegovinaBrazilBulgariaBurma/MyanmarCabo VerdeCambodiaCameroonCanadaCaribbeanCentral AmericaChileChinaColombiaCongoCosta RicaCroatiaCubaCzechoslovakiaDenmarkDominicaDominican RepublicEastern AfricaEastern AsiaEastern EuropeEcuadorEgyptEl SalvadorEnglandEritreaEthiopiaEuropeFijiFranceGermanyGhanaGreeceGrenadaGuatemalaGuyanaHaitiHondurasHong KongHungaryIndiaIndonesiaIranIraqIrelandIsraelItalyJamaicaJapanJordanKazakhstanKenyaKoreaKuwaitLaosLatin AmericaLatviaLebanonLiberiaLithuaniaMalaysiaMexicoMicronesiaMiddle AfricaMoldovaMoroccoNepalNetherlandsNicaraguaNigeriaNorth AmericaNorth MacedoniaNorthern AfricaNorthern EuropeNorwayOceaniaPakistanPanamaPeruPhilippinesPolandPortugalRomaniaRussiaSaudi ArabiaScotlandSenegalSerbiaSierra LeoneSingaporeSomaliaSouth AfricaSouth AmericaSouth Central AsiaSouth Eastern AsiaSouthern EuropeSpainSri LankaSt. Vincent and the GrenadinesSudanSwedenSwitzerlandSyriaTaiwanThailandTrinidad and TobagoTurkeyUgandaUkraineUruguayUzbekistanVenezuelaVietnamWest IndiesWestern AfricaWestern AsiaWestern EuropeYemenZaireZimbabweAzores
1 or more Vehicles in Household
Income
Poverty
Unemployment
Labor Participation
Family Structure
Vehicle Availability
Education Level
Disability

Chilean 1 or more Vehicles in Household
Good

90.2%
1+ VEHICLES AVAILABLE
79.8/ 100
METRIC RATING
147th/ 347
METRIC RANK

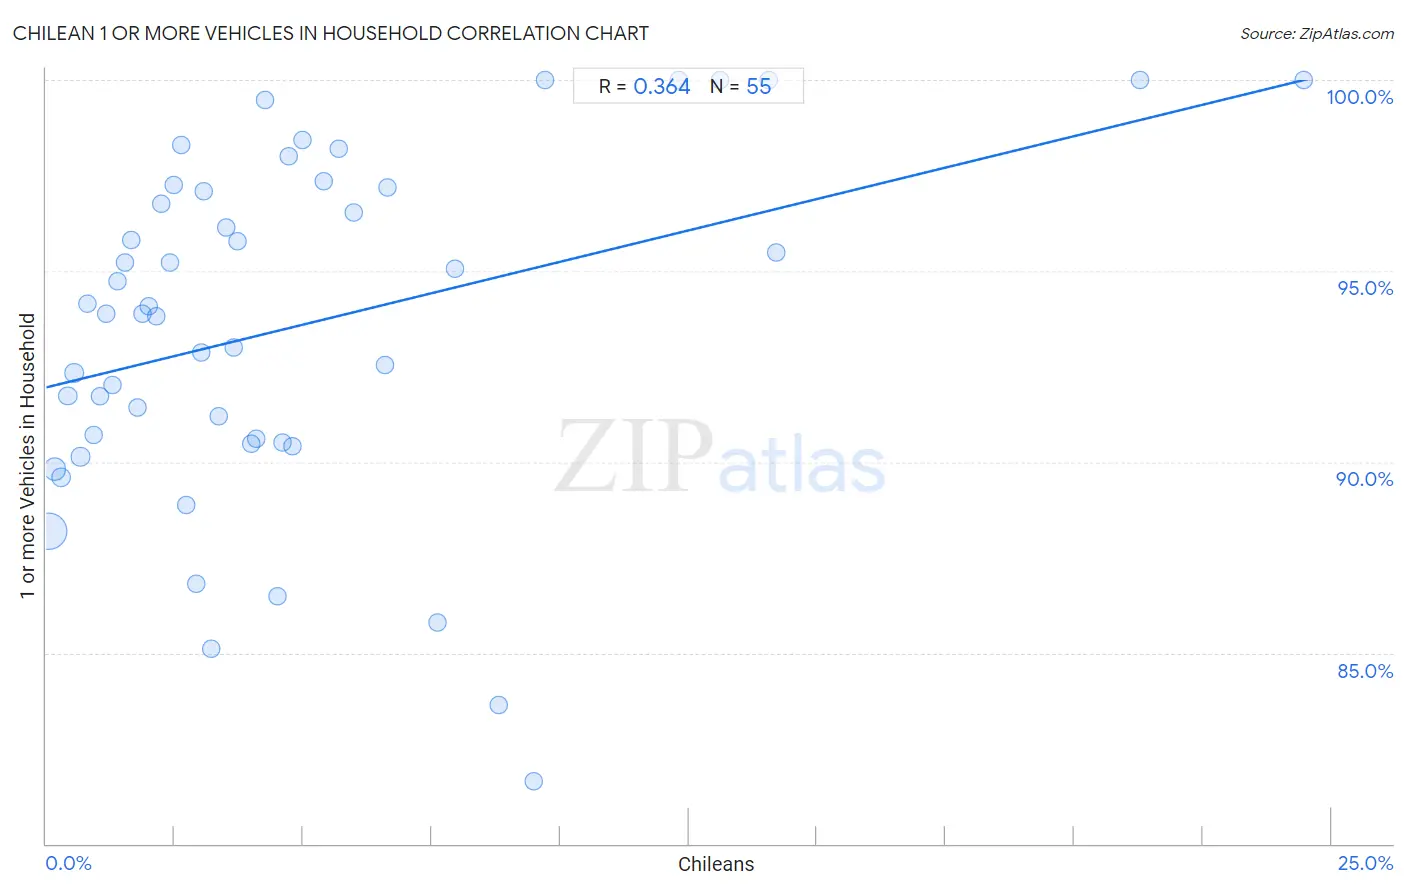
Chilean 1 or more Vehicles in Household Correlation Chart

The statistical analysis conducted on geographies consisting of 256,602,415 people shows a mild positive correlation between the proportion of Chileans and percentage of households with 1 or more vehicles available in the United States with a correlation coefficient (R) of 0.364 and weighted average of 90.2%. On average, for every 1% (one percent) increase in Chileans within a typical geography, there is an increase of 0.33% in percentage of households with 1 or more vehicles available.
Chilean 1 or more Vehicles in Household
It is essential to understand that the correlation between the percentage of Chileans and percentage of households with 1 or more vehicles available does not imply a direct cause-and-effect relationship. It remains uncertain whether the presence of Chileans influences an upward or downward trend in the level of percentage of households with 1 or more vehicles available within an area, or if Chileans simply ended up residing in those areas with higher or lower levels of percentage of households with 1 or more vehicles available due to other factors.

Demographics Similar to Chileans by 1 or more Vehicles in Household

In terms of 1 or more vehicles in household, the demographic groups most similar to Chileans are Bahamian (90.2%, a difference of 0.020%), Immigrants from Bahamas (90.2%, a difference of 0.040%), Immigrants from Zimbabwe (90.2%, a difference of 0.040%), Sioux (90.2%, a difference of 0.040%), and Immigrants from Eastern Africa (90.1%, a difference of 0.040%).
DemographicsRating | Rank1 or more Vehicles in Household
Sudanese
85.2
/100
|
#140
Excellent
90.3%
Immigrants from Moldova
83.1
/100
|
#141
Excellent
90.2%
Immigrants from Lithuania
83.0
/100
|
#142
Excellent
90.2%
Immigrants from Bahamas
81.5
/100
|
#143
Excellent
90.2%
Immigrants from Zimbabwe
81.5
/100
|
#144
Excellent
90.2%
Sioux
81.3
/100
|
#145
Excellent
90.2%
Bahamians
80.5
/100
|
#146
Excellent
90.2%
Chileans
79.8
/100
|
#147
Good
90.2%
Immigrants from Eastern Africa
78.2
/100
|
#148
Good
90.1%
Immigrants from Nicaragua
76.7
/100
|
#149
Good
90.1%
Immigrants from Micronesia
75.9
/100
|
#150
Good
90.1%
Immigrants from Bosnia and Herzegovina
75.4
/100
|
#151
Good
90.1%
Tlingit-Haida
74.3
/100
|
#152
Good
90.1%
New Zealanders
73.8
/100
|
#153
Good
90.1%
Immigrants from Uganda
73.8
/100
|
#154
Good
90.1%

Chilean 1 or more Vehicles in Household Correlation Summary

MeasurementChilean Data1 or more Vehicles in Household Data
Minimum0.054%81.6%
Maximum24.5%100.0%
Range24.4%18.4%
Mean4.9%93.6%
Median3.4%93.9%
Interquartile 25% (IQ1)1.7%90.5%
Interquartile 75% (IQ3)6.0%97.2%
Interquartile Range (IQR)4.3%6.7%
Standard Deviation (Sample)5.0%4.5%
Standard Deviation (Population)4.9%4.5%

Correlation Details

Chilean PercentileSample Size1 or more Vehicles in Household
[
0.0%
-
0.5%
]
0.054%
182,379,21188.2%
[
0.0%
-
0.5%
]
0.17%
41,264,11489.8%
[
0.0%
-
0.5%
]
0.30%
15,256,43489.6%
[
0.0%
-
0.5%
]
0.42%
6,587,67491.7%
[
0.5%
-
1.0%
]
0.54%
3,913,46492.3%
[
0.5%
-
1.0%
]
0.66%
2,215,02690.1%
[
0.5%
-
1.0%
]
0.80%
1,583,32094.2%
[
0.5%
-
1.0%
]
0.92%
1,012,65290.7%
[
1.0%
-
1.5%
]
1.04%
672,04291.7%
[
1.0%
-
1.5%
]
1.16%
514,56793.9%
[
1.0%
-
1.5%
]
1.28%
334,37192.0%
[
1.0%
-
1.5%
]
1.40%
131,59394.7%
[
1.5%
-
2.0%
]
1.53%
93,56095.2%
[
1.5%
-
2.0%
]
1.66%
126,14295.8%
[
1.5%
-
2.0%
]
1.78%
87,57191.4%
[
1.5%
-
2.0%
]
1.88%
80,47093.9%
[
2.0%
-
2.5%
]
2.00%
35,88194.1%
[
2.0%
-
2.5%
]
2.15%
21,99293.8%
[
2.0%
-
2.5%
]
2.24%
40,47796.8%
[
2.0%
-
2.5%
]
2.40%
15,29995.2%
[
2.0%
-
2.5%
]
2.49%
10,11497.2%
[
2.5%
-
3.0%
]
2.62%
1,90798.3%
[
2.5%
-
3.0%
]
2.72%
16,41888.9%
[
2.5%
-
3.0%
]
2.93%
9,50386.8%
[
3.0%
-
3.5%
]
3.01%
19,16092.9%
[
3.0%
-
3.5%
]
3.07%
29,21197.1%
[
3.0%
-
3.5%
]
3.21%
8,10485.1%
[
3.0%
-
3.5%
]
3.35%
20,44891.2%
[
3.0%
-
3.5%
]
3.50%
2,57396.1%
[
3.5%
-
4.0%
]
3.64%
3,56793.0%
[
3.5%
-
4.0%
]
3.72%
3,03595.8%
[
3.5%
-
4.0%
]
3.98%
19,91790.5%
[
4.0%
-
4.5%
]
4.08%
29,40690.6%
[
4.0%
-
4.5%
]
4.26%
2,63199.5%
[
4.5%
-
5.0%
]
4.50%
3,62086.5%
[
4.5%
-
5.0%
]
4.60%
14,36190.5%
[
4.5%
-
5.0%
]
4.73%
3,74598.0%
[
4.5%
-
5.0%
]
4.80%
1,10490.4%
[
4.5%
-
5.0%
]
4.99%
1,02298.4%
[
5.0%
-
5.5%
]
5.40%
1,25997.4%
[
5.5%
-
6.0%
]
5.68%
3,94398.2%
[
5.5%
-
6.0%
]
5.99%
1,90496.5%
[
6.5%
-
7.0%
]
6.60%
98592.5%
[
6.5%
-
7.0%
]
6.64%
4,16997.2%
[
7.5%
-
8.0%
]
7.62%
8,45085.8%
[
7.5%
-
8.0%
]
7.95%
1,62295.1%
[
8.5%
-
9.0%
]
8.81%
7,30783.6%
[
9.0%
-
9.5%
]
9.49%
2,61281.6%
[
9.5%
-
10.0%
]
9.70%
1,732100.0%
[
12.0%
-
12.5%
]
12.30%
732100.0%
[
13.0%
-
13.5%
]
13.11%
122100.0%
[
14.0%
-
14.5%
]
14.06%
64100.0%
[
14.0%
-
14.5%
]
14.21%
95795.5%
[
21.0%
-
21.5%
]
21.27%
757100.0%
[
24.0%
-
24.5%
]
24.47%
94100.0%