Chilean vs Potawatomi Married-Couple Family Poverty

COMPARE

Chilean
Race
Ancestry
AfghanAfricanAlaska NativeAlaskan AthabascanAlbanianAleutAlsatianAmericanApacheArabArapahoArgentineanArmenianAssyrian/Chaldean/SyriacAustralianAustrianBahamianBangladeshiBarbadianBasqueBelgianBelizeanBermudanBhutaneseBlackfeetBolivianBrazilianBritishBritish West IndianBulgarianBurmeseCajunCambodianCanadianCape VerdeanCarpatho RusynCelticCentral AmericanCentral American IndianCherokeeCheyenneChickasawChileanChineseChippewaChoctawColombianColvilleComancheCosta RicanCreeCreekCroatianCrowCubanCypriotCzechCzechoslovakianDanishDelawareDominicanDutchDutch West IndianEastern EuropeanEcuadorianEgyptianEnglishEstonianEthiopianEuropeanFijianFilipinoFinnishFrenchFrench American IndianFrench CanadianGermanGerman RussianGhanaianGreekGuamanian/ChamorroGuatemalanGuyaneseHaitianHmongHonduranHopiHoumaHungarianIcelanderIndian (Asian)IndonesianInupiatIranianIraqiIrishIroquoisIsraeliItalianJamaicanJapaneseJordanianKenyanKiowaKoreanLaotianLatvianLebaneseLiberianLithuanianLumbeeLuxembourgerMacedonianMalaysianMalteseMarshalleseMenomineeMexicanMexican American IndianMongolianMoroccanNative HawaiianNavajoNepaleseNew ZealanderNicaraguanNigerianNorthern EuropeanNorwegianOkinawanOsageOttawaPaiutePakistaniPalestinianPanamanianParaguayanPennsylvania GermanPeruvianPimaPolishPortuguesePuebloPuerto RicanPuget Sound SalishRomanianRussianSalvadoranSamoanScandinavianScotch-IrishScottishSeminoleSenegaleseSerbianShoshoneSierra LeoneanSiouxSlavicSlovakSloveneSomaliSouth AfricanSouth AmericanSouth American IndianSoviet UnionSpaniardSpanishSpanish AmericanSpanish American IndianSri LankanSubsaharan AfricanSudaneseSwedishSwissSyrianTaiwaneseThaiTlingit-HaidaTohono O'OdhamTonganTrinidadian and TobagonianTsimshianTurkishU.S. Virgin IslanderUgandanUkrainianUruguayanUteVenezuelanVietnameseWelshWest IndianYakamaYaquiYugoslavianYumanYup'ikZimbabwean
Immigration
NonimmigrantsImmigrantsAfghanistanAfricaAlbaniaArgentinaArmeniaAsiaAustraliaAustriaBahamasBangladeshBarbadosBelarusBelgiumBelizeBoliviaBosnia and HerzegovinaBrazilBulgariaBurma/MyanmarCabo VerdeCambodiaCameroonCanadaCaribbeanCentral AmericaChileChinaColombiaCongoCosta RicaCroatiaCubaCzechoslovakiaDenmarkDominicaDominican RepublicEastern AfricaEastern AsiaEastern EuropeEcuadorEgyptEl SalvadorEnglandEritreaEthiopiaEuropeFijiFranceGermanyGhanaGreeceGrenadaGuatemalaGuyanaHaitiHondurasHong KongHungaryIndiaIndonesiaIranIraqIrelandIsraelItalyJamaicaJapanJordanKazakhstanKenyaKoreaKuwaitLaosLatin AmericaLatviaLebanonLiberiaLithuaniaMalaysiaMexicoMicronesiaMiddle AfricaMoldovaMoroccoNepalNetherlandsNicaraguaNigeriaNorth AmericaNorth MacedoniaNorthern AfricaNorthern EuropeNorwayOceaniaPakistanPanamaPeruPhilippinesPolandPortugalRomaniaRussiaSaudi ArabiaScotlandSenegalSerbiaSierra LeoneSingaporeSomaliaSouth AfricaSouth AmericaSouth Central AsiaSouth Eastern AsiaSouthern EuropeSpainSri LankaSt. Vincent and the GrenadinesSudanSwedenSwitzerlandSyriaTaiwanThailandTrinidad and TobagoTurkeyUgandaUkraineUruguayUzbekistanVenezuelaVietnamWest IndiesWestern AfricaWestern AsiaWestern EuropeYemenZaireZimbabweAzores
Potawatomi
Race
Ancestry
AfghanAfricanAlaska NativeAlaskan AthabascanAlbanianAleutAlsatianAmericanApacheArabArapahoArgentineanArmenianAssyrian/Chaldean/SyriacAustralianAustrianBahamianBangladeshiBarbadianBasqueBelgianBelizeanBermudanBhutaneseBlackfeetBolivianBrazilianBritishBritish West IndianBulgarianBurmeseCajunCambodianCanadianCape VerdeanCarpatho RusynCelticCentral AmericanCentral American IndianCherokeeCheyenneChickasawChineseChippewaChoctawColombianColvilleComancheCosta RicanCreeCreekCroatianCrowCubanCypriotCzechCzechoslovakianDanishDelawareDominicanDutchDutch West IndianEastern EuropeanEcuadorianEgyptianEnglishEstonianEthiopianEuropeanFijianFilipinoFinnishFrenchFrench American IndianFrench CanadianGermanGerman RussianGhanaianGreekGuamanian/ChamorroGuatemalanGuyaneseHaitianHmongHonduranHopiHoumaHungarianIcelanderIndian (Asian)IndonesianInupiatIranianIraqiIrishIroquoisIsraeliItalianJamaicanJapaneseJordanianKenyanKiowaKoreanLaotianLatvianLebaneseLiberianLithuanianLumbeeLuxembourgerMacedonianMalaysianMalteseMarshalleseMenomineeMexicanMexican American IndianMongolianMoroccanNative HawaiianNavajoNepaleseNew ZealanderNicaraguanNigerianNorthern EuropeanNorwegianOkinawanOsageOttawaPaiutePakistaniPalestinianPanamanianParaguayanPennsylvania GermanPeruvianPimaPolishPortuguesePotawatomiPuebloPuerto RicanPuget Sound SalishRomanianRussianSalvadoranSamoanScandinavianScotch-IrishScottishSeminoleSenegaleseSerbianShoshoneSierra LeoneanSiouxSlavicSlovakSloveneSomaliSouth AfricanSouth AmericanSouth American IndianSoviet UnionSpaniardSpanishSpanish AmericanSpanish American IndianSri LankanSubsaharan AfricanSudaneseSwedishSwissSyrianTaiwaneseThaiTlingit-HaidaTohono O'OdhamTonganTrinidadian and TobagonianTsimshianTurkishU.S. Virgin IslanderUgandanUkrainianUruguayanUteVenezuelanVietnameseWelshWest IndianYakamaYaquiYugoslavianYumanYup'ikZimbabwean
Immigration
NonimmigrantsImmigrantsAfghanistanAfricaAlbaniaArgentinaArmeniaAsiaAustraliaAustriaBahamasBangladeshBarbadosBelarusBelgiumBelizeBoliviaBosnia and HerzegovinaBrazilBulgariaBurma/MyanmarCabo VerdeCambodiaCameroonCanadaCaribbeanCentral AmericaChileChinaColombiaCongoCosta RicaCroatiaCubaCzechoslovakiaDenmarkDominicaDominican RepublicEastern AfricaEastern AsiaEastern EuropeEcuadorEgyptEl SalvadorEnglandEritreaEthiopiaEuropeFijiFranceGermanyGhanaGreeceGrenadaGuatemalaGuyanaHaitiHondurasHong KongHungaryIndiaIndonesiaIranIraqIrelandIsraelItalyJamaicaJapanJordanKazakhstanKenyaKoreaKuwaitLaosLatin AmericaLatviaLebanonLiberiaLithuaniaMalaysiaMexicoMicronesiaMiddle AfricaMoldovaMoroccoNepalNetherlandsNicaraguaNigeriaNorth AmericaNorth MacedoniaNorthern AfricaNorthern EuropeNorwayOceaniaPakistanPanamaPeruPhilippinesPolandPortugalRomaniaRussiaSaudi ArabiaScotlandSenegalSerbiaSierra LeoneSingaporeSomaliaSouth AfricaSouth AmericaSouth Central AsiaSouth Eastern AsiaSouthern EuropeSpainSri LankaSt. Vincent and the GrenadinesSudanSwedenSwitzerlandSyriaTaiwanThailandTrinidad and TobagoTurkeyUgandaUkraineUruguayUzbekistanVenezuelaVietnamWest IndiesWestern AfricaWestern AsiaWestern EuropeYemenZaireZimbabweAzores
Married-Couple Family Poverty
Income
Poverty
Unemployment
Labor Participation
Family Structure
Vehicle Availability
Education Level
Disability

Married-Couple Family Poverty Comparison

Chileans

Potawatomi

Excellent
Poor
4.9%
MARRIED-COUPLE FAMILY POVERTY
86.0/ 100
METRIC RATING
138th/ 347
METRIC RANK
5.5%
MARRIED-COUPLE FAMILY POVERTY
12.4/ 100
METRIC RATING
216th/ 347
METRIC RANK

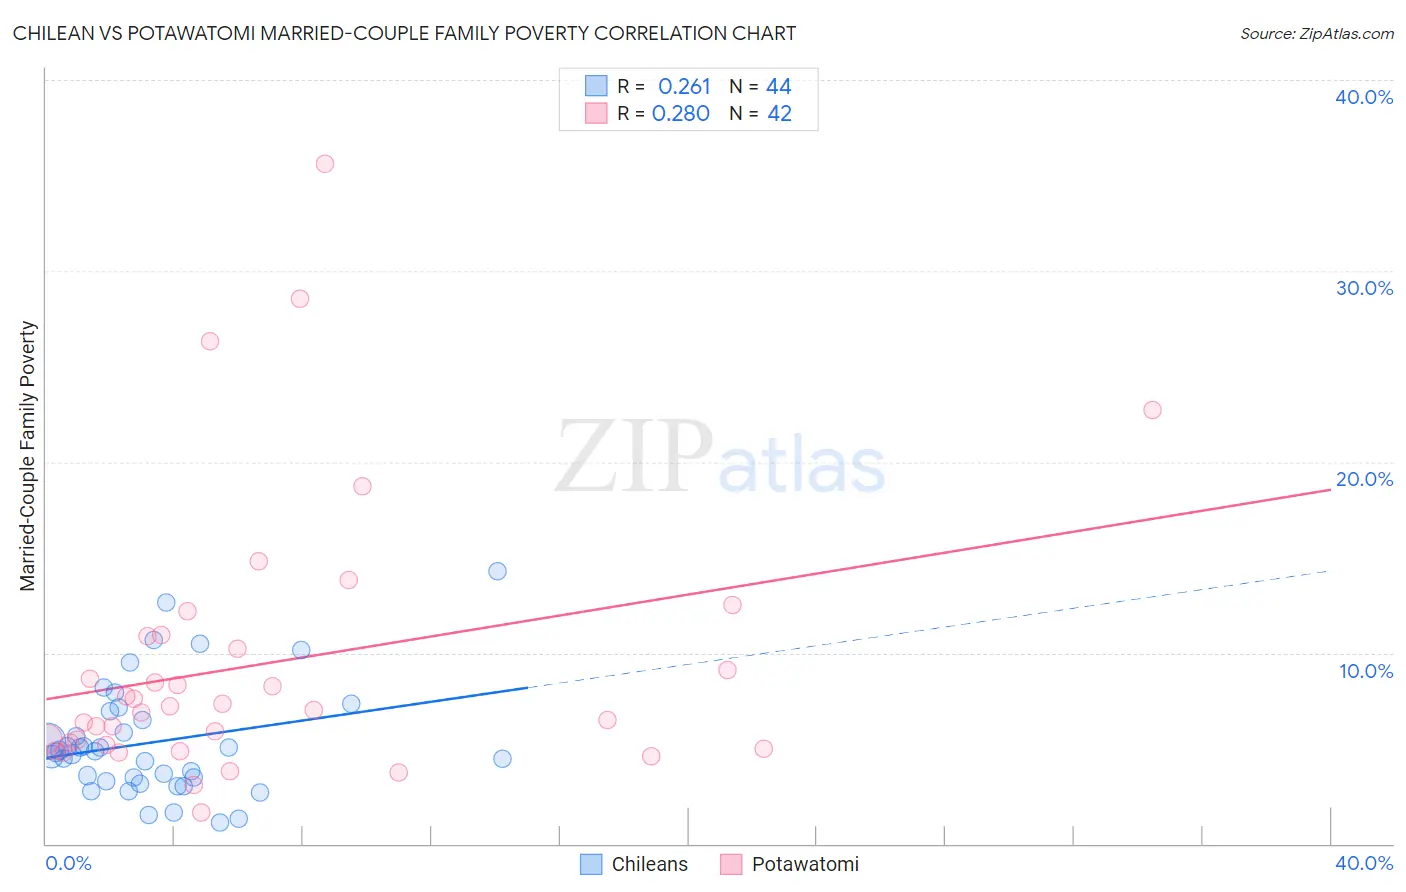
Chilean vs Potawatomi Married-Couple Family Poverty Correlation Chart

The statistical analysis conducted on geographies consisting of 255,436,750 people shows a weak positive correlation between the proportion of Chileans and poverty level among married-couple families in the United States with a correlation coefficient (R) of 0.261 and weighted average of 4.9%. Similarly, the statistical analysis conducted on geographies consisting of 117,481,648 people shows a weak positive correlation between the proportion of Potawatomi and poverty level among married-couple families in the United States with a correlation coefficient (R) of 0.280 and weighted average of 5.5%, a difference of 11.6%.
Chilean vs Potawatomi Married-Couple Family Poverty

Married-Couple Family Poverty Correlation Summary

MeasurementChileanPotawatomi
Minimum1.1%1.6%
Maximum14.3%35.6%
Range13.2%34.0%
Mean5.3%9.5%
Median4.8%7.1%
Interquartile 25% (IQ1)3.4%5.2%
Interquartile 75% (IQ3)6.7%10.9%
Interquartile Range (IQR)3.4%5.7%
Standard Deviation (Sample)3.0%7.2%
Standard Deviation (Population)2.9%7.1%

Similar Demographics by Married-Couple Family Poverty

Demographics Similar to Chileans by Married-Couple Family Poverty

In terms of married-couple family poverty, the demographic groups most similar to Chileans are Guamanian/Chamorro (4.9%, a difference of 0.13%), German Russian (5.0%, a difference of 0.23%), Immigrants from Portugal (5.0%, a difference of 0.29%), Immigrants from Brazil (5.0%, a difference of 0.34%), and Immigrants from China (5.0%, a difference of 0.34%).
DemographicsRating | RankMarried-Couple Family Poverty
Immigrants | Eastern Europe
90.5
/100
|
#131
Exceptional
4.9%
Puget Sound Salish
90.4
/100
|
#132
Exceptional
4.9%
Immigrants | Kenya
90.2
/100
|
#133
Exceptional
4.9%
Samoans
90.2
/100
|
#134
Exceptional
4.9%
Assyrians/Chaldeans/Syriacs
89.4
/100
|
#135
Excellent
4.9%
Immigrants | Hungary
88.7
/100
|
#136
Excellent
4.9%
Guamanians/Chamorros
86.5
/100
|
#137
Excellent
4.9%
Chileans
86.0
/100
|
#138
Excellent
4.9%
German Russians
85.1
/100
|
#139
Excellent
5.0%
Immigrants | Portugal
84.8
/100
|
#140
Excellent
5.0%
Immigrants | Brazil
84.6
/100
|
#141
Excellent
5.0%
Immigrants | China
84.6
/100
|
#142
Excellent
5.0%
Immigrants | Egypt
83.4
/100
|
#143
Excellent
5.0%
Hmong
83.2
/100
|
#144
Excellent
5.0%
Immigrants | Spain
79.9
/100
|
#145
Good
5.0%

Demographics Similar to Potawatomi by Married-Couple Family Poverty

In terms of married-couple family poverty, the demographic groups most similar to Potawatomi are Armenian (5.5%, a difference of 0.12%), Iroquois (5.5%, a difference of 0.18%), Immigrants from Liberia (5.5%, a difference of 0.23%), Immigrants from Nigeria (5.5%, a difference of 0.29%), and Afghan (5.5%, a difference of 0.31%).
DemographicsRating | RankMarried-Couple Family Poverty
Immigrants | Syria
15.4
/100
|
#209
Poor
5.5%
Immigrants | Micronesia
14.4
/100
|
#210
Poor
5.5%
Nigerians
14.3
/100
|
#211
Poor
5.5%
Immigrants | Thailand
14.0
/100
|
#212
Poor
5.5%
Immigrants | Liberia
13.3
/100
|
#213
Poor
5.5%
Iroquois
13.1
/100
|
#214
Poor
5.5%
Armenians
12.8
/100
|
#215
Poor
5.5%
Potawatomi
12.4
/100
|
#216
Poor
5.5%
Immigrants | Nigeria
11.3
/100
|
#217
Poor
5.5%
Afghans
11.2
/100
|
#218
Poor
5.5%
Japanese
9.8
/100
|
#219
Tragic
5.6%
Colombians
9.2
/100
|
#220
Tragic
5.6%
Panamanians
9.2
/100
|
#221
Tragic
5.6%
Cajuns
6.9
/100
|
#222
Tragic
5.6%
Immigrants | Fiji
6.7
/100
|
#223
Tragic
5.6%