Blackfeet vs Immigrants from Eastern Africa Married-Couple Family Poverty
COMPARE
Blackfeet
Immigrants from Eastern Africa
Married-Couple Family Poverty
Married-Couple Family Poverty Comparison
Blackfeet
Immigrants from Eastern Africa
6.2%
MARRIED-COUPLE FAMILY POVERTY
0.2/ 100
METRIC RATING
265th/ 347
METRIC RANK
5.2%
MARRIED-COUPLE FAMILY POVERTY
50.0/ 100
METRIC RATING
174th/ 347
METRIC RANK
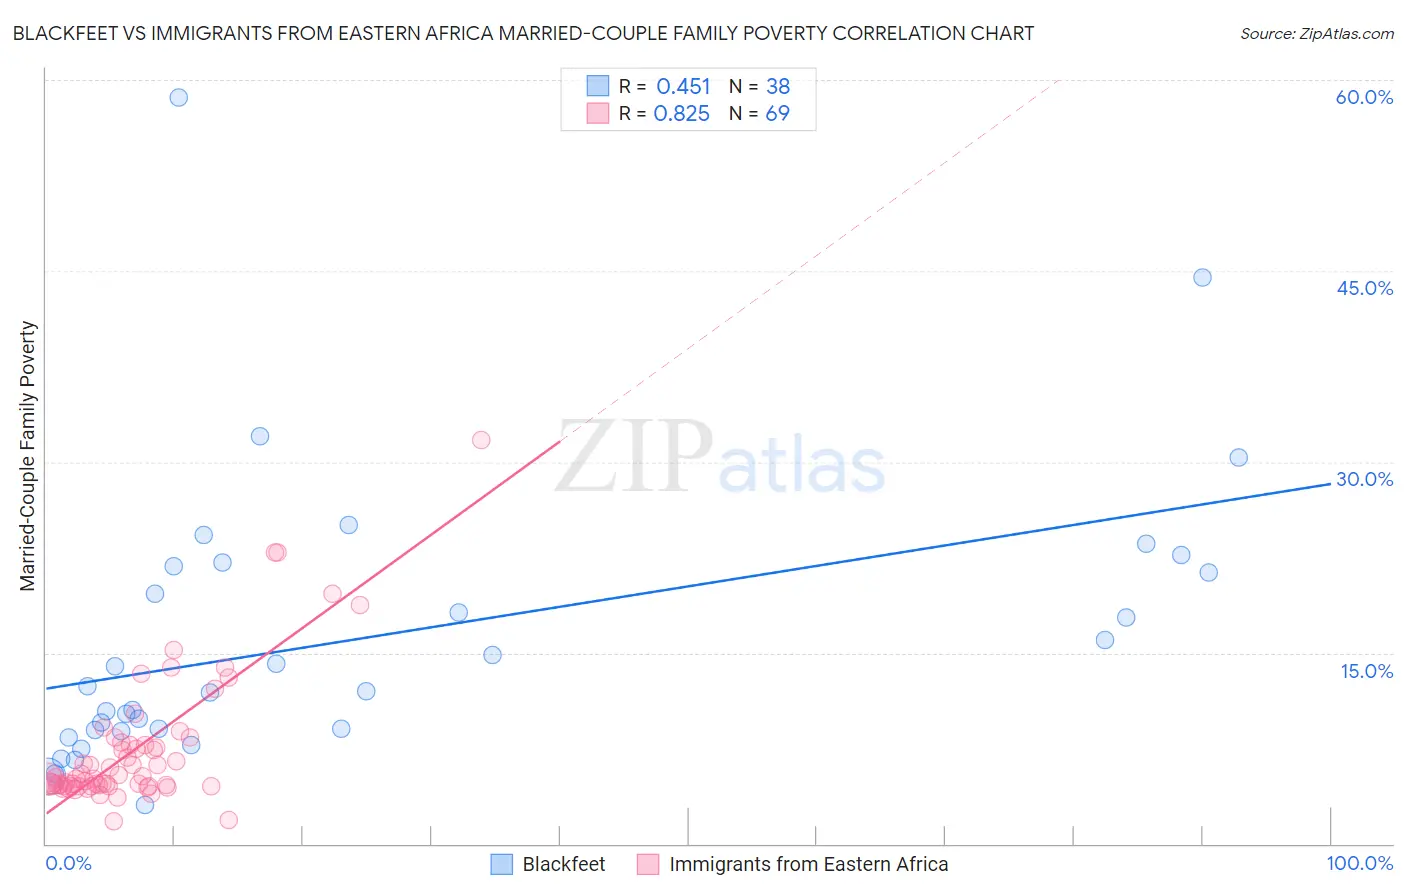
Blackfeet vs Immigrants from Eastern Africa Married-Couple Family Poverty Correlation Chart
The statistical analysis conducted on geographies consisting of 307,833,949 people shows a moderate positive correlation between the proportion of Blackfeet and poverty level among married-couple families in the United States with a correlation coefficient (R) of 0.451 and weighted average of 6.2%. Similarly, the statistical analysis conducted on geographies consisting of 352,572,169 people shows a very strong positive correlation between the proportion of Immigrants from Eastern Africa and poverty level among married-couple families in the United States with a correlation coefficient (R) of 0.825 and weighted average of 5.2%, a difference of 18.2%.
Married-Couple Family Poverty Correlation Summary
| Measurement | Blackfeet | Immigrants from Eastern Africa |
| Minimum | 3.1% | 1.7% |
| Maximum | 58.6% | 31.7% |
| Range | 55.5% | 30.0% |
| Mean | 16.2% | 7.5% |
| Median | 12.2% | 5.2% |
| Interquartile 25% (IQ1) | 9.0% | 4.5% |
| Interquartile 75% (IQ3) | 21.8% | 7.8% |
| Interquartile Range (IQR) | 12.8% | 3.3% |
| Standard Deviation (Sample) | 11.2% | 5.4% |
| Standard Deviation (Population) | 11.1% | 5.3% |
Similar Demographics by Married-Couple Family Poverty
Demographics Similar to Blackfeet by Married-Couple Family Poverty
In terms of married-couple family poverty, the demographic groups most similar to Blackfeet are Creek (6.2%, a difference of 0.080%), Spanish American (6.2%, a difference of 0.13%), Immigrants from Congo (6.1%, a difference of 0.43%), Alaska Native (6.2%, a difference of 0.61%), and Immigrants from Senegal (6.1%, a difference of 0.66%).
| Demographics | Rating | Rank | Married-Couple Family Poverty |
| Immigrants | Immigrants | 0.5 /100 | #258 | Tragic 6.0% |
| Alaskan Athabascans | 0.4 /100 | #259 | Tragic 6.1% |
| Jamaicans | 0.3 /100 | #260 | Tragic 6.1% |
| Senegalese | 0.3 /100 | #261 | Tragic 6.1% |
| Shoshone | 0.3 /100 | #262 | Tragic 6.1% |
| Immigrants | Senegal | 0.3 /100 | #263 | Tragic 6.1% |
| Immigrants | Congo | 0.2 /100 | #264 | Tragic 6.1% |
| Blackfeet | 0.2 /100 | #265 | Tragic 6.2% |
| Creek | 0.2 /100 | #266 | Tragic 6.2% |
| Spanish Americans | 0.2 /100 | #267 | Tragic 6.2% |
| Alaska Natives | 0.2 /100 | #268 | Tragic 6.2% |
| Immigrants | West Indies | 0.1 /100 | #269 | Tragic 6.2% |
| Immigrants | Jamaica | 0.1 /100 | #270 | Tragic 6.2% |
| Immigrants | Bahamas | 0.1 /100 | #271 | Tragic 6.2% |
| Trinidadians and Tobagonians | 0.1 /100 | #272 | Tragic 6.2% |
Demographics Similar to Immigrants from Eastern Africa by Married-Couple Family Poverty
In terms of married-couple family poverty, the demographic groups most similar to Immigrants from Eastern Africa are Alsatian (5.2%, a difference of 0.14%), Immigrants from Northern Africa (5.2%, a difference of 0.16%), Marshallese (5.2%, a difference of 0.24%), Menominee (5.2%, a difference of 0.25%), and Bermudan (5.2%, a difference of 0.33%).
| Demographics | Rating | Rank | Married-Couple Family Poverty |
| Costa Ricans | 61.5 /100 | #167 | Good 5.1% |
| Immigrants | Uganda | 54.9 /100 | #168 | Average 5.2% |
| Ottawa | 54.5 /100 | #169 | Average 5.2% |
| Immigrants | Argentina | 54.4 /100 | #170 | Average 5.2% |
| Bermudans | 52.9 /100 | #171 | Average 5.2% |
| Immigrants | Northern Africa | 51.3 /100 | #172 | Average 5.2% |
| Alsatians | 51.2 /100 | #173 | Average 5.2% |
| Immigrants | Eastern Africa | 50.0 /100 | #174 | Average 5.2% |
| Marshallese | 47.9 /100 | #175 | Average 5.2% |
| Menominee | 47.8 /100 | #176 | Average 5.2% |
| Immigrants | Kazakhstan | 45.1 /100 | #177 | Average 5.2% |
| Immigrants | Ukraine | 44.9 /100 | #178 | Average 5.2% |
| Spanish | 41.4 /100 | #179 | Average 5.3% |
| Immigrants | Sierra Leone | 39.3 /100 | #180 | Fair 5.3% |
| Immigrants | Chile | 38.8 /100 | #181 | Fair 5.3% |