Blackfeet 1 or more Vehicles in Household
COMPARE
Blackfeet
Select to Compare
1 or more Vehicles in Household
Blackfeet 1 or more Vehicles in Household
90.6%
1+ VEHICLES AVAILABLE
92.6/ 100
METRIC RATING
119th/ 347
METRIC RANK
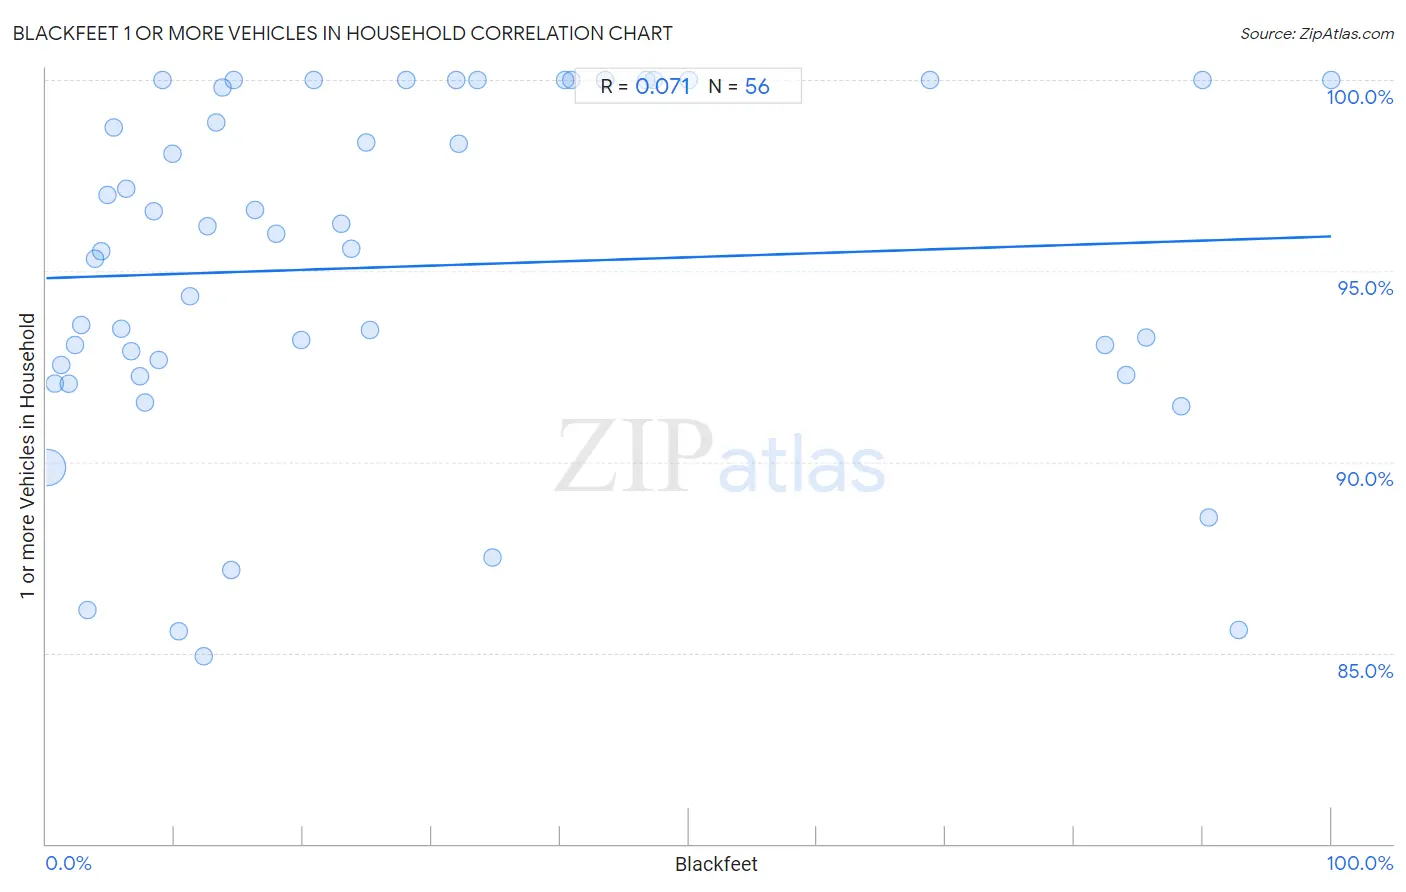
Blackfeet 1 or more Vehicles in Household Correlation Chart
The statistical analysis conducted on geographies consisting of 309,485,475 people shows a slight positive correlation between the proportion of Blackfeet and percentage of households with 1 or more vehicles available in the United States with a correlation coefficient (R) of 0.071 and weighted average of 90.6%. On average, for every 1% (one percent) increase in Blackfeet within a typical geography, there is an increase of 0.011% in percentage of households with 1 or more vehicles available.
It is essential to understand that the correlation between the percentage of Blackfeet and percentage of households with 1 or more vehicles available does not imply a direct cause-and-effect relationship. It remains uncertain whether the presence of Blackfeet influences an upward or downward trend in the level of percentage of households with 1 or more vehicles available within an area, or if Blackfeet simply ended up residing in those areas with higher or lower levels of percentage of households with 1 or more vehicles available due to other factors.
Demographics Similar to Blackfeet by 1 or more Vehicles in Household
In terms of 1 or more vehicles in household, the demographic groups most similar to Blackfeet are Immigrants from Thailand (90.6%, a difference of 0.020%), Icelander (90.5%, a difference of 0.030%), Costa Rican (90.5%, a difference of 0.030%), Fijian (90.5%, a difference of 0.040%), and Greek (90.6%, a difference of 0.050%).
| Demographics | Rating | Rank | 1 or more Vehicles in Household |
| Immigrants from Netherlands | 95.7 /100 | #112 | Exceptional 90.8% |
| Immigrants from Kuwait | 94.7 /100 | #113 | Exceptional 90.7% |
| Armenians | 94.5 /100 | #114 | Exceptional 90.7% |
| Serbians | 94.3 /100 | #115 | Exceptional 90.7% |
| Chippewa | 94.3 /100 | #116 | Exceptional 90.7% |
| Greeks | 93.5 /100 | #117 | Exceptional 90.6% |
| Japanese | 93.4 /100 | #118 | Exceptional 90.6% |
| Blackfeet | 92.6 /100 | #119 | Exceptional 90.6% |
| Immigrants from Thailand | 92.3 /100 | #120 | Exceptional 90.6% |
| Icelanders | 92.1 /100 | #121 | Exceptional 90.5% |
| Costa Ricans | 92.0 /100 | #122 | Exceptional 90.5% |
| Fijians | 91.8 /100 | #123 | Exceptional 90.5% |
| Puget Sound Salish | 91.5 /100 | #124 | Exceptional 90.5% |
| Immigrants from Korea | 90.5 /100 | #125 | Exceptional 90.5% |
| Immigrants from Cameroon | 89.4 /100 | #126 | Excellent 90.4% |
Blackfeet 1 or more Vehicles in Household Correlation Summary
| Measurement | Blackfeet Data | 1 or more Vehicles in Household Data |
| Minimum | 0.088% | 84.9% |
| Maximum | 100.0% | 100.0% |
| Range | 99.9% | 15.1% |
| Mean | 28.3% | 95.1% |
| Median | 15.4% | 95.8% |
| Interquartile 25% (IQ1) | 7.0% | 92.4% |
| Interquartile 75% (IQ3) | 40.7% | 100.0% |
| Interquartile Range (IQR) | 33.7% | 7.6% |
| Standard Deviation (Sample) | 29.2% | 4.5% |
| Standard Deviation (Population) | 28.9% | 4.5% |
Correlation Details
| Blackfeet Percentile | Sample Size | 1 or more Vehicles in Household |
[ 0.0% - 0.5% ] 0.088% | 300,768,240 | 89.9% |
[ 0.5% - 1.0% ] 0.68% | 6,545,859 | 92.0% |
[ 1.0% - 1.5% ] 1.21% | 989,410 | 92.6% |
[ 1.5% - 2.0% ] 1.73% | 683,700 | 92.0% |
[ 2.0% - 2.5% ] 2.20% | 216,637 | 93.1% |
[ 2.5% - 3.0% ] 2.69% | 76,209 | 93.6% |
[ 3.0% - 3.5% ] 3.23% | 47,117 | 86.1% |
[ 3.5% - 4.0% ] 3.76% | 28,981 | 95.3% |
[ 4.0% - 4.5% ] 4.26% | 32,829 | 95.5% |
[ 4.5% - 5.0% ] 4.72% | 8,304 | 97.0% |
[ 5.0% - 5.5% ] 5.29% | 8,283 | 98.8% |
[ 5.5% - 6.0% ] 5.82% | 14,933 | 93.5% |
[ 6.0% - 6.5% ] 6.26% | 9,663 | 97.2% |
[ 6.5% - 7.0% ] 6.64% | 5,107 | 92.9% |
[ 7.0% - 7.5% ] 7.26% | 4,213 | 92.3% |
[ 7.5% - 8.0% ] 7.67% | 4,081 | 91.5% |
[ 8.0% - 8.5% ] 8.39% | 3,136 | 96.6% |
[ 8.5% - 9.0% ] 8.80% | 2,148 | 92.7% |
[ 9.0% - 9.5% ] 9.07% | 375 | 100.0% |
[ 9.5% - 10.0% ] 9.78% | 1,084 | 98.1% |
[ 10.0% - 10.5% ] 10.32% | 853 | 85.6% |
[ 11.0% - 11.5% ] 11.19% | 2,538 | 94.3% |
[ 12.0% - 12.5% ] 12.24% | 147 | 84.9% |
[ 12.5% - 13.0% ] 12.58% | 1,240 | 96.2% |
[ 13.0% - 13.5% ] 13.20% | 197 | 98.9% |
[ 13.5% - 14.0% ] 13.72% | 860 | 99.8% |
[ 14.0% - 14.5% ] 14.37% | 167 | 87.2% |
[ 14.5% - 15.0% ] 14.58% | 240 | 100.0% |
[ 16.0% - 16.5% ] 16.28% | 1,253 | 96.6% |
[ 17.5% - 18.0% ] 17.94% | 3,061 | 96.0% |
[ 19.5% - 20.0% ] 19.83% | 116 | 93.2% |
[ 20.5% - 21.0% ] 20.83% | 120 | 100.0% |
[ 22.5% - 23.0% ] 22.98% | 5,008 | 96.2% |
[ 23.5% - 24.0% ] 23.75% | 480 | 95.6% |
[ 24.5% - 25.0% ] 24.88% | 414 | 98.4% |
[ 25.0% - 25.5% ] 25.15% | 163 | 93.4% |
[ 28.0% - 28.5% ] 28.00% | 50 | 100.0% |
[ 31.5% - 32.0% ] 31.95% | 241 | 100.0% |
[ 32.0% - 32.5% ] 32.07% | 343 | 98.3% |
[ 33.5% - 34.0% ] 33.61% | 244 | 100.0% |
[ 34.5% - 35.0% ] 34.78% | 1,317 | 87.5% |
[ 40.0% - 40.5% ] 40.40% | 151 | 100.0% |
[ 40.5% - 41.0% ] 40.90% | 863 | 100.0% |
[ 43.0% - 43.5% ] 43.48% | 69 | 100.0% |
[ 46.5% - 47.0% ] 46.67% | 15 | 100.0% |
[ 47.0% - 47.5% ] 47.23% | 271 | 100.0% |
[ 50.0% - 50.5% ] 50.00% | 4 | 100.0% |
[ 68.5% - 69.0% ] 68.75% | 64 | 100.0% |
[ 82.0% - 82.5% ] 82.35% | 1,654 | 93.0% |
[ 84.0% - 84.5% ] 84.09% | 7,532 | 92.3% |
[ 85.5% - 86.0% ] 85.65% | 871 | 93.3% |
[ 88.0% - 88.5% ] 88.34% | 3,001 | 91.5% |
[ 89.5% - 90.0% ] 89.96% | 229 | 100.0% |
[ 90.0% - 90.5% ] 90.43% | 690 | 88.5% |
[ 92.5% - 93.0% ] 92.78% | 554 | 85.6% |
[ 99.5% - 100.0% ] 100.00% | 146 | 100.0% |