African vs Immigrants from Grenada Married-Couple Family Poverty
COMPARE
African
Immigrants from Grenada
Married-Couple Family Poverty
Married-Couple Family Poverty Comparison
Africans
Immigrants from Grenada
6.0%
MARRIED-COUPLE FAMILY POVERTY
0.7/ 100
METRIC RATING
253rd/ 347
METRIC RANK
7.3%
MARRIED-COUPLE FAMILY POVERTY
0.0/ 100
METRIC RATING
320th/ 347
METRIC RANK
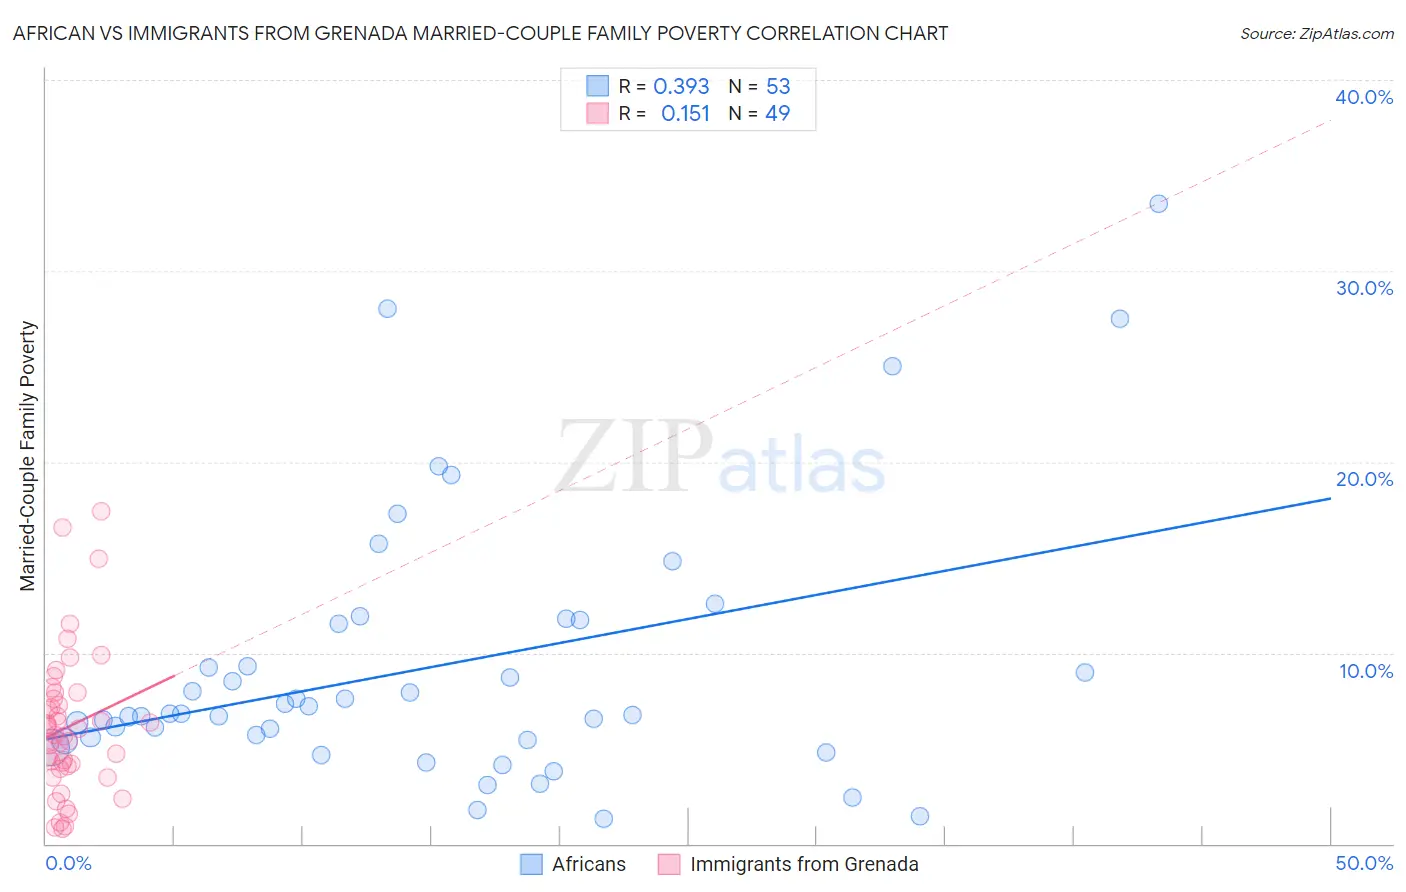
African vs Immigrants from Grenada Married-Couple Family Poverty Correlation Chart
The statistical analysis conducted on geographies consisting of 465,332,891 people shows a mild positive correlation between the proportion of Africans and poverty level among married-couple families in the United States with a correlation coefficient (R) of 0.393 and weighted average of 6.0%. Similarly, the statistical analysis conducted on geographies consisting of 67,074,791 people shows a poor positive correlation between the proportion of Immigrants from Grenada and poverty level among married-couple families in the United States with a correlation coefficient (R) of 0.151 and weighted average of 7.3%, a difference of 22.2%.
Married-Couple Family Poverty Correlation Summary
| Measurement | African | Immigrants from Grenada |
| Minimum | 1.3% | 0.79% |
| Maximum | 33.5% | 17.4% |
| Range | 32.2% | 16.6% |
| Mean | 9.3% | 6.1% |
| Median | 6.8% | 5.7% |
| Interquartile 25% (IQ1) | 5.4% | 4.0% |
| Interquartile 75% (IQ3) | 11.6% | 7.7% |
| Interquartile Range (IQR) | 6.2% | 3.8% |
| Standard Deviation (Sample) | 7.0% | 3.7% |
| Standard Deviation (Population) | 6.9% | 3.7% |
Similar Demographics by Married-Couple Family Poverty
Demographics Similar to Africans by Married-Couple Family Poverty
In terms of married-couple family poverty, the demographic groups most similar to Africans are Immigrants from Somalia (6.0%, a difference of 0.060%), Immigrants from Western Asia (6.0%, a difference of 0.090%), Comanche (6.0%, a difference of 0.21%), Bangladeshi (6.0%, a difference of 0.71%), and Immigrants from Ghana (5.9%, a difference of 0.73%).
| Demographics | Rating | Rank | Married-Couple Family Poverty |
| Immigrants | Venezuela | 1.8 /100 | #246 | Tragic 5.8% |
| Iraqis | 1.4 /100 | #247 | Tragic 5.9% |
| Cree | 1.2 /100 | #248 | Tragic 5.9% |
| Tsimshian | 1.1 /100 | #249 | Tragic 5.9% |
| Immigrants | Eritrea | 1.1 /100 | #250 | Tragic 5.9% |
| Immigrants | Ghana | 1.0 /100 | #251 | Tragic 5.9% |
| Immigrants | Western Asia | 0.7 /100 | #252 | Tragic 6.0% |
| Africans | 0.7 /100 | #253 | Tragic 6.0% |
| Immigrants | Somalia | 0.7 /100 | #254 | Tragic 6.0% |
| Comanche | 0.7 /100 | #255 | Tragic 6.0% |
| Bangladeshis | 0.5 /100 | #256 | Tragic 6.0% |
| Immigrants | Burma/Myanmar | 0.5 /100 | #257 | Tragic 6.0% |
| Immigrants | Immigrants | 0.5 /100 | #258 | Tragic 6.0% |
| Alaskan Athabascans | 0.4 /100 | #259 | Tragic 6.1% |
| Jamaicans | 0.3 /100 | #260 | Tragic 6.1% |
Demographics Similar to Immigrants from Grenada by Married-Couple Family Poverty
In terms of married-couple family poverty, the demographic groups most similar to Immigrants from Grenada are Immigrants from Caribbean (7.3%, a difference of 0.77%), Immigrants from Honduras (7.3%, a difference of 0.79%), Immigrants from Latin America (7.2%, a difference of 1.2%), Immigrants from Guatemala (7.2%, a difference of 1.4%), and Mexican (7.2%, a difference of 1.5%).
| Demographics | Rating | Rank | Married-Couple Family Poverty |
| Immigrants | St. Vincent and the Grenadines | 0.0 /100 | #313 | Tragic 7.1% |
| British West Indians | 0.0 /100 | #314 | Tragic 7.1% |
| Inupiat | 0.0 /100 | #315 | Tragic 7.1% |
| Hondurans | 0.0 /100 | #316 | Tragic 7.2% |
| Mexicans | 0.0 /100 | #317 | Tragic 7.2% |
| Immigrants | Guatemala | 0.0 /100 | #318 | Tragic 7.2% |
| Immigrants | Latin America | 0.0 /100 | #319 | Tragic 7.2% |
| Immigrants | Grenada | 0.0 /100 | #320 | Tragic 7.3% |
| Immigrants | Caribbean | 0.0 /100 | #321 | Tragic 7.3% |
| Immigrants | Honduras | 0.0 /100 | #322 | Tragic 7.3% |
| Vietnamese | 0.0 /100 | #323 | Tragic 7.4% |
| Immigrants | Central America | 0.0 /100 | #324 | Tragic 7.4% |
| Immigrants | Cuba | 0.0 /100 | #325 | Tragic 7.5% |
| Immigrants | Bangladesh | 0.0 /100 | #326 | Tragic 7.5% |
| Hispanics or Latinos | 0.0 /100 | #327 | Tragic 7.5% |