African 2 or more Vehicles in Household
COMPARE
African
Select to Compare
2 or more Vehicles in Household
African 2 or more Vehicles in Household
51.8%
2+ VEHICLES AVAILABLE
0.2/ 100
METRIC RATING
274th/ 347
METRIC RANK
African 2 or more Vehicles in Household Correlation Chart
The statistical analysis conducted on geographies consisting of 469,649,163 people shows a mild positive correlation between the proportion of Africans and percentage of households with 2 or more vehicles available in the United States with a correlation coefficient (R) of 0.396 and weighted average of 51.8%. On average, for every 1% (one percent) increase in Africans within a typical geography, there is an increase of 0.34% in percentage of households with 2 or more vehicles available.
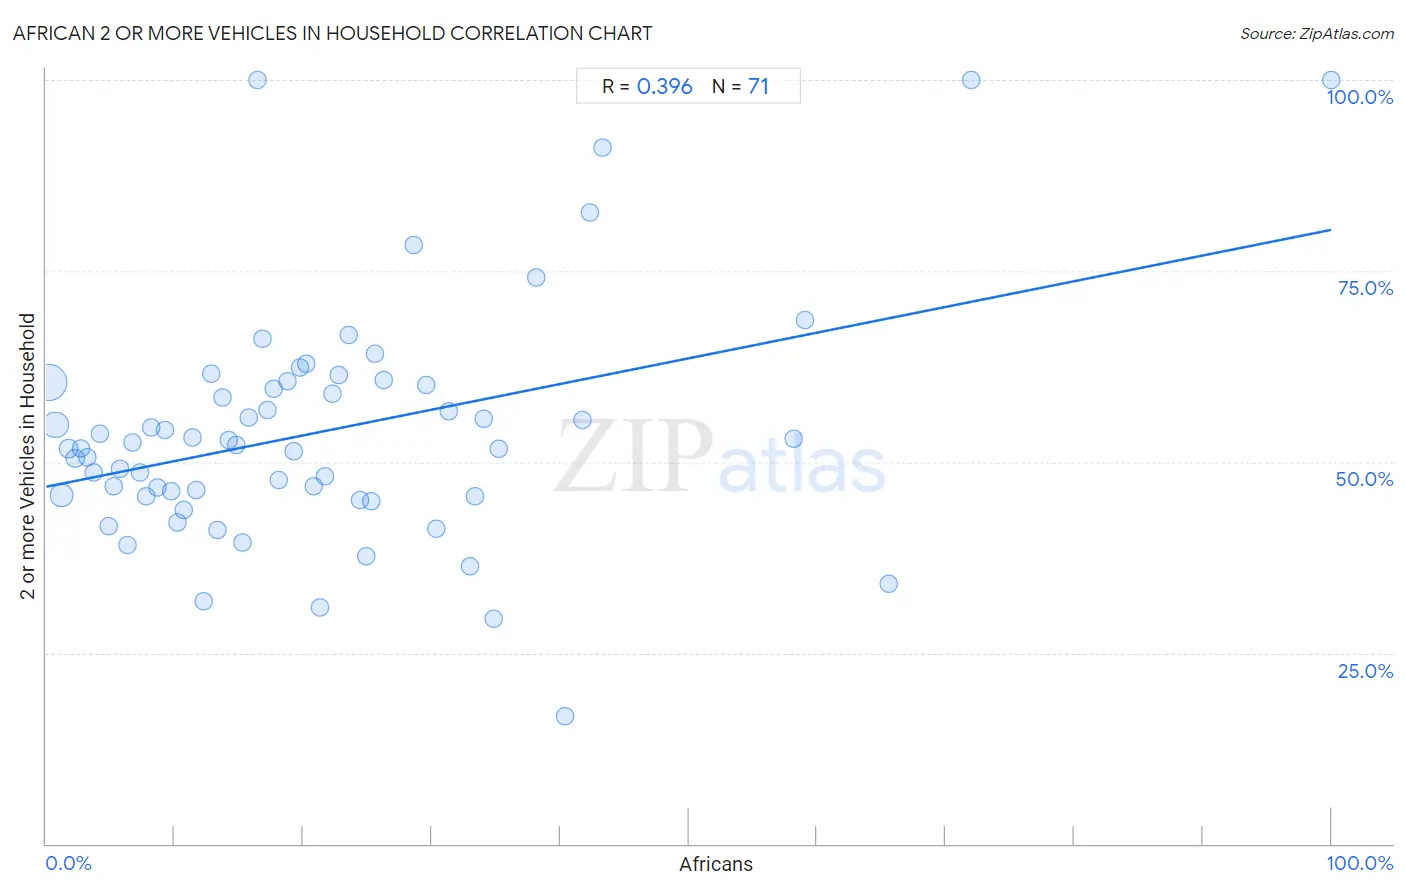
It is essential to understand that the correlation between the percentage of Africans and percentage of households with 2 or more vehicles available does not imply a direct cause-and-effect relationship. It remains uncertain whether the presence of Africans influences an upward or downward trend in the level of percentage of households with 2 or more vehicles available within an area, or if Africans simply ended up residing in those areas with higher or lower levels of percentage of households with 2 or more vehicles available due to other factors.
Demographics Similar to Africans by 2 or more Vehicles in Household
In terms of 2 or more vehicles in household, the demographic groups most similar to Africans are Immigrants from Honduras (51.8%, a difference of 0.020%), Immigrants from Croatia (51.8%, a difference of 0.040%), Israeli (51.9%, a difference of 0.050%), Immigrants from Africa (51.8%, a difference of 0.090%), and Subsaharan African (51.9%, a difference of 0.14%).
| Demographics | Rating | Rank | 2 or more Vehicles in Household |
| Immigrants from Colombia | 0.2 /100 | #267 | Tragic 52.0% |
| Pima | 0.2 /100 | #268 | Tragic 52.0% |
| Hondurans | 0.2 /100 | #269 | Tragic 52.0% |
| Immigrants from Ireland | 0.2 /100 | #270 | Tragic 52.0% |
| South Americans | 0.2 /100 | #271 | Tragic 51.9% |
| Sub-Saharan Africans | 0.2 /100 | #272 | Tragic 51.9% |
| Israelis | 0.2 /100 | #273 | Tragic 51.9% |
| Africans | 0.2 /100 | #274 | Tragic 51.8% |
| Immigrants from Honduras | 0.2 /100 | #275 | Tragic 51.8% |
| Immigrants from Croatia | 0.2 /100 | #276 | Tragic 51.8% |
| Immigrants from Africa | 0.2 /100 | #277 | Tragic 51.8% |
| Yuman | 0.1 /100 | #278 | Tragic 51.7% |
| Liberians | 0.1 /100 | #279 | Tragic 51.7% |
| Immigrants from Eastern Europe | 0.1 /100 | #280 | Tragic 51.7% |
| Immigrants from Kazakhstan | 0.1 /100 | #281 | Tragic 51.6% |
African 2 or more Vehicles in Household Correlation Summary
| Measurement | African Data | 2 or more Vehicles in Household Data |
| Minimum | 0.21% | 16.7% |
| Maximum | 100.0% | 100.0% |
| Range | 99.8% | 83.3% |
| Mean | 21.5% | 54.0% |
| Median | 17.7% | 52.1% |
| Interquartile 25% (IQ1) | 8.7% | 45.5% |
| Interquartile 75% (IQ3) | 29.5% | 60.4% |
| Interquartile Range (IQR) | 20.8% | 14.9% |
| Standard Deviation (Sample) | 18.2% | 15.5% |
| Standard Deviation (Population) | 18.1% | 15.4% |
Correlation Details
| African Percentile | Sample Size | 2 or more Vehicles in Household |
[ 0.0% - 0.5% ] 0.21% | 253,276,972 | 60.4% |
[ 0.5% - 1.0% ] 0.72% | 105,804,346 | 54.9% |
[ 1.0% - 1.5% ] 1.21% | 58,316,419 | 45.6% |
[ 1.5% - 2.0% ] 1.72% | 21,026,622 | 51.7% |
[ 2.0% - 2.5% ] 2.23% | 10,661,842 | 50.5% |
[ 2.5% - 3.0% ] 2.68% | 7,849,387 | 51.7% |
[ 3.0% - 3.5% ] 3.20% | 4,248,736 | 50.6% |
[ 3.5% - 4.0% ] 3.71% | 1,824,396 | 48.6% |
[ 4.0% - 4.5% ] 4.22% | 1,254,377 | 53.7% |
[ 4.5% - 5.0% ] 4.82% | 1,340,608 | 41.6% |
[ 5.0% - 5.5% ] 5.26% | 830,137 | 46.9% |
[ 5.5% - 6.0% ] 5.71% | 458,982 | 49.2% |
[ 6.0% - 6.5% ] 6.31% | 407,479 | 39.1% |
[ 6.5% - 7.0% ] 6.70% | 495,497 | 52.6% |
[ 7.0% - 7.5% ] 7.25% | 287,773 | 48.6% |
[ 7.5% - 8.0% ] 7.83% | 202,093 | 45.5% |
[ 8.0% - 8.5% ] 8.19% | 161,548 | 54.5% |
[ 8.5% - 9.0% ] 8.70% | 159,998 | 46.7% |
[ 9.0% - 9.5% ] 9.27% | 166,494 | 54.1% |
[ 9.5% - 10.0% ] 9.74% | 68,122 | 46.1% |
[ 10.0% - 10.5% ] 10.22% | 135,242 | 42.1% |
[ 10.5% - 11.0% ] 10.72% | 230,443 | 43.8% |
[ 11.0% - 11.5% ] 11.34% | 9,772 | 53.2% |
[ 11.5% - 12.0% ] 11.63% | 26,091 | 46.3% |
[ 12.0% - 12.5% ] 12.23% | 13,222 | 31.7% |
[ 12.5% - 13.0% ] 12.87% | 33,190 | 61.5% |
[ 13.0% - 13.5% ] 13.31% | 4,891 | 41.1% |
[ 13.5% - 14.0% ] 13.70% | 5,197 | 58.4% |
[ 14.0% - 14.5% ] 14.17% | 15,888 | 52.9% |
[ 14.5% - 15.0% ] 14.77% | 104,025 | 52.1% |
[ 15.0% - 15.5% ] 15.28% | 22,936 | 39.4% |
[ 15.5% - 16.0% ] 15.73% | 11,906 | 55.9% |
[ 16.0% - 16.5% ] 16.42% | 67 | 100.0% |
[ 16.5% - 17.0% ] 16.79% | 7,755 | 66.1% |
[ 17.0% - 17.5% ] 17.20% | 16,886 | 56.7% |
[ 17.5% - 18.0% ] 17.74% | 2,672 | 59.5% |
[ 18.0% - 18.5% ] 18.06% | 40,302 | 47.6% |
[ 18.5% - 19.0% ] 18.74% | 19,765 | 60.5% |
[ 19.0% - 19.5% ] 19.30% | 710 | 51.4% |
[ 19.5% - 20.0% ] 19.75% | 13,660 | 62.4% |
[ 20.0% - 20.5% ] 20.24% | 3,305 | 62.9% |
[ 20.5% - 21.0% ] 20.81% | 3,239 | 46.8% |
[ 21.0% - 21.5% ] 21.32% | 15,443 | 30.9% |
[ 21.5% - 22.0% ] 21.72% | 7,110 | 48.1% |
[ 22.0% - 22.5% ] 22.26% | 283 | 58.9% |
[ 22.5% - 23.0% ] 22.80% | 9,501 | 61.3% |
[ 23.5% - 24.0% ] 23.56% | 365 | 66.7% |
[ 24.0% - 24.5% ] 24.38% | 25,084 | 44.9% |
[ 24.5% - 25.0% ] 24.91% | 273 | 37.6% |
[ 25.0% - 25.5% ] 25.30% | 1,170 | 44.8% |
[ 25.5% - 26.0% ] 25.54% | 881 | 64.1% |
[ 26.0% - 26.5% ] 26.24% | 2,138 | 60.8% |
[ 28.5% - 29.0% ] 28.57% | 154 | 78.3% |
[ 29.5% - 30.0% ] 29.55% | 44 | 60.0% |
[ 30.0% - 30.5% ] 30.36% | 606 | 41.3% |
[ 31.0% - 31.5% ] 31.35% | 2,485 | 56.6% |
[ 32.5% - 33.0% ] 32.93% | 334 | 36.4% |
[ 33.0% - 33.5% ] 33.33% | 39 | 45.5% |
[ 34.0% - 34.5% ] 34.01% | 1,476 | 55.7% |
[ 34.5% - 35.0% ] 34.78% | 46 | 29.4% |
[ 35.0% - 35.5% ] 35.23% | 1,286 | 51.7% |
[ 38.0% - 38.5% ] 38.10% | 4,572 | 74.2% |
[ 40.0% - 40.5% ] 40.41% | 9,613 | 16.7% |
[ 41.5% - 42.0% ] 41.76% | 613 | 55.5% |
[ 42.0% - 42.5% ] 42.31% | 338 | 82.6% |
[ 43.0% - 43.5% ] 43.29% | 633 | 91.2% |
[ 58.0% - 58.5% ] 58.19% | 574 | 53.1% |
[ 59.0% - 59.5% ] 59.02% | 549 | 68.5% |
[ 65.5% - 66.0% ] 65.55% | 479 | 34.1% |
[ 72.0% - 72.5% ] 72.00% | 50 | 100.0% |
[ 99.5% - 100.0% ] 100.00% | 32 | 100.0% |