African Female Disability
COMPARE
African
Select to Compare
Female Disability
African Female Disability
13.4%
DISABILITY | FEMALES
0.0/ 100
METRIC RATING
301st/ 347
METRIC RANK
African Female Disability Correlation Chart
The statistical analysis conducted on geographies consisting of 469,943,278 people shows a mild positive correlation between the proportion of Africans and percentage of females with a disability in the United States with a correlation coefficient (R) of 0.373 and weighted average of 13.4%. On average, for every 1% (one percent) increase in Africans within a typical geography, there is an increase of 0.11% in percentage of females with a disability.
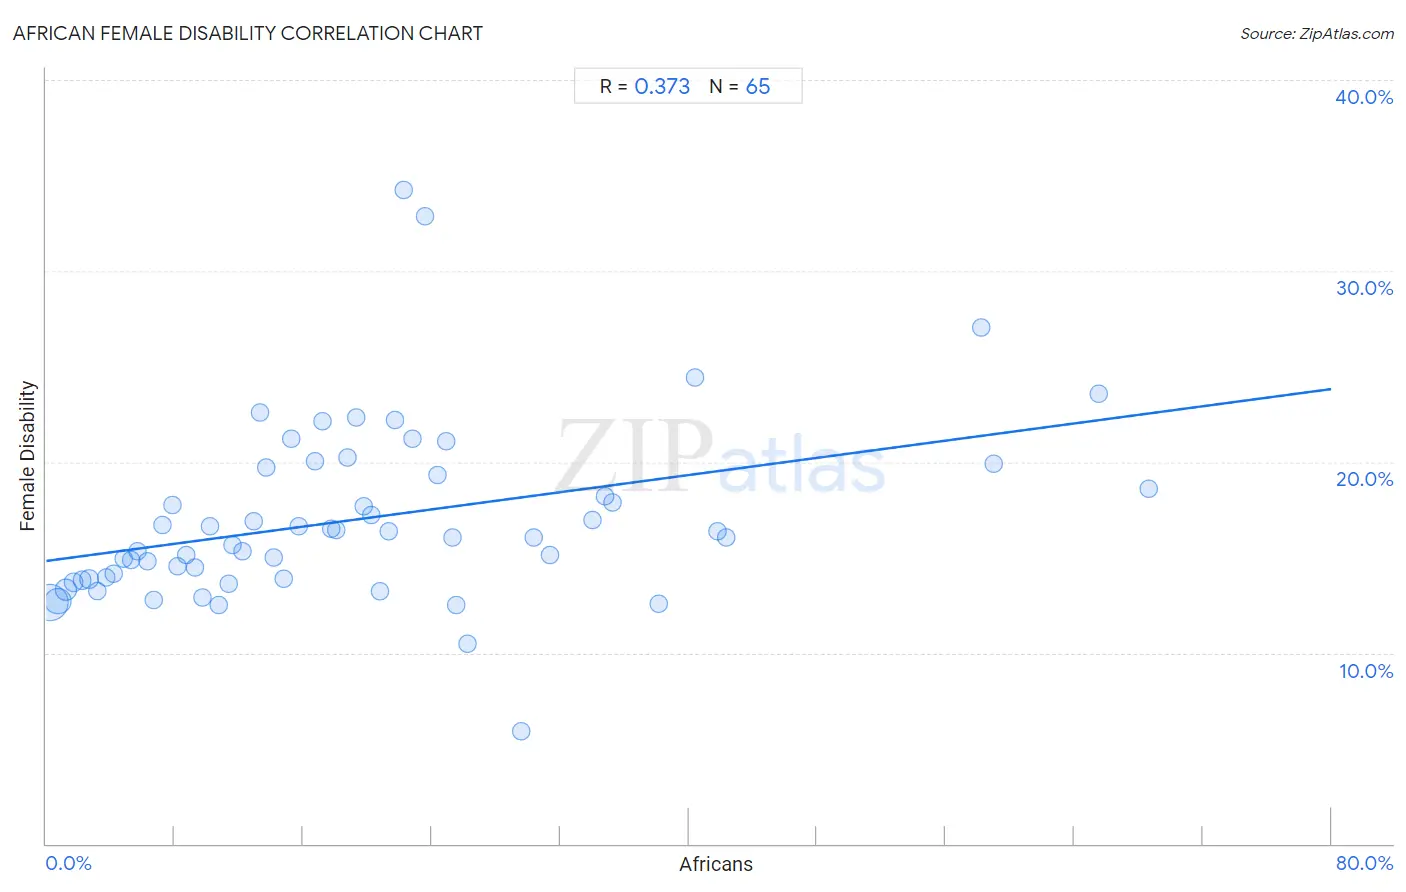
It is essential to understand that the correlation between the percentage of Africans and percentage of females with a disability does not imply a direct cause-and-effect relationship. It remains uncertain whether the presence of Africans influences an upward or downward trend in the level of percentage of females with a disability within an area, or if Africans simply ended up residing in those areas with higher or lower levels of percentage of females with a disability due to other factors.
Demographics Similar to Africans by Female Disability
In terms of female disability, the demographic groups most similar to Africans are Scotch-Irish (13.4%, a difference of 0.14%), Immigrants from Portugal (13.5%, a difference of 0.14%), Immigrants from Micronesia (13.5%, a difference of 0.17%), Pennsylvania German (13.4%, a difference of 0.20%), and Immigrants from Dominican Republic (13.4%, a difference of 0.21%).
| Demographics | Rating | Rank | Female Disability |
| Celtics | 0.0 /100 | #294 | Tragic 13.3% |
| French | 0.0 /100 | #295 | Tragic 13.3% |
| Nepalese | 0.0 /100 | #296 | Tragic 13.3% |
| Slovaks | 0.0 /100 | #297 | Tragic 13.3% |
| Nonimmigrants | 0.0 /100 | #298 | Tragic 13.4% |
| Immigrants from Dominican Republic | 0.0 /100 | #299 | Tragic 13.4% |
| Pennsylvania Germans | 0.0 /100 | #300 | Tragic 13.4% |
| Africans | 0.0 /100 | #301 | Tragic 13.4% |
| Scotch-Irish | 0.0 /100 | #302 | Tragic 13.4% |
| Immigrants from Portugal | 0.0 /100 | #303 | Tragic 13.5% |
| Immigrants from Micronesia | 0.0 /100 | #304 | Tragic 13.5% |
| Dominicans | 0.0 /100 | #305 | Tragic 13.5% |
| French Canadians | 0.0 /100 | #306 | Tragic 13.6% |
| Central American Indians | 0.0 /100 | #307 | Tragic 13.6% |
| Cree | 0.0 /100 | #308 | Tragic 13.7% |
African Female Disability Correlation Summary
| Measurement | African Data | Female Disability Data |
| Minimum | 0.21% | 5.9% |
| Maximum | 68.6% | 34.2% |
| Range | 68.4% | 28.4% |
| Mean | 19.6% | 17.0% |
| Median | 16.8% | 16.1% |
| Interquartile 25% (IQ1) | 8.0% | 13.9% |
| Interquartile 75% (IQ3) | 25.4% | 19.5% |
| Interquartile Range (IQR) | 17.4% | 5.6% |
| Standard Deviation (Sample) | 15.6% | 4.7% |
| Standard Deviation (Population) | 15.5% | 4.7% |
Correlation Details
| African Percentile | Sample Size | Female Disability |
[ 0.0% - 0.5% ] 0.21% | 253,429,068 | 12.7% |
[ 0.5% - 1.0% ] 0.72% | 105,876,753 | 12.7% |
[ 1.0% - 1.5% ] 1.21% | 58,356,139 | 13.3% |
[ 1.5% - 2.0% ] 1.72% | 21,040,320 | 13.7% |
[ 2.0% - 2.5% ] 2.23% | 10,671,568 | 13.8% |
[ 2.5% - 3.0% ] 2.68% | 7,859,315 | 13.9% |
[ 3.0% - 3.5% ] 3.20% | 4,256,666 | 13.2% |
[ 3.5% - 4.0% ] 3.71% | 1,821,752 | 14.0% |
[ 4.0% - 4.5% ] 4.22% | 1,255,473 | 14.1% |
[ 4.5% - 5.0% ] 4.82% | 1,338,800 | 14.9% |
[ 5.0% - 5.5% ] 5.26% | 830,063 | 14.9% |
[ 5.5% - 6.0% ] 5.71% | 463,169 | 15.3% |
[ 6.0% - 6.5% ] 6.31% | 407,257 | 14.8% |
[ 6.5% - 7.0% ] 6.70% | 494,978 | 12.8% |
[ 7.0% - 7.5% ] 7.25% | 287,521 | 16.7% |
[ 7.5% - 8.0% ] 7.83% | 204,564 | 17.7% |
[ 8.0% - 8.5% ] 8.19% | 161,026 | 14.6% |
[ 8.5% - 9.0% ] 8.70% | 160,425 | 15.1% |
[ 9.0% - 9.5% ] 9.27% | 166,140 | 14.5% |
[ 9.5% - 10.0% ] 9.74% | 66,996 | 12.9% |
[ 10.0% - 10.5% ] 10.22% | 137,236 | 16.7% |
[ 10.5% - 11.0% ] 10.72% | 230,762 | 12.5% |
[ 11.0% - 11.5% ] 11.34% | 9,587 | 13.6% |
[ 11.5% - 12.0% ] 11.63% | 26,234 | 15.6% |
[ 12.0% - 12.5% ] 12.24% | 12,797 | 15.3% |
[ 12.5% - 13.0% ] 12.93% | 23,227 | 16.9% |
[ 13.0% - 13.5% ] 13.31% | 4,891 | 22.6% |
[ 13.5% - 14.0% ] 13.70% | 5,197 | 19.7% |
[ 14.0% - 14.5% ] 14.17% | 15,888 | 15.0% |
[ 14.5% - 15.0% ] 14.77% | 103,882 | 13.9% |
[ 15.0% - 15.5% ] 15.28% | 22,936 | 21.2% |
[ 15.5% - 16.0% ] 15.73% | 11,906 | 16.6% |
[ 16.5% - 17.0% ] 16.77% | 6,655 | 20.0% |
[ 17.0% - 17.5% ] 17.21% | 16,222 | 22.1% |
[ 17.5% - 18.0% ] 17.74% | 2,672 | 16.5% |
[ 18.0% - 18.5% ] 18.06% | 40,302 | 16.4% |
[ 18.5% - 19.0% ] 18.74% | 19,765 | 20.3% |
[ 19.0% - 19.5% ] 19.26% | 488 | 22.4% |
[ 19.5% - 20.0% ] 19.75% | 13,660 | 17.6% |
[ 20.0% - 20.5% ] 20.24% | 3,305 | 17.2% |
[ 20.5% - 21.0% ] 20.81% | 3,239 | 13.2% |
[ 21.0% - 21.5% ] 21.32% | 15,443 | 16.4% |
[ 21.5% - 22.0% ] 21.72% | 7,110 | 22.2% |
[ 22.0% - 22.5% ] 22.26% | 283 | 34.2% |
[ 22.5% - 23.0% ] 22.80% | 9,501 | 21.2% |
[ 23.5% - 24.0% ] 23.56% | 365 | 32.9% |
[ 24.0% - 24.5% ] 24.38% | 24,894 | 19.3% |
[ 24.5% - 25.0% ] 24.91% | 273 | 21.1% |
[ 25.0% - 25.5% ] 25.29% | 779 | 16.0% |
[ 25.5% - 26.0% ] 25.54% | 881 | 12.5% |
[ 26.0% - 26.5% ] 26.24% | 2,138 | 10.4% |
[ 29.5% - 30.0% ] 29.55% | 44 | 5.9% |
[ 30.0% - 30.5% ] 30.36% | 606 | 16.1% |
[ 31.0% - 31.5% ] 31.35% | 2,485 | 15.1% |
[ 34.0% - 34.5% ] 34.01% | 1,476 | 17.0% |
[ 34.5% - 35.0% ] 34.78% | 46 | 18.2% |
[ 35.0% - 35.5% ] 35.23% | 1,286 | 17.9% |
[ 38.0% - 38.5% ] 38.10% | 4,572 | 12.5% |
[ 40.0% - 40.5% ] 40.41% | 9,613 | 24.4% |
[ 41.5% - 42.0% ] 41.76% | 613 | 16.4% |
[ 42.0% - 42.5% ] 42.31% | 338 | 16.1% |
[ 58.0% - 58.5% ] 58.19% | 574 | 27.1% |
[ 59.0% - 59.5% ] 59.02% | 549 | 19.9% |
[ 65.5% - 66.0% ] 65.55% | 479 | 23.6% |
[ 68.5% - 69.0% ] 68.60% | 86 | 18.6% |