African Wage/Income Gap
COMPARE
African
Select to Compare
Wage/Income Gap
African Wage/Income Gap
22.9%
WAGE/INCOME GAP
99.9/ 100
METRIC RATING
77th/ 347
METRIC RANK
African Wage/Income Gap Correlation Chart
The statistical analysis conducted on geographies consisting of 469,416,254 people shows a slight positive correlation between the proportion of Africans and wage/income gap percentage in the United States with a correlation coefficient (R) of 0.084 and weighted average of 22.9%. On average, for every 1% (one percent) increase in Africans within a typical geography, there is an increase of 0.066% in wage/income gap percentage.
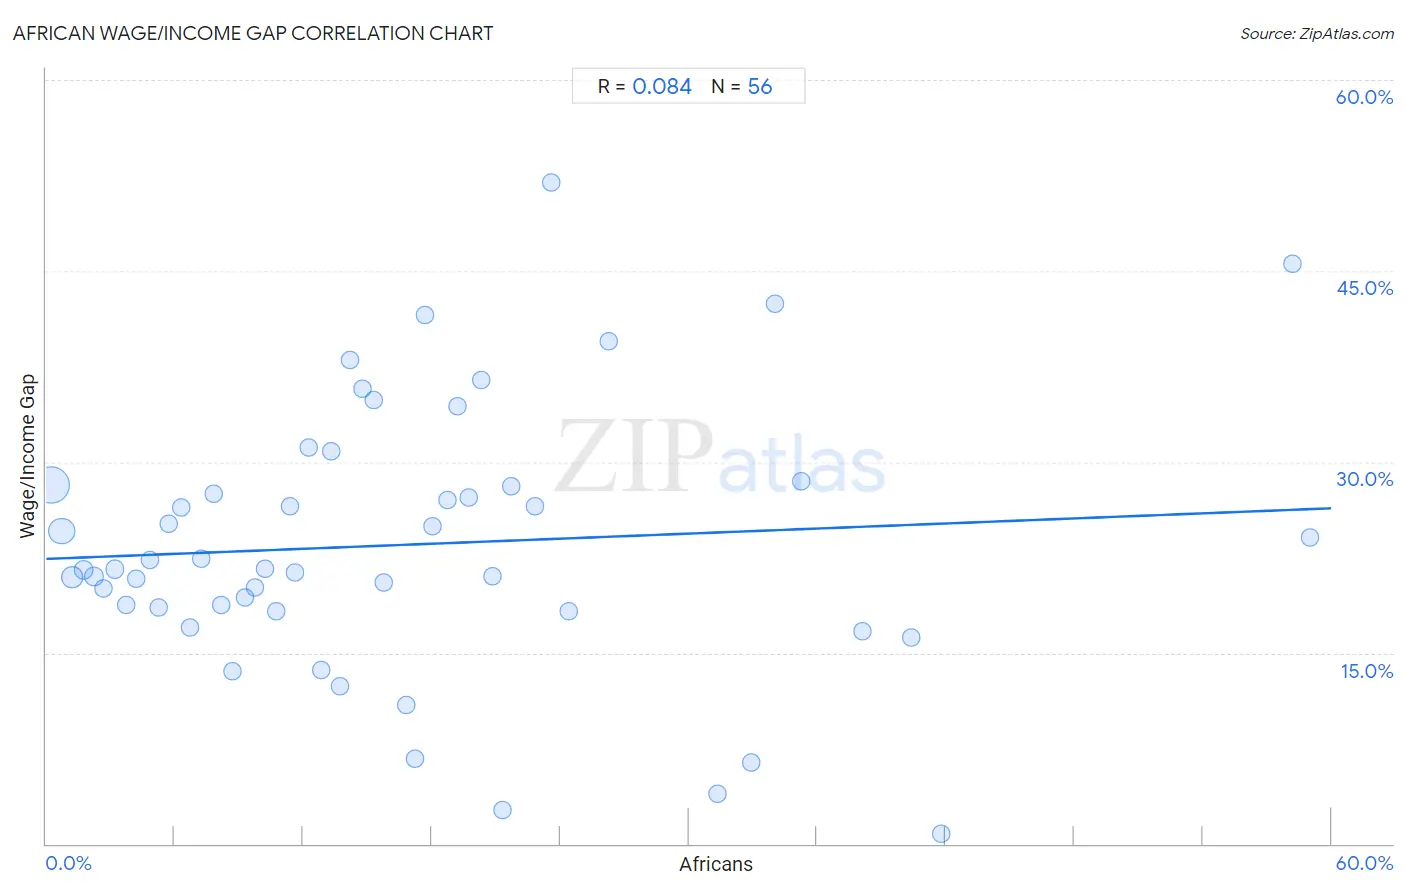
It is essential to understand that the correlation between the percentage of Africans and wage/income gap percentage does not imply a direct cause-and-effect relationship. It remains uncertain whether the presence of Africans influences an upward or downward trend in the level of wage/income gap percentage within an area, or if Africans simply ended up residing in those areas with higher or lower levels of wage/income gap percentage due to other factors.
Demographics Similar to Africans by Wage/Income Gap
In terms of wage/income gap, the demographic groups most similar to Africans are Nigerian (23.0%, a difference of 0.11%), Ecuadorian (22.9%, a difference of 0.13%), Fijian (22.9%, a difference of 0.15%), Immigrants from Nicaragua (23.0%, a difference of 0.19%), and Salvadoran (23.0%, a difference of 0.26%).
| Demographics | Rating | Rank | Wage/Income Gap |
| Immigrants from Uzbekistan | 99.9 /100 | #70 | Exceptional 22.7% |
| Immigrants from El Salvador | 99.9 /100 | #71 | Exceptional 22.8% |
| Sub-Saharan Africans | 99.9 /100 | #72 | Exceptional 22.8% |
| Immigrants from Eastern Africa | 99.9 /100 | #73 | Exceptional 22.8% |
| Immigrants from Burma/Myanmar | 99.9 /100 | #74 | Exceptional 22.8% |
| Fijians | 99.9 /100 | #75 | Exceptional 22.9% |
| Ecuadorians | 99.9 /100 | #76 | Exceptional 22.9% |
| Africans | 99.9 /100 | #77 | Exceptional 22.9% |
| Nigerians | 99.9 /100 | #78 | Exceptional 23.0% |
| Immigrants from Nicaragua | 99.9 /100 | #79 | Exceptional 23.0% |
| Salvadorans | 99.9 /100 | #80 | Exceptional 23.0% |
| Bermudans | 99.8 /100 | #81 | Exceptional 23.1% |
| Central Americans | 99.8 /100 | #82 | Exceptional 23.1% |
| Immigrants from Africa | 99.8 /100 | #83 | Exceptional 23.2% |
| Cubans | 99.7 /100 | #84 | Exceptional 23.3% |
African Wage/Income Gap Correlation Summary
| Measurement | African Data | Wage/Income Gap Data |
| Minimum | 0.21% | 0.79% |
| Maximum | 59.0% | 51.9% |
| Range | 58.8% | 51.2% |
| Mean | 16.7% | 23.5% |
| Median | 13.9% | 21.6% |
| Interquartile 25% (IQ1) | 7.0% | 18.4% |
| Interquartile 75% (IQ3) | 21.5% | 28.2% |
| Interquartile Range (IQR) | 14.5% | 9.7% |
| Standard Deviation (Sample) | 13.3% | 10.5% |
| Standard Deviation (Population) | 13.2% | 10.4% |
Correlation Details
| African Percentile | Sample Size | Wage/Income Gap |
[ 0.0% - 0.5% ] 0.21% | 253,236,757 | 28.2% |
[ 0.5% - 1.0% ] 0.72% | 105,739,640 | 24.5% |
[ 1.0% - 1.5% ] 1.21% | 58,295,204 | 20.9% |
[ 1.5% - 2.0% ] 1.72% | 21,018,739 | 21.5% |
[ 2.0% - 2.5% ] 2.23% | 10,630,050 | 21.0% |
[ 2.5% - 3.0% ] 2.68% | 7,845,458 | 20.0% |
[ 3.0% - 3.5% ] 3.20% | 4,241,794 | 21.6% |
[ 3.5% - 4.0% ] 3.71% | 1,831,425 | 18.7% |
[ 4.0% - 4.5% ] 4.22% | 1,242,589 | 20.8% |
[ 4.5% - 5.0% ] 4.82% | 1,346,423 | 22.3% |
[ 5.0% - 5.5% ] 5.26% | 815,892 | 18.6% |
[ 5.5% - 6.0% ] 5.71% | 459,656 | 25.1% |
[ 6.0% - 6.5% ] 6.31% | 402,516 | 26.4% |
[ 6.5% - 7.0% ] 6.70% | 491,579 | 17.0% |
[ 7.0% - 7.5% ] 7.25% | 286,124 | 22.4% |
[ 7.5% - 8.0% ] 7.83% | 198,286 | 27.5% |
[ 8.0% - 8.5% ] 8.18% | 155,631 | 18.8% |
[ 8.5% - 9.0% ] 8.70% | 157,830 | 13.6% |
[ 9.0% - 9.5% ] 9.27% | 165,358 | 19.4% |
[ 9.5% - 10.0% ] 9.74% | 66,254 | 20.1% |
[ 10.0% - 10.5% ] 10.22% | 136,985 | 21.6% |
[ 10.5% - 11.0% ] 10.72% | 229,297 | 18.2% |
[ 11.0% - 11.5% ] 11.36% | 8,917 | 26.5% |
[ 11.5% - 12.0% ] 11.63% | 26,332 | 21.4% |
[ 12.0% - 12.5% ] 12.23% | 11,708 | 31.2% |
[ 12.5% - 13.0% ] 12.87% | 32,217 | 13.7% |
[ 13.0% - 13.5% ] 13.31% | 4,891 | 30.9% |
[ 13.5% - 14.0% ] 13.70% | 4,393 | 12.4% |
[ 14.0% - 14.5% ] 14.16% | 14,890 | 38.0% |
[ 14.5% - 15.0% ] 14.77% | 103,594 | 35.7% |
[ 15.0% - 15.5% ] 15.29% | 21,781 | 34.9% |
[ 15.5% - 16.0% ] 15.73% | 10,278 | 20.5% |
[ 16.5% - 17.0% ] 16.79% | 7,074 | 10.9% |
[ 17.0% - 17.5% ] 17.21% | 16,222 | 6.7% |
[ 17.5% - 18.0% ] 17.66% | 1,642 | 41.5% |
[ 18.0% - 18.5% ] 18.06% | 40,302 | 25.0% |
[ 18.5% - 19.0% ] 18.74% | 19,765 | 27.0% |
[ 19.0% - 19.5% ] 19.22% | 385 | 34.4% |
[ 19.5% - 20.0% ] 19.75% | 13,325 | 27.2% |
[ 20.0% - 20.5% ] 20.30% | 2,315 | 36.5% |
[ 20.5% - 21.0% ] 20.81% | 2,849 | 21.0% |
[ 21.0% - 21.5% ] 21.32% | 15,443 | 2.6% |
[ 21.5% - 22.0% ] 21.71% | 6,846 | 28.1% |
[ 22.5% - 23.0% ] 22.79% | 8,867 | 26.5% |
[ 23.5% - 24.0% ] 23.56% | 365 | 51.9% |
[ 24.0% - 24.5% ] 24.38% | 24,795 | 18.3% |
[ 26.0% - 26.5% ] 26.24% | 2,069 | 39.5% |
[ 31.0% - 31.5% ] 31.35% | 2,485 | 4.0% |
[ 32.5% - 33.0% ] 32.93% | 334 | 6.4% |
[ 34.0% - 34.5% ] 34.01% | 1,476 | 42.4% |
[ 35.0% - 35.5% ] 35.23% | 1,286 | 28.5% |
[ 38.0% - 38.5% ] 38.10% | 4,572 | 16.7% |
[ 40.0% - 40.5% ] 40.41% | 9,613 | 16.2% |
[ 41.5% - 42.0% ] 41.76% | 613 | 0.79% |
[ 58.0% - 58.5% ] 58.19% | 574 | 45.6% |
[ 59.0% - 59.5% ] 59.02% | 549 | 24.0% |