Talihina, OK Map & Demographics
Talihina Map
Talihina Overview
$21,247
PER CAPITA INCOME
$43,571
AVG FAMILY INCOME
$35,455
AVG HOUSEHOLD INCOME
43.3%
WAGE / INCOME GAP [ % ]
56.7¢/ $1
WAGE / INCOME GAP [ $ ]
$13,838
FAMILY INCOME DEFICIT
0.45
INEQUALITY / GINI INDEX
870
TOTAL POPULATION
373
MALE POPULATION
497
FEMALE POPULATION
75.05
MALES / 100 FEMALES
133.24
FEMALES / 100 MALES
45.5
MEDIAN AGE
2.6
AVG FAMILY SIZE
2.0
AVG HOUSEHOLD SIZE
345
LABOR FORCE [ PEOPLE ]
47.0%
PERCENT IN LABOR FORCE
5.2%
UNEMPLOYMENT RATE
Talihina Zip Codes
Talihina Area Codes
Income in Talihina
Income Overview in Talihina
Per Capita Income in Talihina is $21,247, while median incomes of families and households are $43,571 and $35,455 respectively.
| Characteristic | Number | Measure |
| Per Capita Income | 870 | $21,247 |
| Median Family Income | 226 | $43,571 |
| Mean Family Income | 226 | $57,006 |
| Median Household Income | 416 | $35,455 |
| Mean Household Income | 416 | $43,082 |
| Income Deficit | 226 | $13,838 |
| Wage / Income Gap (%) | 870 | 43.33% |
| Wage / Income Gap ($) | 870 | 56.67¢ per $1 |
| Gini / Inequality Index | 870 | 0.45 |
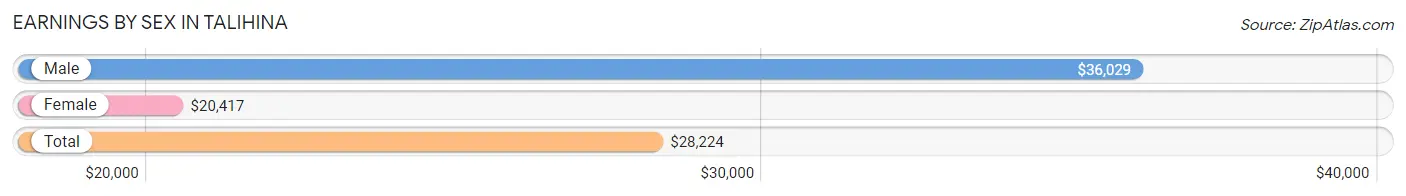
Earnings by Sex in Talihina
Average Earnings in Talihina are $28,224, $36,029 for men and $20,417 for women, a difference of 43.3%.
| Sex | Number | Average Earnings |
| Male | 156 (45.8%) | $36,029 |
| Female | 185 (54.2%) | $20,417 |
| Total | 341 (100.0%) | $28,224 |
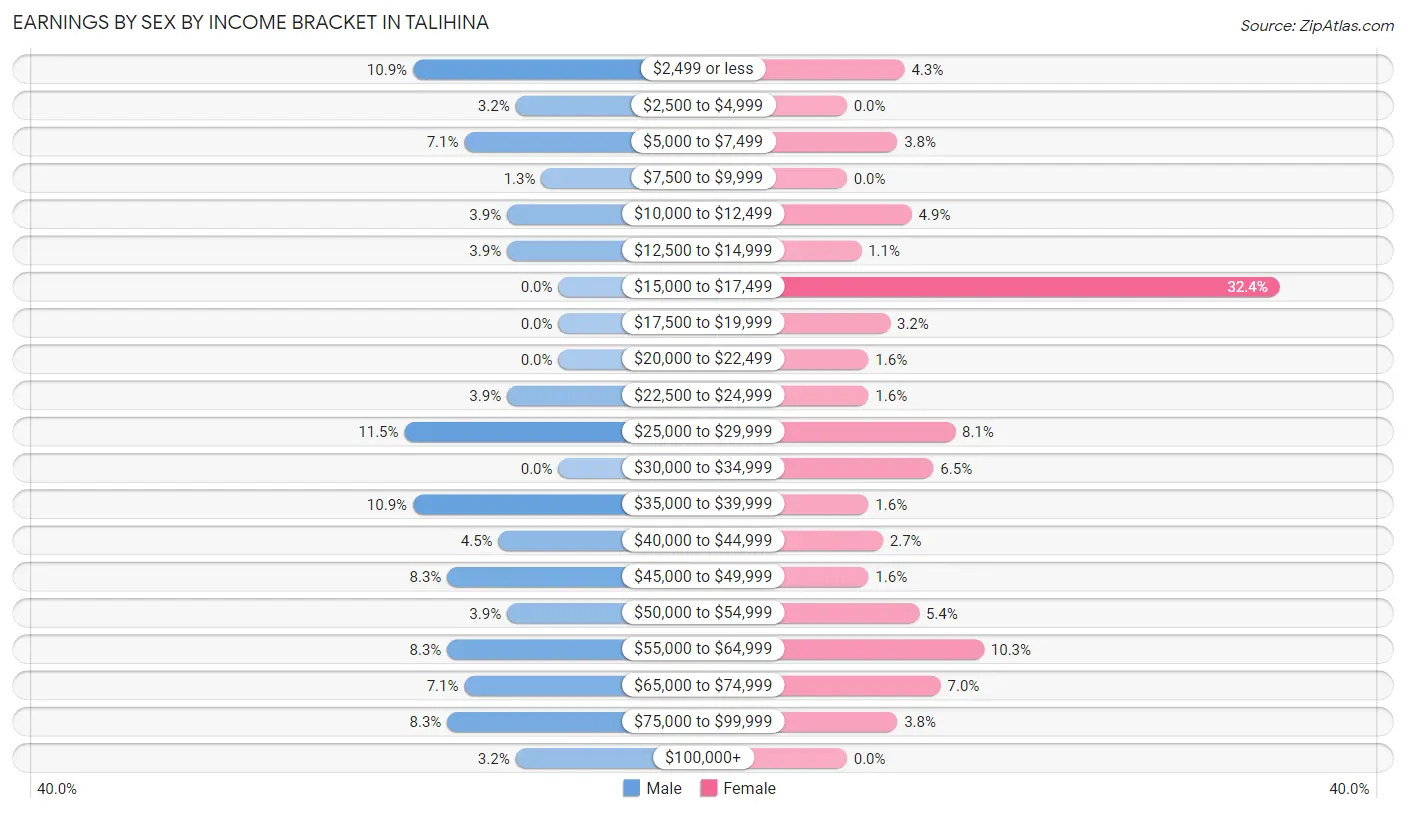
Earnings by Sex by Income Bracket in Talihina
The most common earnings brackets in Talihina are $25,000 to $29,999 for men (18 | 11.5%) and $15,000 to $17,499 for women (60 | 32.4%).
| Income | Male | Female |
| $2,499 or less | 17 (10.9%) | 8 (4.3%) |
| $2,500 to $4,999 | 5 (3.2%) | 0 (0.0%) |
| $5,000 to $7,499 | 11 (7.0%) | 7 (3.8%) |
| $7,500 to $9,999 | 2 (1.3%) | 0 (0.0%) |
| $10,000 to $12,499 | 6 (3.8%) | 9 (4.9%) |
| $12,500 to $14,999 | 6 (3.8%) | 2 (1.1%) |
| $15,000 to $17,499 | 0 (0.0%) | 60 (32.4%) |
| $17,500 to $19,999 | 0 (0.0%) | 6 (3.2%) |
| $20,000 to $22,499 | 0 (0.0%) | 3 (1.6%) |
| $22,500 to $24,999 | 6 (3.8%) | 3 (1.6%) |
| $25,000 to $29,999 | 18 (11.5%) | 15 (8.1%) |
| $30,000 to $34,999 | 0 (0.0%) | 12 (6.5%) |
| $35,000 to $39,999 | 17 (10.9%) | 3 (1.6%) |
| $40,000 to $44,999 | 7 (4.5%) | 5 (2.7%) |
| $45,000 to $49,999 | 13 (8.3%) | 3 (1.6%) |
| $50,000 to $54,999 | 6 (3.8%) | 10 (5.4%) |
| $55,000 to $64,999 | 13 (8.3%) | 19 (10.3%) |
| $65,000 to $74,999 | 11 (7.0%) | 13 (7.0%) |
| $75,000 to $99,999 | 13 (8.3%) | 7 (3.8%) |
| $100,000+ | 5 (3.2%) | 0 (0.0%) |
| Total | 156 (100.0%) | 185 (100.0%) |
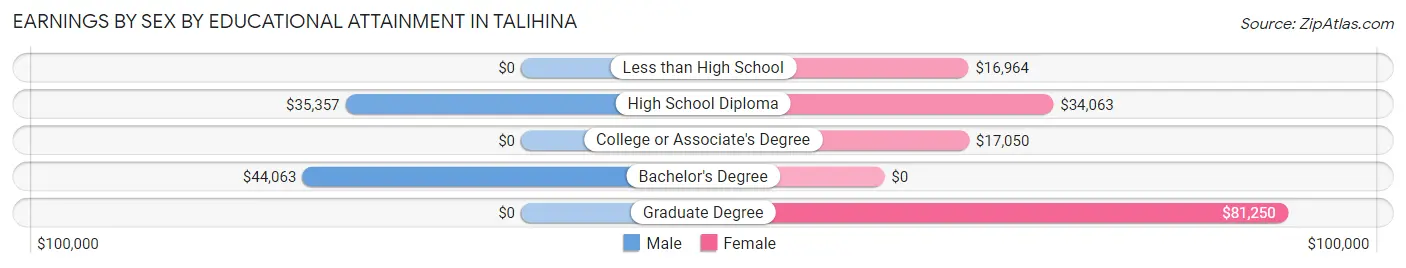
Earnings by Sex by Educational Attainment in Talihina
Average earnings in Talihina are $36,471 for men and $20,417 for women, a difference of 44.0%. Men with an educational attainment of bachelor's degree enjoy the highest average annual earnings of $44,063, while those with high school diploma education earn the least with $35,357. Women with an educational attainment of graduate degree earn the most with the average annual earnings of $81,250, while those with less than high school education have the smallest earnings of $16,964.
| Educational Attainment | Male Income | Female Income |
| Less than High School | - | - |
| High School Diploma | $35,357 | $34,063 |
| College or Associate's Degree | - | - |
| Bachelor's Degree | $44,063 | $0 |
| Graduate Degree | - | - |
| Total | $36,471 | $20,417 |
Family Income in Talihina
Family Income Brackets in Talihina
According to the Talihina family income data, there are 82 families falling into the $35,000 to $49,999 income range, which is the most common income bracket and makes up 36.3% of all families. Conversely, the $150,000 to $199,999 income bracket is the least frequent group with only 2 families (0.9%) belonging to this category.
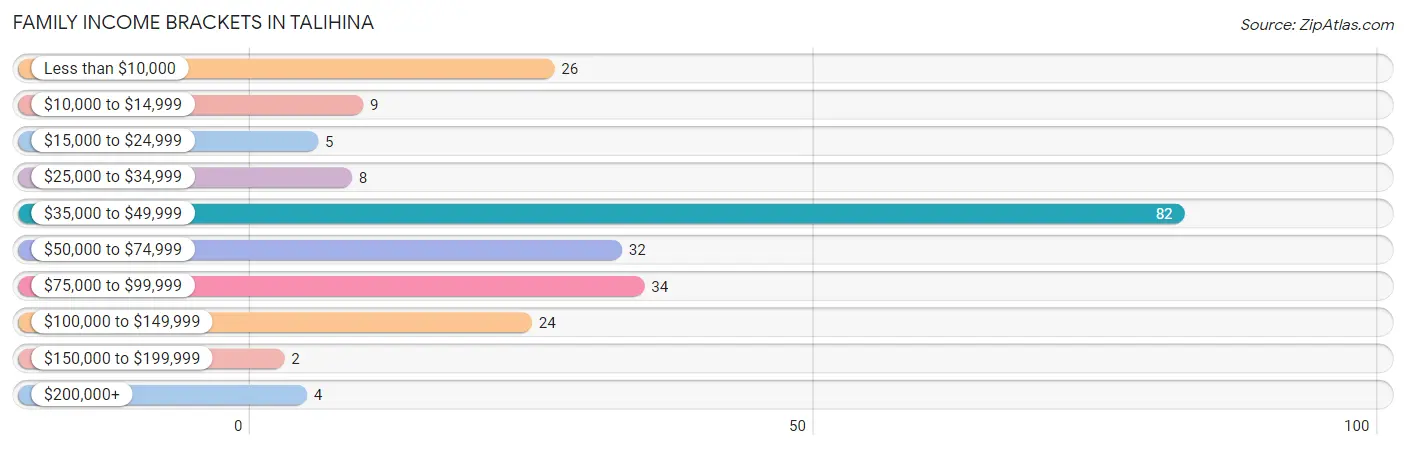
| Income Bracket | # Families | % Families |
| Less than $10,000 | 26 | 11.5% |
| $10,000 to $14,999 | 9 | 4.0% |
| $15,000 to $24,999 | 5 | 2.2% |
| $25,000 to $34,999 | 8 | 3.5% |
| $35,000 to $49,999 | 82 | 36.3% |
| $50,000 to $74,999 | 32 | 14.2% |
| $75,000 to $99,999 | 34 | 15.0% |
| $100,000 to $149,999 | 24 | 10.6% |
| $150,000 to $199,999 | 2 | 0.9% |
| $200,000+ | 4 | 1.8% |
Family Income by Famaliy Size in Talihina
5-person families (14 | 6.2%) account for the highest median family income in Talihina with $85,625 per family, while 3-person families (42 | 18.6%) have the highest median income of $23,750 per family member.
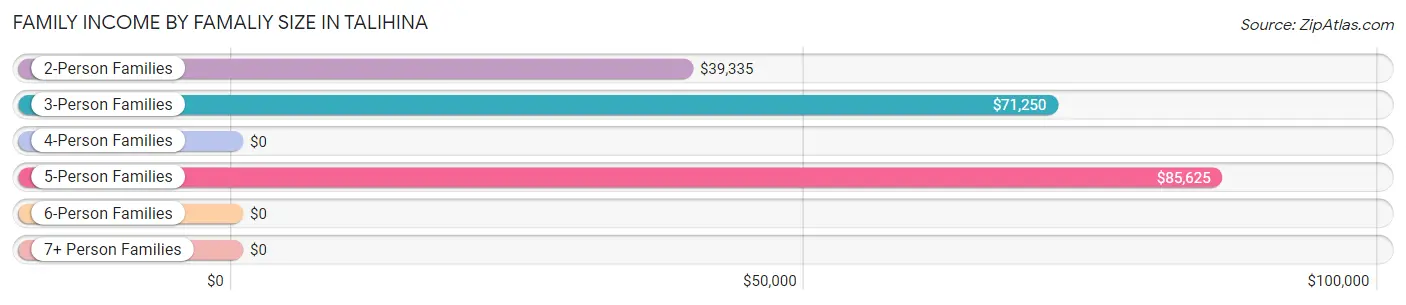
| Income Bracket | # Families | Median Income |
| 2-Person Families | 149 (65.9%) | $39,335 |
| 3-Person Families | 42 (18.6%) | $71,250 |
| 4-Person Families | 10 (4.4%) | $0 |
| 5-Person Families | 14 (6.2%) | $85,625 |
| 6-Person Families | 8 (3.5%) | $0 |
| 7+ Person Families | 3 (1.3%) | $0 |
| Total | 226 (100.0%) | $43,571 |
Family Income by Number of Earners in Talihina
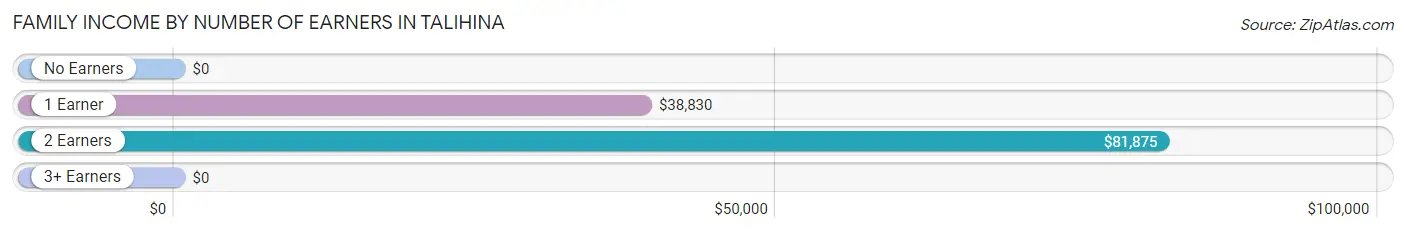
| Number of Earners | # Families | Median Income |
| No Earners | 43 (19.0%) | $0 |
| 1 Earner | 112 (49.6%) | $38,830 |
| 2 Earners | 66 (29.2%) | $81,875 |
| 3+ Earners | 5 (2.2%) | $0 |
| Total | 226 (100.0%) | $43,571 |
Household Income in Talihina
Household Income Brackets in Talihina
With 93 households falling in the category, the $10,000 to $14,999 income range is the most frequent in Talihina, accounting for 22.4% of all households. In contrast, only 2 households (0.5%) fall into the $150,000 to $199,999 income bracket, making it the least populous group.
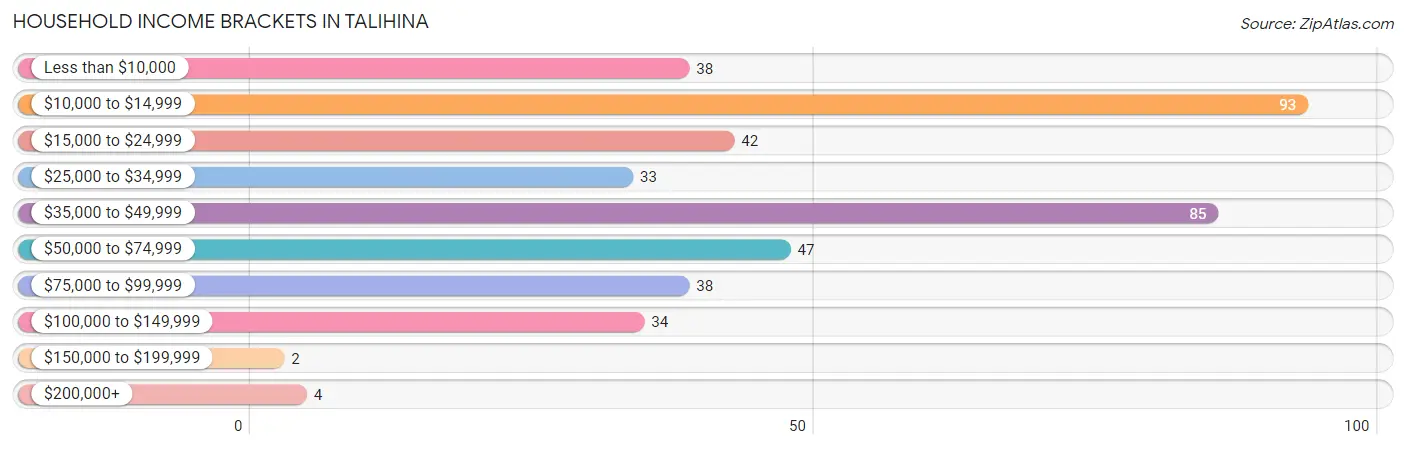
| Income Bracket | # Households | % Households |
| Less than $10,000 | 38 | 9.1% |
| $10,000 to $14,999 | 93 | 22.4% |
| $15,000 to $24,999 | 42 | 10.1% |
| $25,000 to $34,999 | 33 | 7.9% |
| $35,000 to $49,999 | 85 | 20.4% |
| $50,000 to $74,999 | 47 | 11.3% |
| $75,000 to $99,999 | 38 | 9.1% |
| $100,000 to $149,999 | 34 | 8.2% |
| $150,000 to $199,999 | 2 | 0.5% |
| $200,000+ | 4 | 1.0% |
Household Income by Householder Age in Talihina
The median household income in Talihina is $35,455, with the highest median household income of $59,583 found in the 25 to 44 years age bracket for the primary householder. A total of 113 households (27.2%) fall into this category.
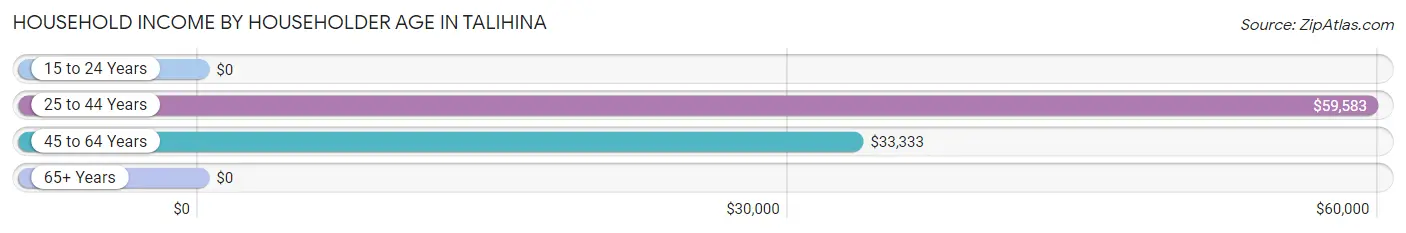
| Income Bracket | # Households | Median Income |
| 15 to 24 Years | 0 (0.0%) | $0 |
| 25 to 44 Years | 113 (27.2%) | $59,583 |
| 45 to 64 Years | 112 (26.9%) | $33,333 |
| 65+ Years | 191 (45.9%) | $0 |
| Total | 416 (100.0%) | $35,455 |
Poverty in Talihina
Income Below Poverty by Sex and Age in Talihina
With 28.9% poverty level for males and 29.3% for females among the residents of Talihina, under 5 year old males and 75 year old and over females are the most vulnerable to poverty, with 11 males (64.7%) and 60 females (60.0%) in their respective age groups living below the poverty level.
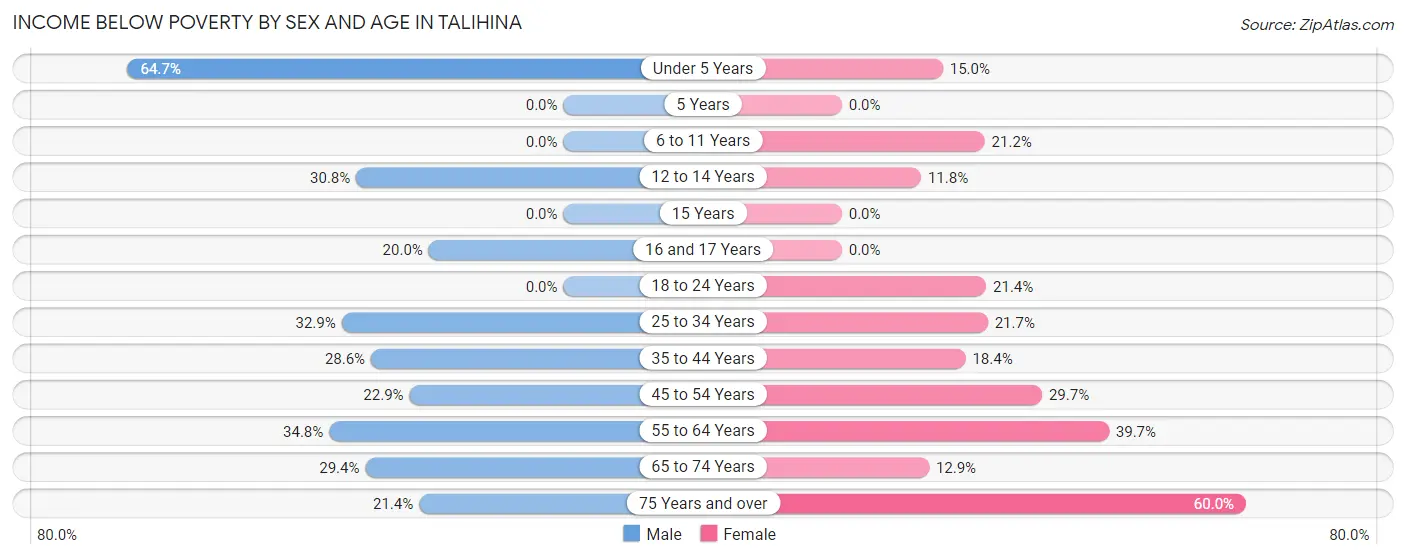
| Age Bracket | Male | Female |
| Under 5 Years | 11 (64.7%) | 3 (15.0%) |
| 5 Years | 0 (0.0%) | 0 (0.0%) |
| 6 to 11 Years | 0 (0.0%) | 7 (21.2%) |
| 12 to 14 Years | 8 (30.8%) | 2 (11.8%) |
| 15 Years | 0 (0.0%) | 0 (0.0%) |
| 16 and 17 Years | 4 (20.0%) | 0 (0.0%) |
| 18 to 24 Years | 0 (0.0%) | 3 (21.4%) |
| 25 to 34 Years | 27 (32.9%) | 13 (21.7%) |
| 35 to 44 Years | 14 (28.6%) | 9 (18.4%) |
| 45 to 54 Years | 8 (22.9%) | 11 (29.7%) |
| 55 to 64 Years | 16 (34.8%) | 23 (39.7%) |
| 65 to 74 Years | 10 (29.4%) | 11 (12.9%) |
| 75 Years and over | 3 (21.4%) | 60 (60.0%) |
| Total | 101 (28.9%) | 142 (29.3%) |
Income Above Poverty by Sex and Age in Talihina
According to the poverty statistics in Talihina, males aged 6 to 11 years and females aged 15 years are the age groups that are most secure financially, with 100.0% of males and 100.0% of females in these age groups living above the poverty line.
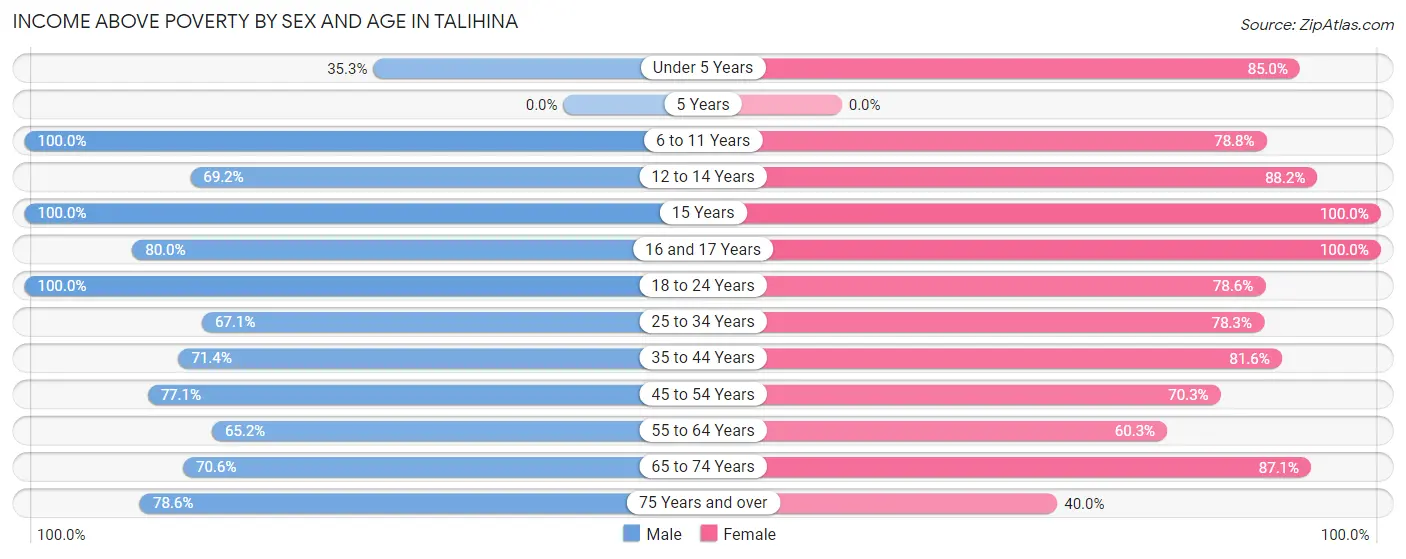
| Age Bracket | Male | Female |
| Under 5 Years | 6 (35.3%) | 17 (85.0%) |
| 5 Years | 0 (0.0%) | 0 (0.0%) |
| 6 to 11 Years | 16 (100.0%) | 26 (78.8%) |
| 12 to 14 Years | 18 (69.2%) | 15 (88.2%) |
| 15 Years | 3 (100.0%) | 4 (100.0%) |
| 16 and 17 Years | 16 (80.0%) | 7 (100.0%) |
| 18 to 24 Years | 7 (100.0%) | 11 (78.6%) |
| 25 to 34 Years | 55 (67.1%) | 47 (78.3%) |
| 35 to 44 Years | 35 (71.4%) | 40 (81.6%) |
| 45 to 54 Years | 27 (77.1%) | 26 (70.3%) |
| 55 to 64 Years | 30 (65.2%) | 35 (60.3%) |
| 65 to 74 Years | 24 (70.6%) | 74 (87.1%) |
| 75 Years and over | 11 (78.6%) | 40 (40.0%) |
| Total | 248 (71.1%) | 342 (70.7%) |
Income Below Poverty Among Married-Couple Families in Talihina
The poverty statistics for married-couple families in Talihina show that 12.3% or 14 of the total 114 families live below the poverty line. Families with 1 or 2 children have the highest poverty rate of 14.7%, comprising of 5 families. On the other hand, families with 3 or 4 children have the lowest poverty rate of 0.0%, which includes 0 families.
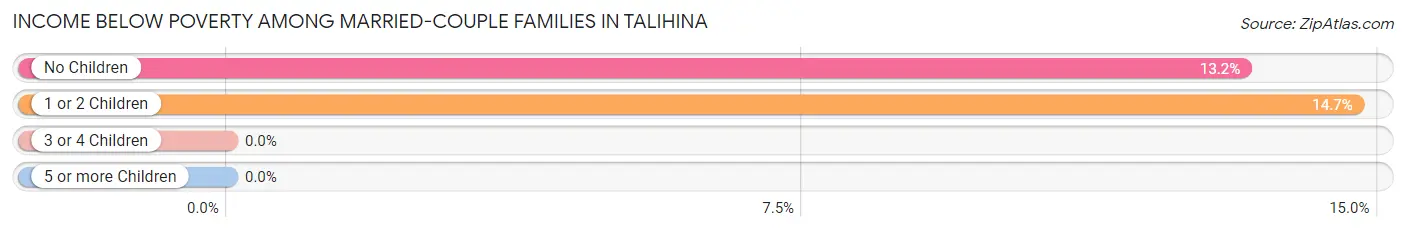
| Children | Above Poverty | Below Poverty |
| No Children | 59 (86.8%) | 9 (13.2%) |
| 1 or 2 Children | 29 (85.3%) | 5 (14.7%) |
| 3 or 4 Children | 12 (100.0%) | 0 (0.0%) |
| 5 or more Children | 0 (0.0%) | 0 (0.0%) |
| Total | 100 (87.7%) | 14 (12.3%) |
Income Below Poverty Among Single-Parent Households in Talihina
According to the poverty data in Talihina, 66.7% or 18 single-father households and 9.4% or 8 single-mother households are living below the poverty line. Among single-father households, those with 1 or 2 children have the highest poverty rate, with 18 households (81.8%) experiencing poverty. Likewise, among single-mother households, those with 1 or 2 children have the highest poverty rate, with 8 households (38.1%) falling below the poverty line.
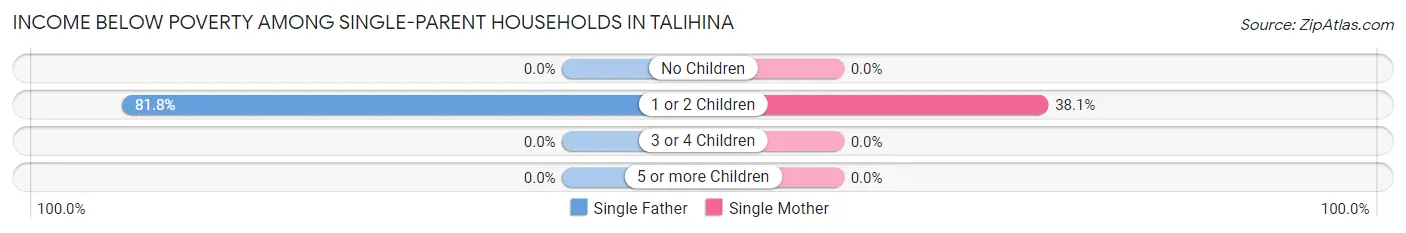
| Children | Single Father | Single Mother |
| No Children | 0 (0.0%) | 0 (0.0%) |
| 1 or 2 Children | 18 (81.8%) | 8 (38.1%) |
| 3 or 4 Children | 0 (0.0%) | 0 (0.0%) |
| 5 or more Children | 0 (0.0%) | 0 (0.0%) |
| Total | 18 (66.7%) | 8 (9.4%) |
Income Below Poverty Among Married-Couple vs Single-Parent Households in Talihina
The poverty data for Talihina shows that 14 of the married-couple family households (12.3%) and 26 of the single-parent households (23.2%) are living below the poverty level. Within the married-couple family households, those with 1 or 2 children have the highest poverty rate, with 5 households (14.7%) falling below the poverty line. Among the single-parent households, those with 1 or 2 children have the highest poverty rate, with 26 household (60.5%) living below poverty.
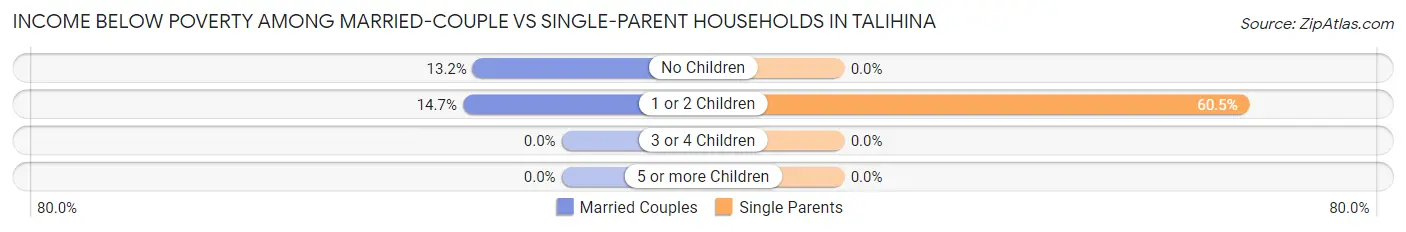
| Children | Married-Couple Families | Single-Parent Households |
| No Children | 9 (13.2%) | 0 (0.0%) |
| 1 or 2 Children | 5 (14.7%) | 26 (60.5%) |
| 3 or 4 Children | 0 (0.0%) | 0 (0.0%) |
| 5 or more Children | 0 (0.0%) | 0 (0.0%) |
| Total | 14 (12.3%) | 26 (23.2%) |
Race in Talihina
The most populous races in Talihina are White / Caucasian (523 | 60.1%), Native / Alaskan (227 | 26.1%), and Two or more Races (85 | 9.8%).
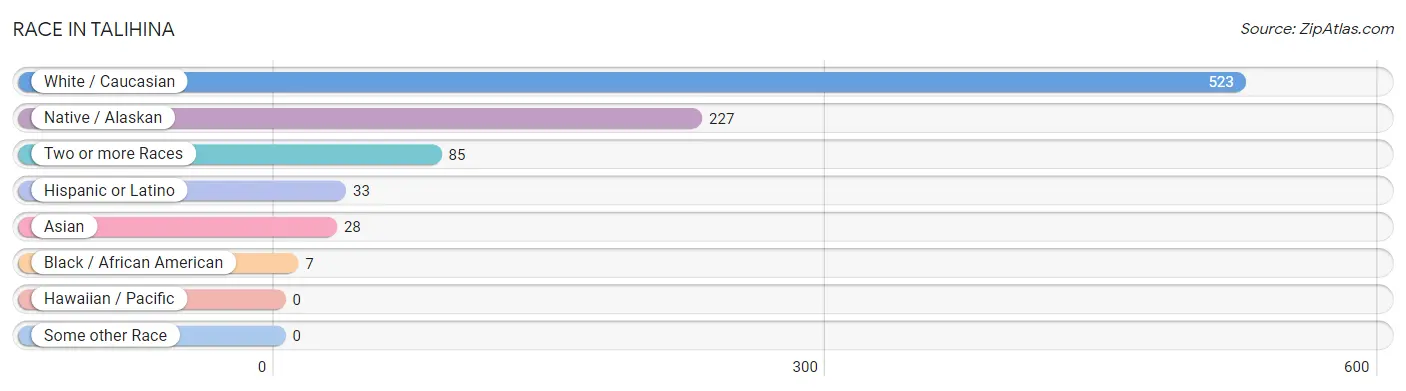
| Race | # Population | % Population |
| Asian | 28 | 3.2% |
| Black / African American | 7 | 0.8% |
| Hawaiian / Pacific | 0 | 0.0% |
| Hispanic or Latino | 33 | 3.8% |
| Native / Alaskan | 227 | 26.1% |
| White / Caucasian | 523 | 60.1% |
| Two or more Races | 85 | 9.8% |
| Some other Race | 0 | 0.0% |
| Total | 870 | 100.0% |
Ancestry in Talihina
The most populous ancestries reported in Talihina are Choctaw (243 | 27.9%), English (157 | 18.0%), Irish (119 | 13.7%), German (115 | 13.2%), and Cherokee (52 | 6.0%), together accounting for 78.9% of all Talihina residents.
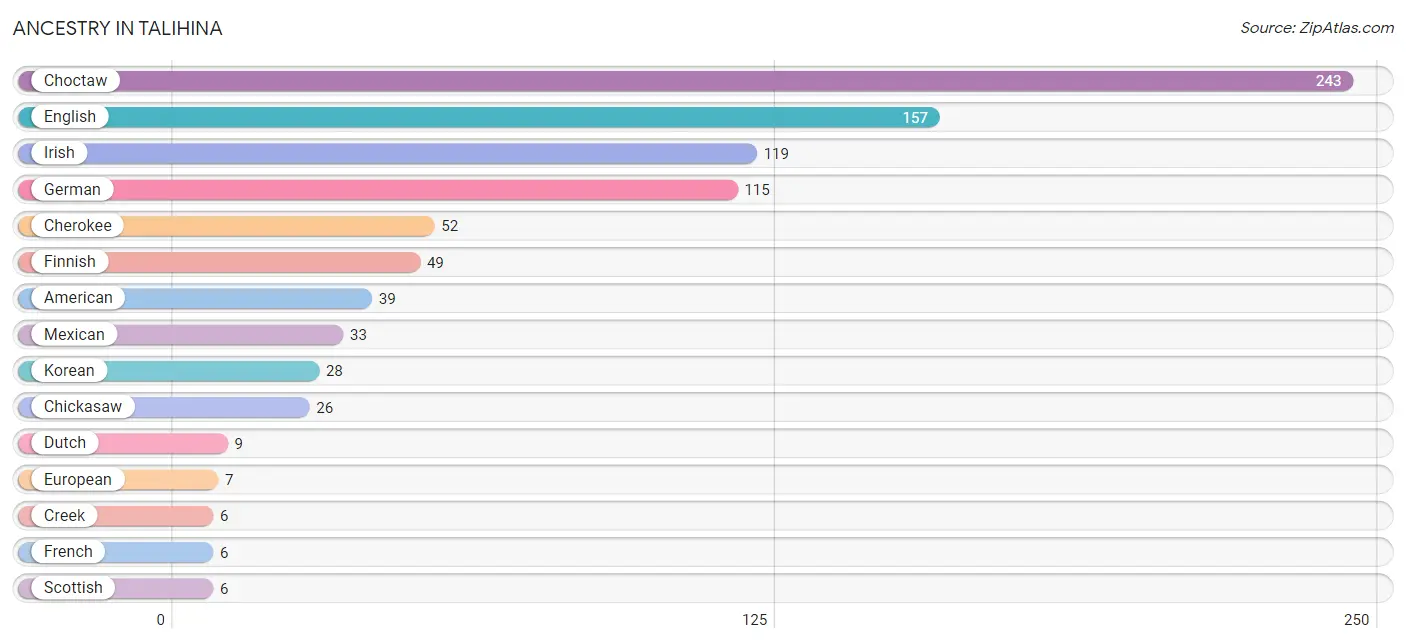
| Ancestry | # Population | % Population |
| American | 39 | 4.5% |
| Austrian | 4 | 0.5% |
| Cherokee | 52 | 6.0% |
| Chickasaw | 26 | 3.0% |
| Choctaw | 243 | 27.9% |
| Creek | 6 | 0.7% |
| Dutch | 9 | 1.0% |
| English | 157 | 18.0% |
| European | 7 | 0.8% |
| Finnish | 49 | 5.6% |
| French | 6 | 0.7% |
| German | 115 | 13.2% |
| Irish | 119 | 13.7% |
| Korean | 28 | 3.2% |
| Mexican | 33 | 3.8% |
| Potawatomi | 3 | 0.3% |
| Russian | 5 | 0.6% |
| Scandinavian | 3 | 0.3% |
| Scottish | 6 | 0.7% |
| Ukrainian | 5 | 0.6% | View All 20 Rows |
Immigrants in Talihina
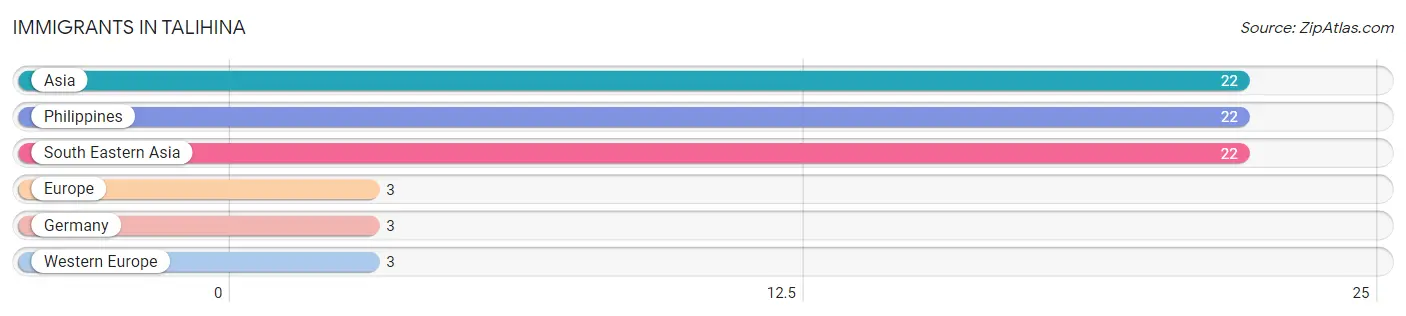
The most numerous immigrant groups reported in Talihina came from Asia (22 | 2.5%), Philippines (22 | 2.5%), South Eastern Asia (22 | 2.5%), Europe (3 | 0.3%), and Germany (3 | 0.3%), together accounting for 8.3% of all Talihina residents.
| Immigration Origin | # Population | % Population |
| Asia | 22 | 2.5% |
| Europe | 3 | 0.3% |
| Germany | 3 | 0.3% |
| Philippines | 22 | 2.5% |
| South Eastern Asia | 22 | 2.5% |
| Western Europe | 3 | 0.3% | View All 6 Rows |
Sex and Age in Talihina
Sex and Age in Talihina
The most populous age groups in Talihina are 25 to 29 Years (44 | 11.8%) for men and 65 to 69 Years (75 | 15.1%) for women.
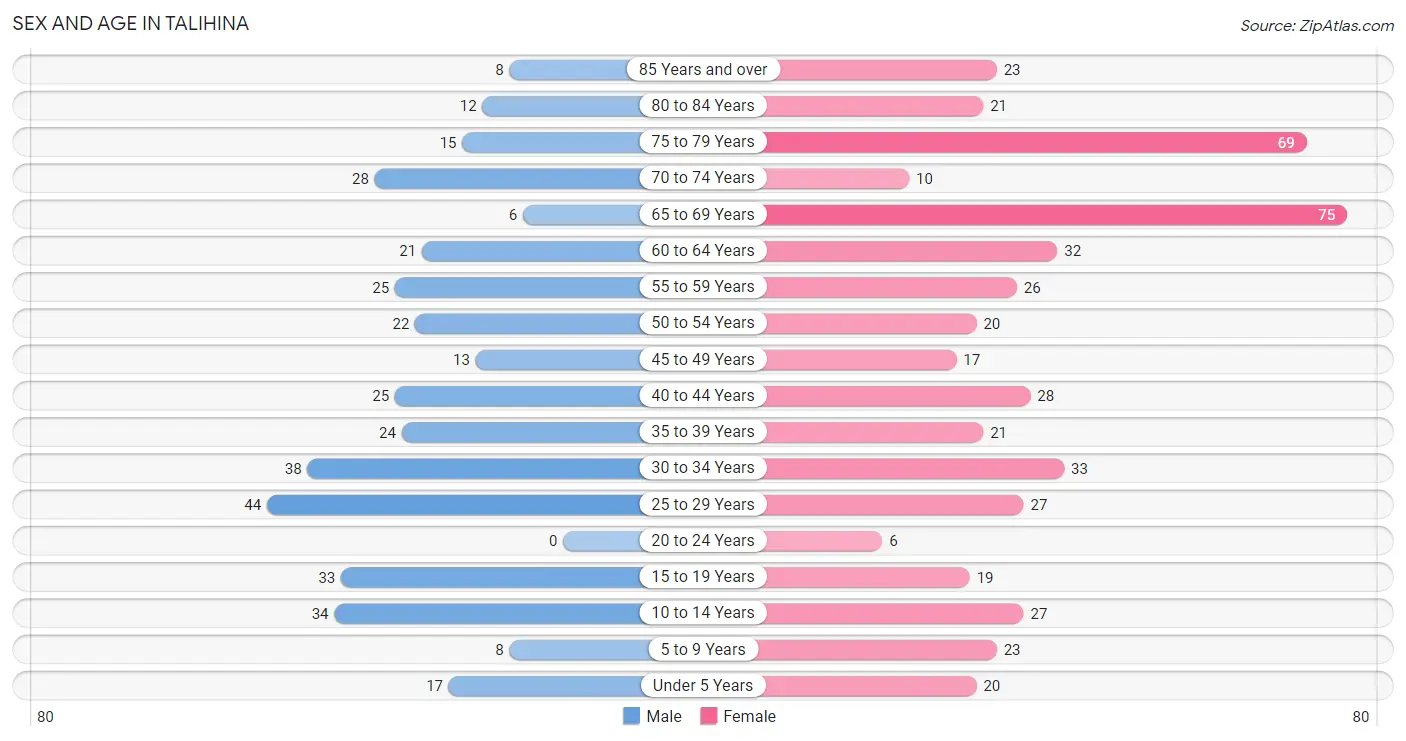
| Age Bracket | Male | Female |
| Under 5 Years | 17 (4.6%) | 20 (4.0%) |
| 5 to 9 Years | 8 (2.1%) | 23 (4.6%) |
| 10 to 14 Years | 34 (9.1%) | 27 (5.4%) |
| 15 to 19 Years | 33 (8.8%) | 19 (3.8%) |
| 20 to 24 Years | 0 (0.0%) | 6 (1.2%) |
| 25 to 29 Years | 44 (11.8%) | 27 (5.4%) |
| 30 to 34 Years | 38 (10.2%) | 33 (6.6%) |
| 35 to 39 Years | 24 (6.4%) | 21 (4.2%) |
| 40 to 44 Years | 25 (6.7%) | 28 (5.6%) |
| 45 to 49 Years | 13 (3.5%) | 17 (3.4%) |
| 50 to 54 Years | 22 (5.9%) | 20 (4.0%) |
| 55 to 59 Years | 25 (6.7%) | 26 (5.2%) |
| 60 to 64 Years | 21 (5.6%) | 32 (6.4%) |
| 65 to 69 Years | 6 (1.6%) | 75 (15.1%) |
| 70 to 74 Years | 28 (7.5%) | 10 (2.0%) |
| 75 to 79 Years | 15 (4.0%) | 69 (13.9%) |
| 80 to 84 Years | 12 (3.2%) | 21 (4.2%) |
| 85 Years and over | 8 (2.1%) | 23 (4.6%) |
| Total | 373 (100.0%) | 497 (100.0%) |
Families and Households in Talihina
Median Family Size in Talihina
The median family size in Talihina is 2.62 persons per family, with married-couple families (114 | 50.4%) accounting for the largest median family size of 3.05 persons per family. On the other hand, single male/father families (27 | 11.9%) represent the smallest median family size with 2.07 persons per family.
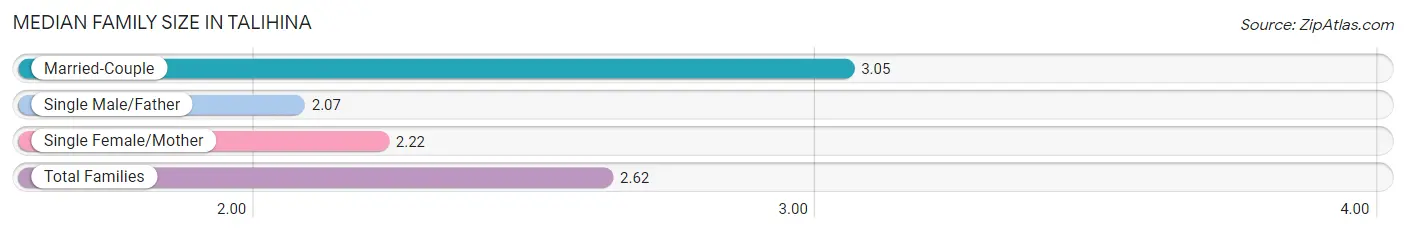
| Family Type | # Families | Family Size |
| Married-Couple | 114 (50.4%) | 3.05 |
| Single Male/Father | 27 (11.9%) | 2.07 |
| Single Female/Mother | 85 (37.6%) | 2.22 |
| Total Families | 226 (100.0%) | 2.62 |
Median Household Size in Talihina
The median household size in Talihina is 2.00 persons per household, with married-couple households (114 | 27.4%) accounting for the largest median household size of 3.05 persons per household. non-family households (190 | 45.7%) represent the smallest median household size with 1.19 persons per household.
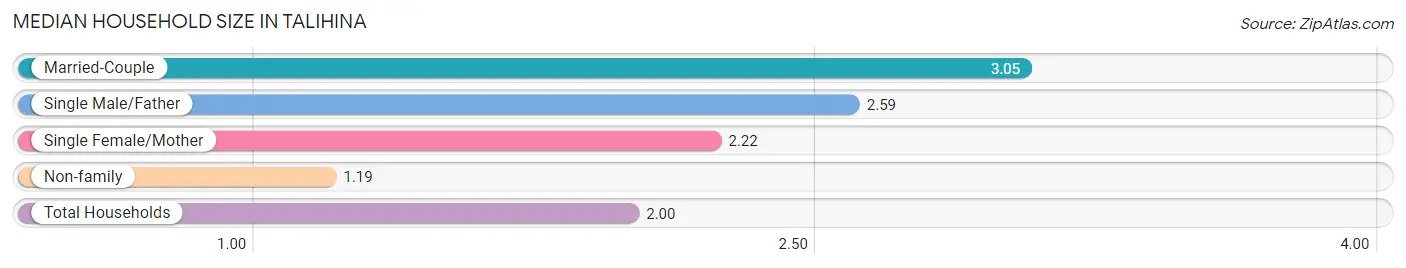
| Household Type | # Households | Household Size |
| Married-Couple | 114 (27.4%) | 3.05 |
| Single Male/Father | 27 (6.5%) | 2.59 |
| Single Female/Mother | 85 (20.4%) | 2.22 |
| Non-family | 190 (45.7%) | 1.19 |
| Total Households | 416 (100.0%) | 2.00 |
Household Size by Marriage Status in Talihina
Out of a total of 416 households in Talihina, 226 (54.3%) are family households, while 190 (45.7%) are nonfamily households. The most numerous type of family households are 2-person households, comprising 135, and the most common type of nonfamily households are 1-person households, comprising 165.
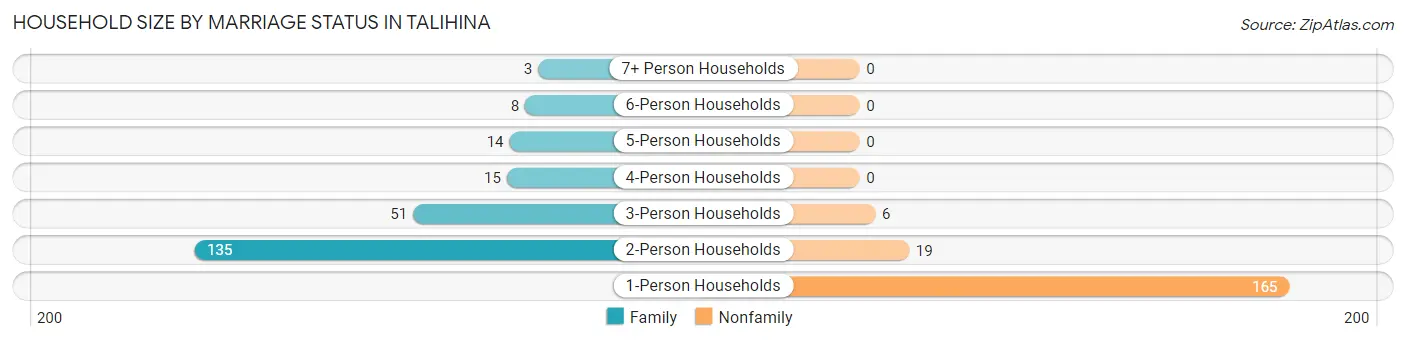
| Household Size | Family Households | Nonfamily Households |
| 1-Person Households | - | 165 (39.7%) |
| 2-Person Households | 135 (32.5%) | 19 (4.6%) |
| 3-Person Households | 51 (12.3%) | 6 (1.4%) |
| 4-Person Households | 15 (3.6%) | 0 (0.0%) |
| 5-Person Households | 14 (3.4%) | 0 (0.0%) |
| 6-Person Households | 8 (1.9%) | 0 (0.0%) |
| 7+ Person Households | 3 (0.7%) | 0 (0.0%) |
| Total | 226 (54.3%) | 190 (45.7%) |
Female Fertility in Talihina
Fertility by Age in Talihina
Average fertility rate in Talihina is 140.0 births per 1,000 women. Women in the age bracket of 20 to 34 years have the highest fertility rate with 258.0 births per 1,000 women. Women in the age bracket of 20 to 34 years acount for 77.3% of all women with births.
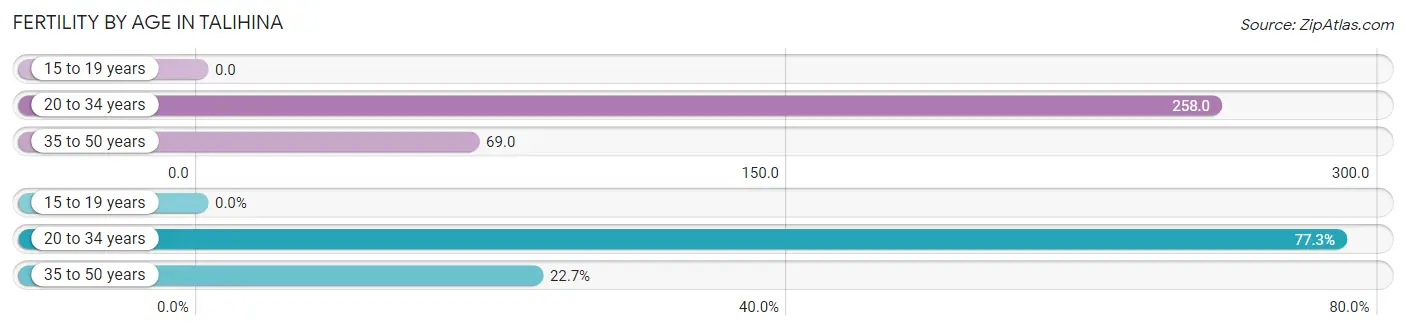
| Age Bracket | Women with Births | Births / 1,000 Women |
| 15 to 19 years | 0 (0.0%) | 0.0 |
| 20 to 34 years | 17 (77.3%) | 258.0 |
| 35 to 50 years | 5 (22.7%) | 69.0 |
| Total | 22 (100.0%) | 140.0 |
Fertility by Age by Marriage Status in Talihina
81.8% of women with births (22) in Talihina are married. The highest percentage of unmarried women with births falls into 20 to 34 years age bracket with 23.5% of them unmarried at the time of birth, while the lowest percentage of unmarried women with births belong to 35 to 50 years age bracket with 0.0% of them unmarried.
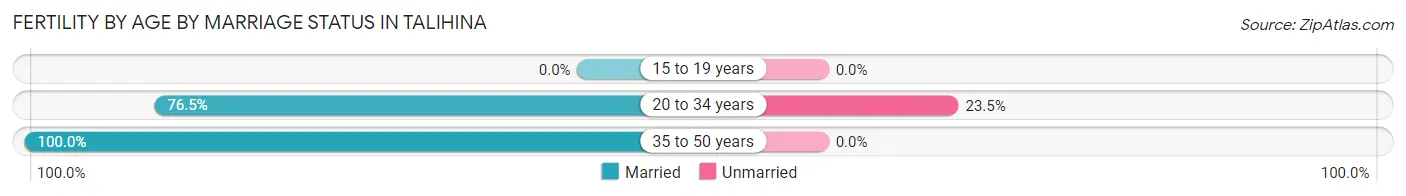
| Age Bracket | Married | Unmarried |
| 15 to 19 years | 0 (0.0%) | 0 (0.0%) |
| 20 to 34 years | 13 (76.5%) | 4 (23.5%) |
| 35 to 50 years | 5 (100.0%) | 0 (0.0%) |
| Total | 18 (81.8%) | 4 (18.2%) |
Fertility by Education in Talihina
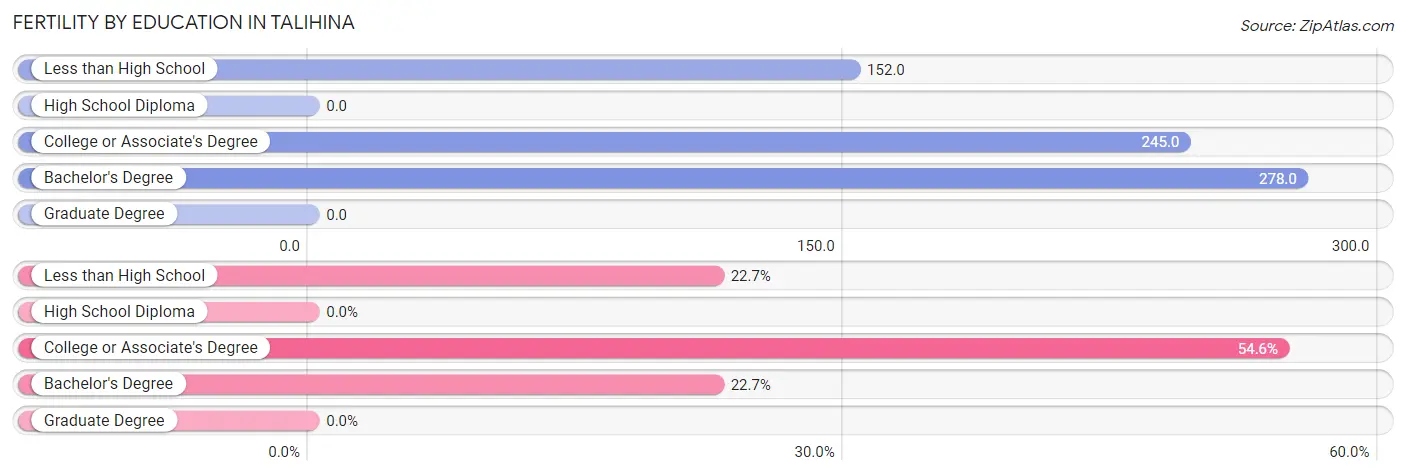
| Educational Attainment | Women with Births | Births / 1,000 Women |
| Less than High School | 5 (22.7%) | 152.0 |
| High School Diploma | 0 (0.0%) | 0.0 |
| College or Associate's Degree | 12 (54.5%) | 245.0 |
| Bachelor's Degree | 5 (22.7%) | 278.0 |
| Graduate Degree | 0 (0.0%) | 0.0 |
| Total | 22 (100.0%) | 140.0 |
Fertility by Education by Marriage Status in Talihina
18.2% of women with births in Talihina are unmarried. Women with the educational attainment of less than high school are most likely to be married with 100.0% of them married at childbirth, while women with the educational attainment of college or associate's degree are least likely to be married with 33.3% of them unmarried at childbirth.
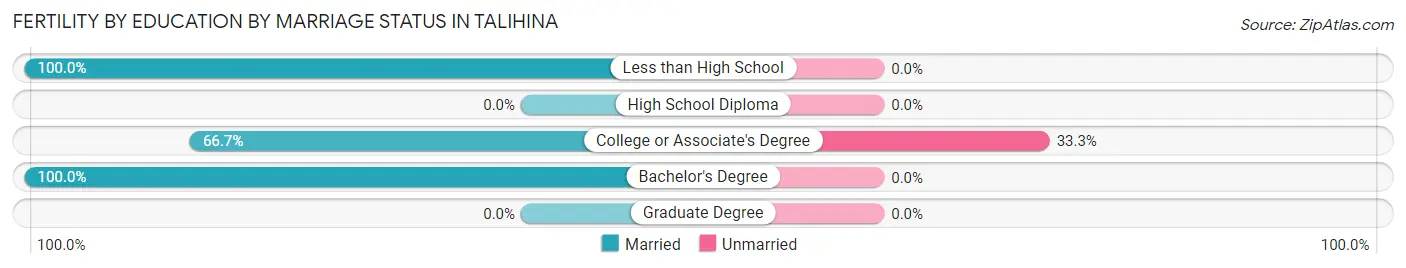
| Educational Attainment | Married | Unmarried |
| Less than High School | 5 (100.0%) | 0 (0.0%) |
| High School Diploma | 0 (0.0%) | 0 (0.0%) |
| College or Associate's Degree | 8 (66.7%) | 4 (33.3%) |
| Bachelor's Degree | 5 (100.0%) | 0 (0.0%) |
| Graduate Degree | 0 (0.0%) | 0 (0.0%) |
| Total | 18 (81.8%) | 4 (18.2%) |
Employment Characteristics in Talihina
Employment by Class of Employer in Talihina
Among the 316 employed individuals in Talihina, private company employees (121 | 38.3%), self-employed (not incorporated) (85 | 26.9%), and not-for-profit organizations (30 | 9.5%) make up the most common classes of employment.
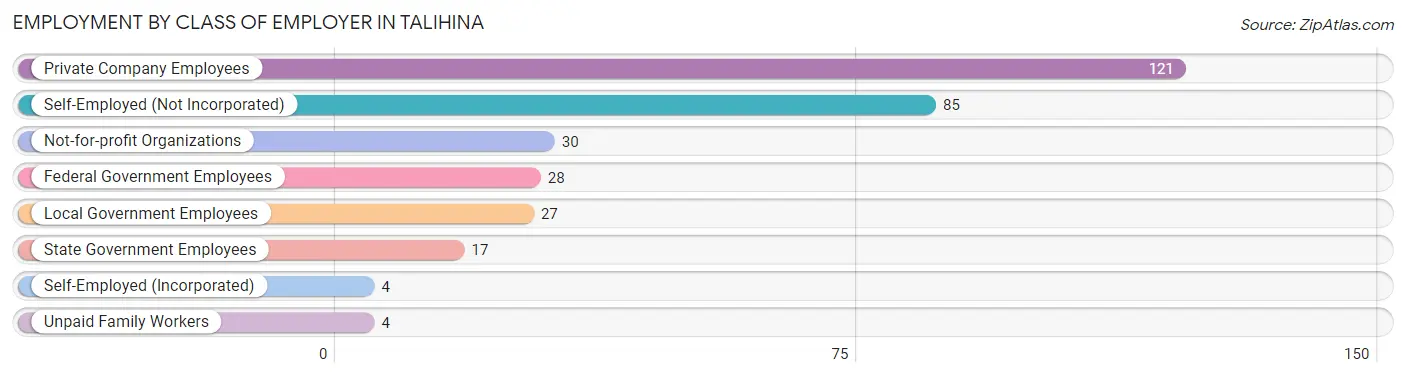
| Employer Class | # Employees | % Employees |
| Private Company Employees | 121 | 38.3% |
| Self-Employed (Incorporated) | 4 | 1.3% |
| Self-Employed (Not Incorporated) | 85 | 26.9% |
| Not-for-profit Organizations | 30 | 9.5% |
| Local Government Employees | 27 | 8.5% |
| State Government Employees | 17 | 5.4% |
| Federal Government Employees | 28 | 8.9% |
| Unpaid Family Workers | 4 | 1.3% |
| Total | 316 | 100.0% |
Employment Status by Age in Talihina
According to the labor force statistics for Talihina, out of the total population over 16 years of age (734), 47.0% or 345 individuals are in the labor force, with 5.2% or 18 of them unemployed. The age group with the highest labor force participation rate is 30 to 34 years, with 81.7% or 58 individuals in the labor force. Within the labor force, the 45 to 54 years age range has the highest percentage of unemployed individuals, with 15.8% or 6 of them being unemployed.
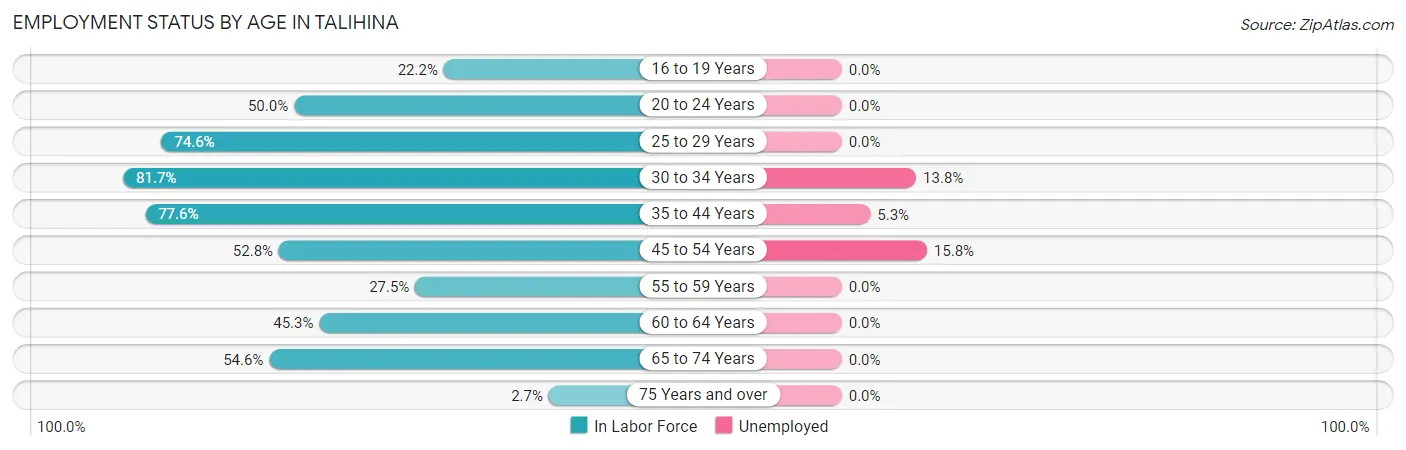
| Age Bracket | In Labor Force | Unemployed |
| 16 to 19 Years | 10 (22.2%) | 0 (0.0%) |
| 20 to 24 Years | 3 (50.0%) | 0 (0.0%) |
| 25 to 29 Years | 53 (74.6%) | 0 (0.0%) |
| 30 to 34 Years | 58 (81.7%) | 8 (13.8%) |
| 35 to 44 Years | 76 (77.6%) | 4 (5.3%) |
| 45 to 54 Years | 38 (52.8%) | 6 (15.8%) |
| 55 to 59 Years | 14 (27.5%) | 0 (0.0%) |
| 60 to 64 Years | 24 (45.3%) | 0 (0.0%) |
| 65 to 74 Years | 65 (54.6%) | 0 (0.0%) |
| 75 Years and over | 4 (2.7%) | 0 (0.0%) |
| Total | 345 (47.0%) | 18 (5.2%) |
Employment Status by Educational Attainment in Talihina
According to labor force statistics for Talihina, 63.2% of individuals (263) out of the total population between 25 and 64 years of age (416) are in the labor force, with 6.8% or 18 of them being unemployed. The group with the highest labor force participation rate are those with the educational attainment of college / associate degree, with 71.6% or 96 individuals in the labor force. Within the labor force, individuals with less than high school education have the highest percentage of unemployment, with 16.7% or 4 of them being unemployed.
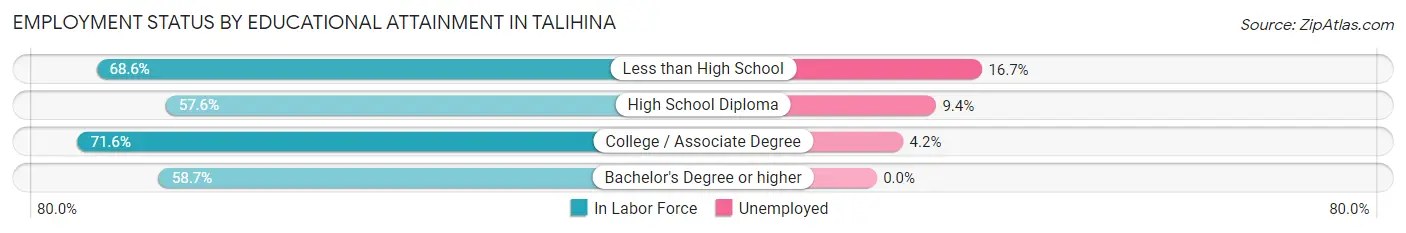
| Educational Attainment | In Labor Force | Unemployed |
| Less than High School | 24 (68.6%) | 6 (16.7%) |
| High School Diploma | 106 (57.6%) | 17 (9.4%) |
| College / Associate Degree | 96 (71.6%) | 6 (4.2%) |
| Bachelor's Degree or higher | 37 (58.7%) | 0 (0.0%) |
| Total | 263 (63.2%) | 28 (6.8%) |
Employment Occupations by Sex in Talihina
Management, Business, Science and Arts Occupations
The most common Management, Business, Science and Arts occupations in Talihina are Health Diagnosing & Treating (33 | 10.1%), Management (27 | 8.3%), Community & Social Service (24 | 7.3%), Education, Arts & Media (10 | 3.1%), and Education Instruction & Library (9 | 2.8%).
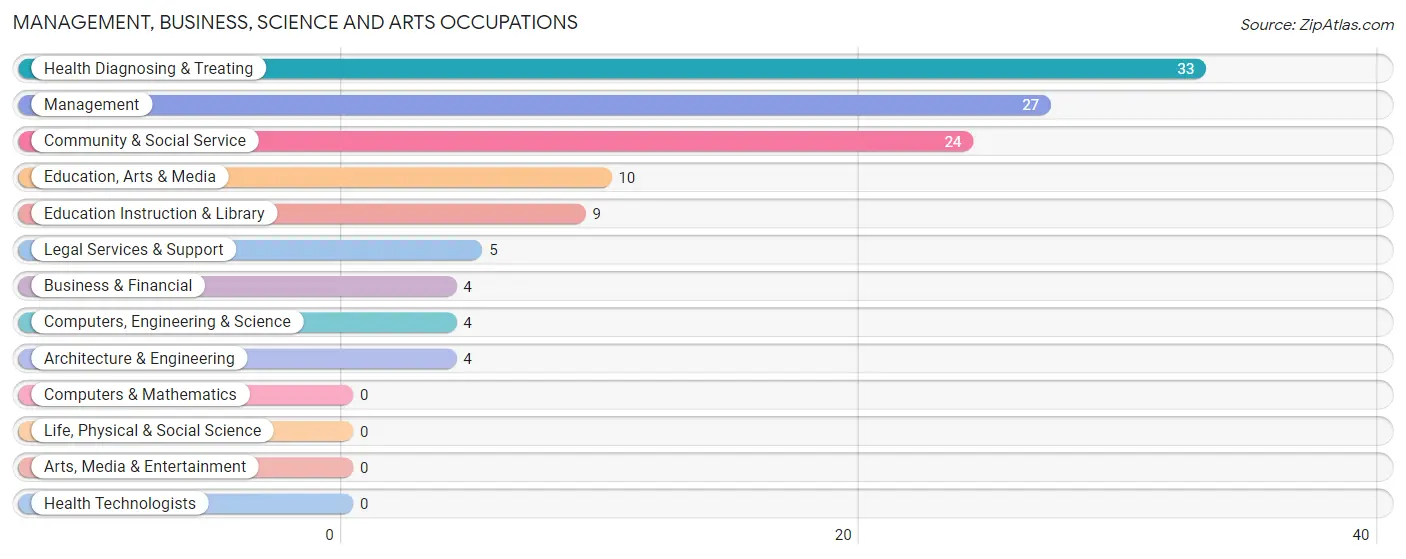
Management, Business, Science and Arts Occupations by Sex
Within the Management, Business, Science and Arts occupations in Talihina, the most male-oriented occupations are Computers, Engineering & Science (100.0%), Architecture & Engineering (100.0%), and Education, Arts & Media (100.0%), while the most female-oriented occupations are Business & Financial (100.0%), Legal Services & Support (100.0%), and Health Diagnosing & Treating (100.0%).

| Occupation | Male | Female |
| Management | 12 (44.4%) | 15 (55.6%) |
| Business & Financial | 0 (0.0%) | 4 (100.0%) |
| Computers, Engineering & Science | 4 (100.0%) | 0 (0.0%) |
| Computers & Mathematics | 0 (0.0%) | 0 (0.0%) |
| Architecture & Engineering | 4 (100.0%) | 0 (0.0%) |
| Life, Physical & Social Science | 0 (0.0%) | 0 (0.0%) |
| Community & Social Service | 16 (66.7%) | 8 (33.3%) |
| Education, Arts & Media | 10 (100.0%) | 0 (0.0%) |
| Legal Services & Support | 0 (0.0%) | 5 (100.0%) |
| Education Instruction & Library | 6 (66.7%) | 3 (33.3%) |
| Arts, Media & Entertainment | 0 (0.0%) | 0 (0.0%) |
| Health Diagnosing & Treating | 0 (0.0%) | 33 (100.0%) |
| Health Technologists | 0 (0.0%) | 0 (0.0%) |
| Total (Category) | 32 (34.8%) | 60 (65.2%) |
| Total (Overall) | 151 (46.2%) | 176 (53.8%) |
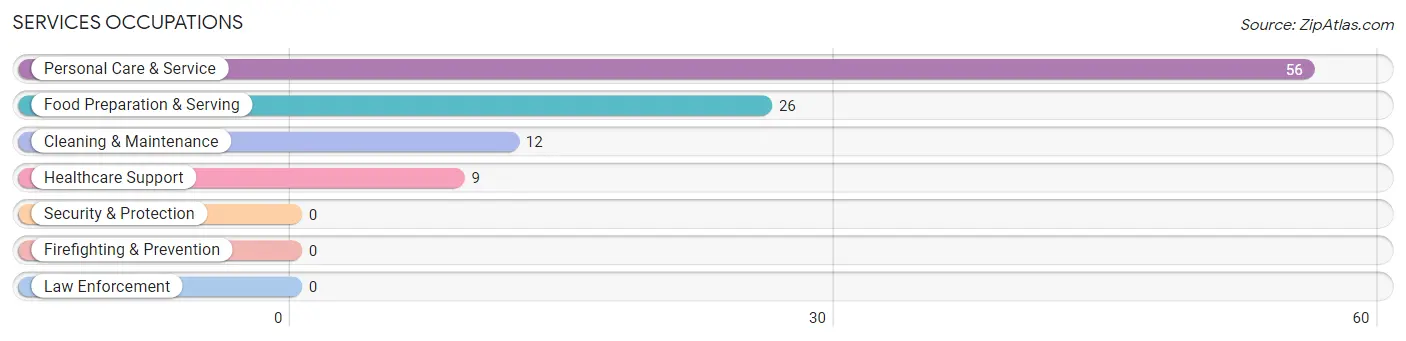
Services Occupations
The most common Services occupations in Talihina are Personal Care & Service (56 | 17.1%), Food Preparation & Serving (26 | 8.0%), Cleaning & Maintenance (12 | 3.7%), and Healthcare Support (9 | 2.8%).
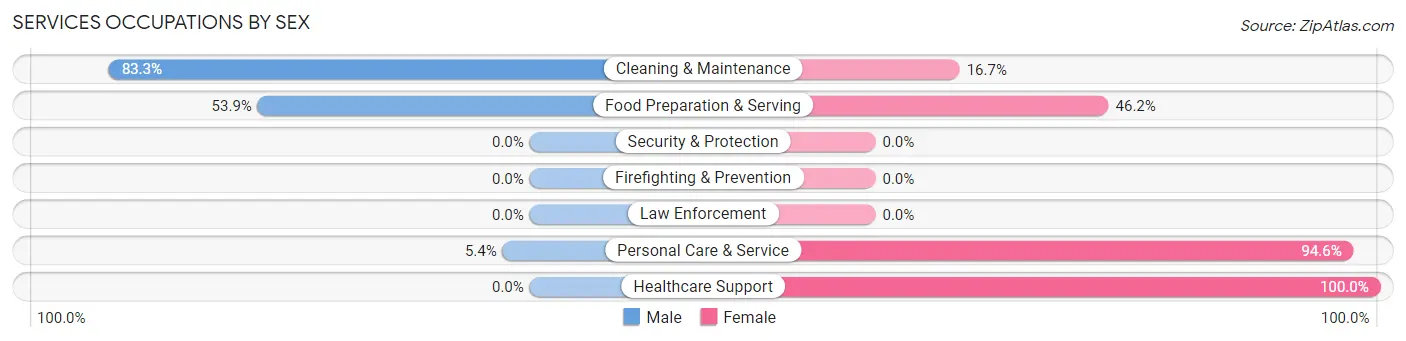
Services Occupations by Sex
Within the Services occupations in Talihina, the most male-oriented occupations are Cleaning & Maintenance (83.3%), Food Preparation & Serving (53.8%), and Personal Care & Service (5.4%), while the most female-oriented occupations are Healthcare Support (100.0%), Personal Care & Service (94.6%), and Food Preparation & Serving (46.2%).
| Occupation | Male | Female |
| Healthcare Support | 0 (0.0%) | 9 (100.0%) |
| Security & Protection | 0 (0.0%) | 0 (0.0%) |
| Firefighting & Prevention | 0 (0.0%) | 0 (0.0%) |
| Law Enforcement | 0 (0.0%) | 0 (0.0%) |
| Food Preparation & Serving | 14 (53.8%) | 12 (46.2%) |
| Cleaning & Maintenance | 10 (83.3%) | 2 (16.7%) |
| Personal Care & Service | 3 (5.4%) | 53 (94.6%) |
| Total (Category) | 27 (26.2%) | 76 (73.8%) |
| Total (Overall) | 151 (46.2%) | 176 (53.8%) |
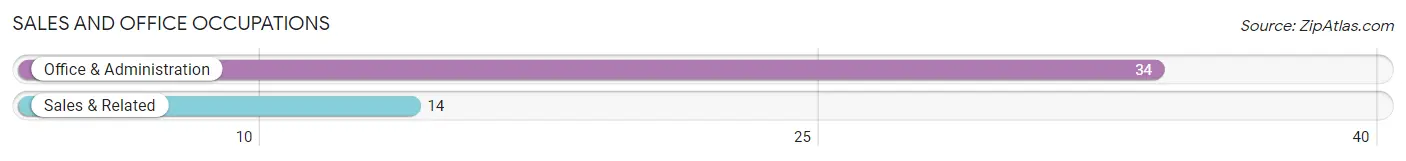
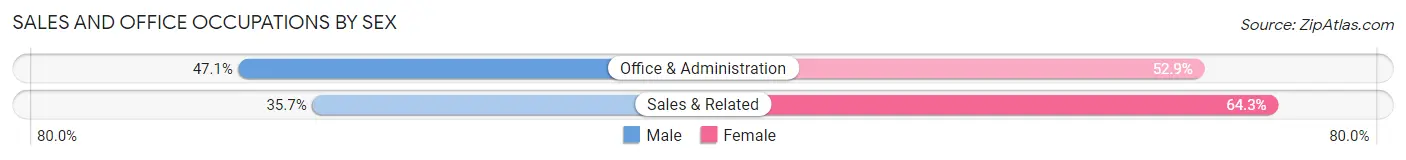
Sales and Office Occupations
The most common Sales and Office occupations in Talihina are Office & Administration (34 | 10.4%), and Sales & Related (14 | 4.3%).
Sales and Office Occupations by Sex
| Occupation | Male | Female |
| Sales & Related | 5 (35.7%) | 9 (64.3%) |
| Office & Administration | 16 (47.1%) | 18 (52.9%) |
| Total (Category) | 21 (43.8%) | 27 (56.2%) |
| Total (Overall) | 151 (46.2%) | 176 (53.8%) |
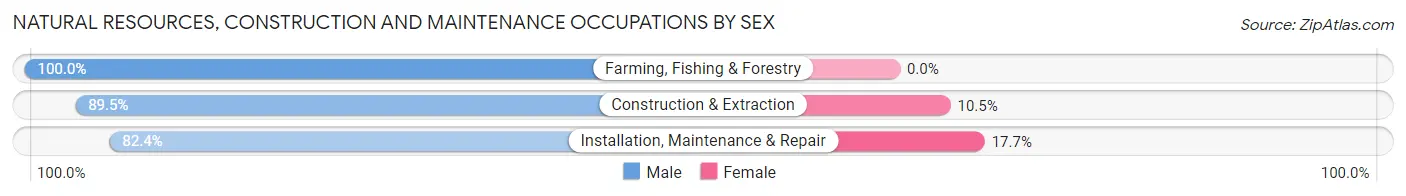
Natural Resources, Construction and Maintenance Occupations
The most common Natural Resources, Construction and Maintenance occupations in Talihina are Construction & Extraction (38 | 11.6%), Installation, Maintenance & Repair (17 | 5.2%), and Farming, Fishing & Forestry (4 | 1.2%).

Natural Resources, Construction and Maintenance Occupations by Sex
| Occupation | Male | Female |
| Farming, Fishing & Forestry | 4 (100.0%) | 0 (0.0%) |
| Construction & Extraction | 34 (89.5%) | 4 (10.5%) |
| Installation, Maintenance & Repair | 14 (82.4%) | 3 (17.6%) |
| Total (Category) | 52 (88.1%) | 7 (11.9%) |
| Total (Overall) | 151 (46.2%) | 176 (53.8%) |
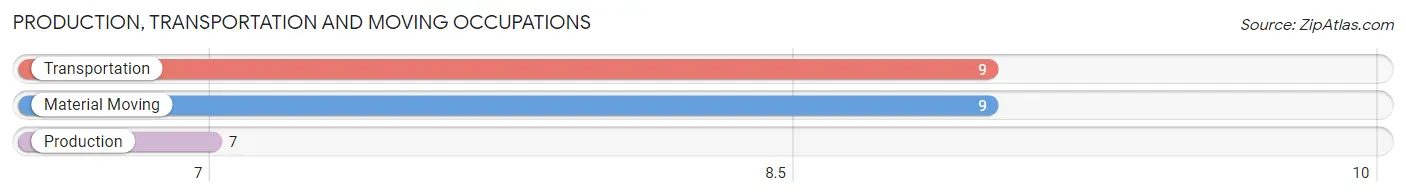
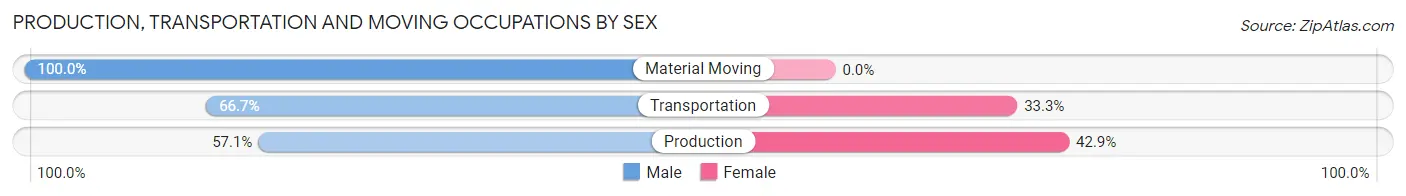
Production, Transportation and Moving Occupations
The most common Production, Transportation and Moving occupations in Talihina are Transportation (9 | 2.8%), Material Moving (9 | 2.8%), and Production (7 | 2.1%).
Production, Transportation and Moving Occupations by Sex
| Occupation | Male | Female |
| Production | 4 (57.1%) | 3 (42.9%) |
| Transportation | 6 (66.7%) | 3 (33.3%) |
| Material Moving | 9 (100.0%) | 0 (0.0%) |
| Total (Category) | 19 (76.0%) | 6 (24.0%) |
| Total (Overall) | 151 (46.2%) | 176 (53.8%) |
Employment Industries by Sex in Talihina
Employment Industries in Talihina
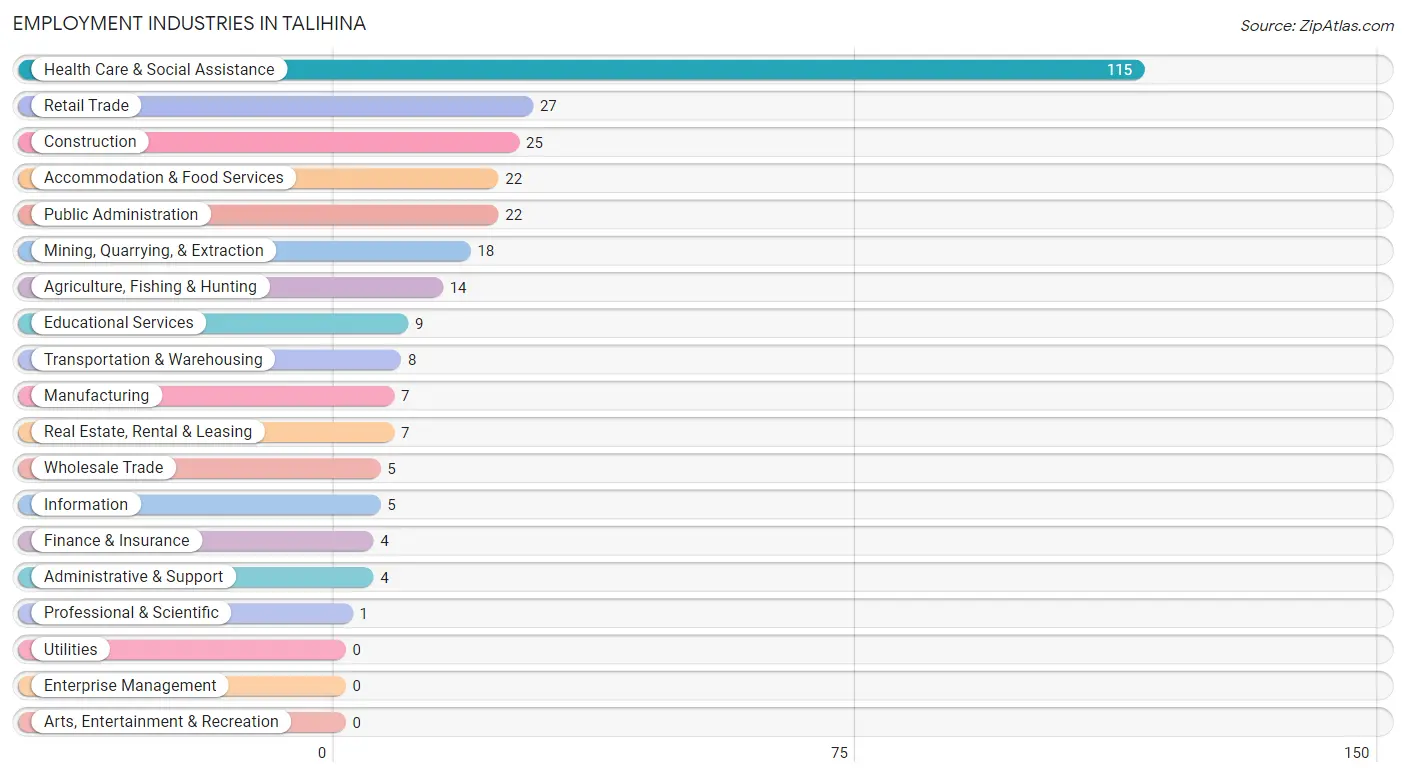
The major employment industries in Talihina include Health Care & Social Assistance (115 | 35.2%), Retail Trade (27 | 8.3%), Construction (25 | 7.6%), Accommodation & Food Services (22 | 6.7%), and Public Administration (22 | 6.7%).
Employment Industries by Sex in Talihina
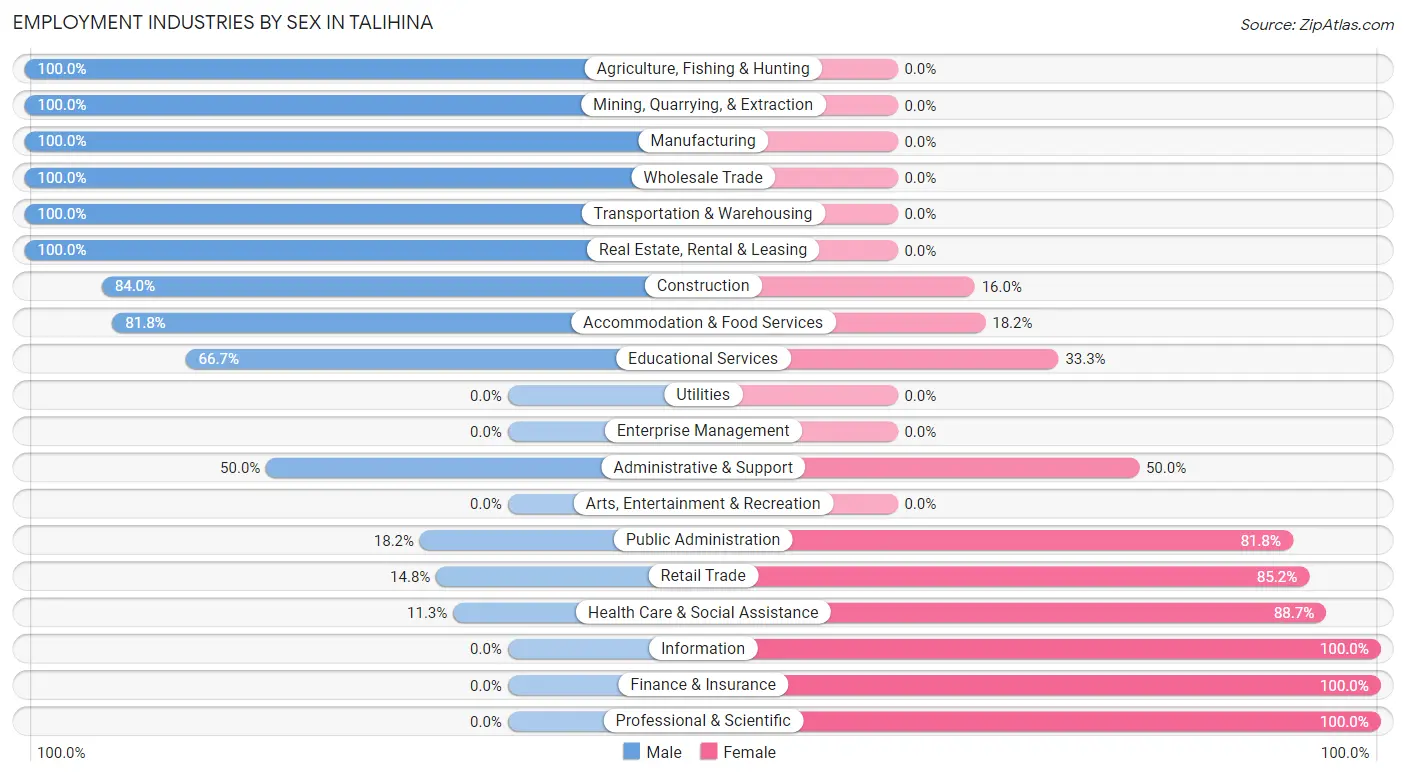
The Talihina industries that see more men than women are Agriculture, Fishing & Hunting (100.0%), Mining, Quarrying, & Extraction (100.0%), and Manufacturing (100.0%), whereas the industries that tend to have a higher number of women are Information (100.0%), Finance & Insurance (100.0%), and Professional & Scientific (100.0%).
| Industry | Male | Female |
| Agriculture, Fishing & Hunting | 14 (100.0%) | 0 (0.0%) |
| Mining, Quarrying, & Extraction | 18 (100.0%) | 0 (0.0%) |
| Construction | 21 (84.0%) | 4 (16.0%) |
| Manufacturing | 7 (100.0%) | 0 (0.0%) |
| Wholesale Trade | 5 (100.0%) | 0 (0.0%) |
| Retail Trade | 4 (14.8%) | 23 (85.2%) |
| Transportation & Warehousing | 8 (100.0%) | 0 (0.0%) |
| Utilities | 0 (0.0%) | 0 (0.0%) |
| Information | 0 (0.0%) | 5 (100.0%) |
| Finance & Insurance | 0 (0.0%) | 4 (100.0%) |
| Real Estate, Rental & Leasing | 7 (100.0%) | 0 (0.0%) |
| Professional & Scientific | 0 (0.0%) | 1 (100.0%) |
| Enterprise Management | 0 (0.0%) | 0 (0.0%) |
| Administrative & Support | 2 (50.0%) | 2 (50.0%) |
| Educational Services | 6 (66.7%) | 3 (33.3%) |
| Health Care & Social Assistance | 13 (11.3%) | 102 (88.7%) |
| Arts, Entertainment & Recreation | 0 (0.0%) | 0 (0.0%) |
| Accommodation & Food Services | 18 (81.8%) | 4 (18.2%) |
| Public Administration | 4 (18.2%) | 18 (81.8%) |
| Total | 151 (46.2%) | 176 (53.8%) |
Education in Talihina
School Enrollment in Talihina
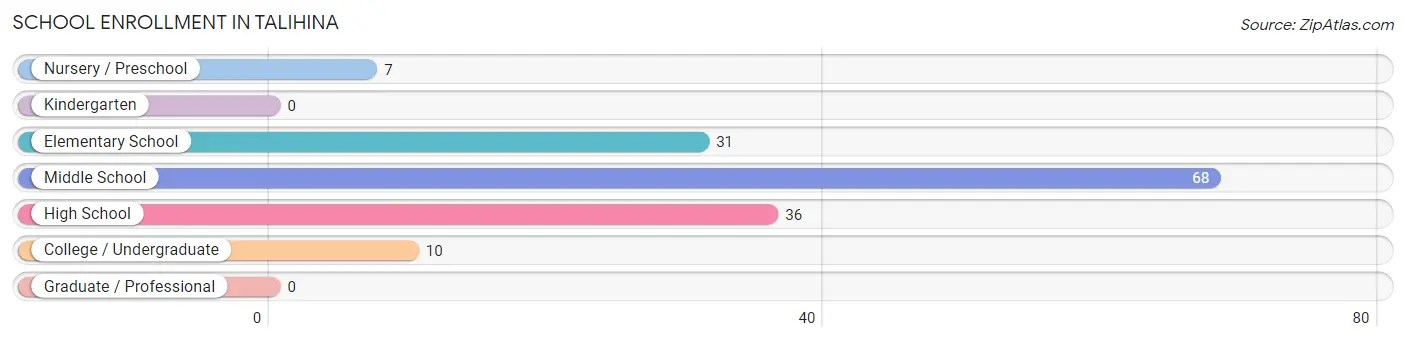
The most common levels of schooling among the 152 students in Talihina are middle school (68 | 44.7%), high school (36 | 23.7%), and elementary school (31 | 20.4%).
| School Level | # Students | % Students |
| Nursery / Preschool | 7 | 4.6% |
| Kindergarten | 0 | 0.0% |
| Elementary School | 31 | 20.4% |
| Middle School | 68 | 44.7% |
| High School | 36 | 23.7% |
| College / Undergraduate | 10 | 6.6% |
| Graduate / Professional | 0 | 0.0% |
| Total | 152 | 100.0% |
School Enrollment by Age by Funding Source in Talihina
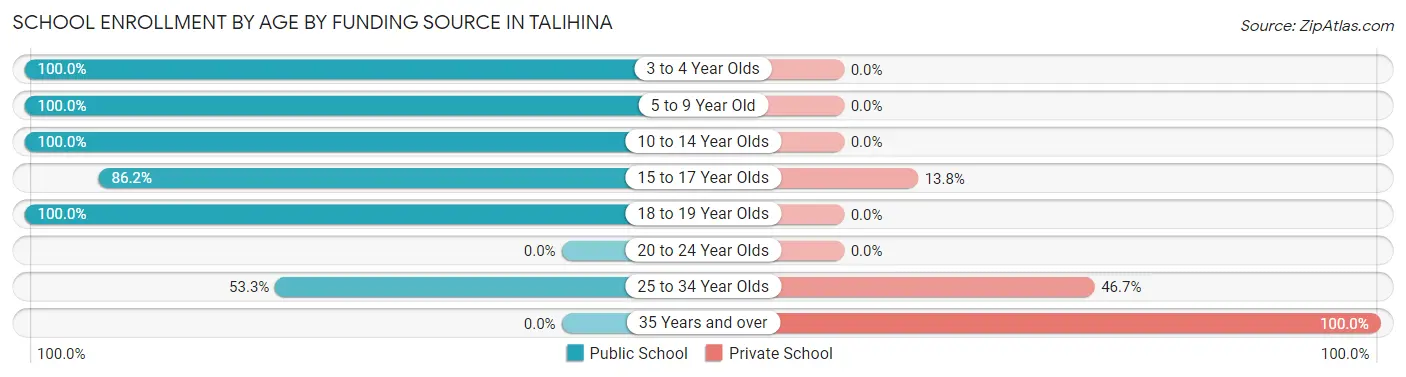
Out of a total of 152 students who are enrolled in schools in Talihina, 13 (8.6%) attend a private institution, while the remaining 139 (91.4%) are enrolled in public schools. The age group of 35 years and over has the highest likelihood of being enrolled in private schools, with 2 (100.0% in the age bracket) enrolled. Conversely, the age group of 3 to 4 year olds has the lowest likelihood of being enrolled in a private school, with 7 (100.0% in the age bracket) attending a public institution.
| Age Bracket | Public School | Private School |
| 3 to 4 Year Olds | 7 (100.0%) | 0 (0.0%) |
| 5 to 9 Year Old | 31 (100.0%) | 0 (0.0%) |
| 10 to 14 Year Olds | 61 (100.0%) | 0 (0.0%) |
| 15 to 17 Year Olds | 25 (86.2%) | 4 (13.8%) |
| 18 to 19 Year Olds | 7 (100.0%) | 0 (0.0%) |
| 20 to 24 Year Olds | 0 (0.0%) | 0 (0.0%) |
| 25 to 34 Year Olds | 8 (53.3%) | 7 (46.7%) |
| 35 Years and over | 0 (0.0%) | 2 (100.0%) |
| Total | 139 (91.4%) | 13 (8.6%) |
Educational Attainment by Field of Study in Talihina
Education (36 | 36.7%), science & technology (22 | 22.5%), business (12 | 12.2%), liberal arts & history (9 | 9.2%), and psychology (7 | 7.1%) are the most common fields of study among 98 individuals in Talihina who have obtained a bachelor's degree or higher.
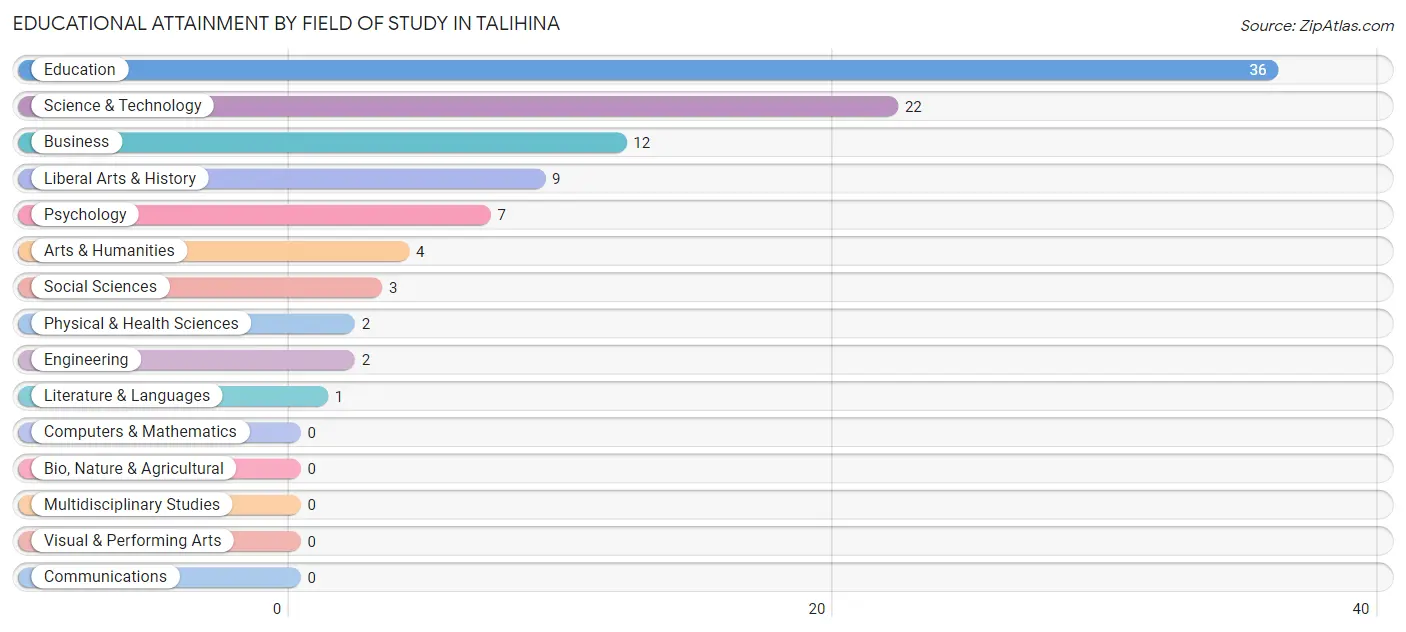
| Field of Study | # Graduates | % Graduates |
| Computers & Mathematics | 0 | 0.0% |
| Bio, Nature & Agricultural | 0 | 0.0% |
| Physical & Health Sciences | 2 | 2.0% |
| Psychology | 7 | 7.1% |
| Social Sciences | 3 | 3.1% |
| Engineering | 2 | 2.0% |
| Multidisciplinary Studies | 0 | 0.0% |
| Science & Technology | 22 | 22.5% |
| Business | 12 | 12.2% |
| Education | 36 | 36.7% |
| Literature & Languages | 1 | 1.0% |
| Liberal Arts & History | 9 | 9.2% |
| Visual & Performing Arts | 0 | 0.0% |
| Communications | 0 | 0.0% |
| Arts & Humanities | 4 | 4.1% |
| Total | 98 | 100.0% |
Transportation & Commute in Talihina
Vehicle Availability by Sex in Talihina
The most prevalent vehicle ownership categories in Talihina are males with 3 vehicles (66, accounting for 43.7%) and females with 3 vehicles (25, making up 40.0%).
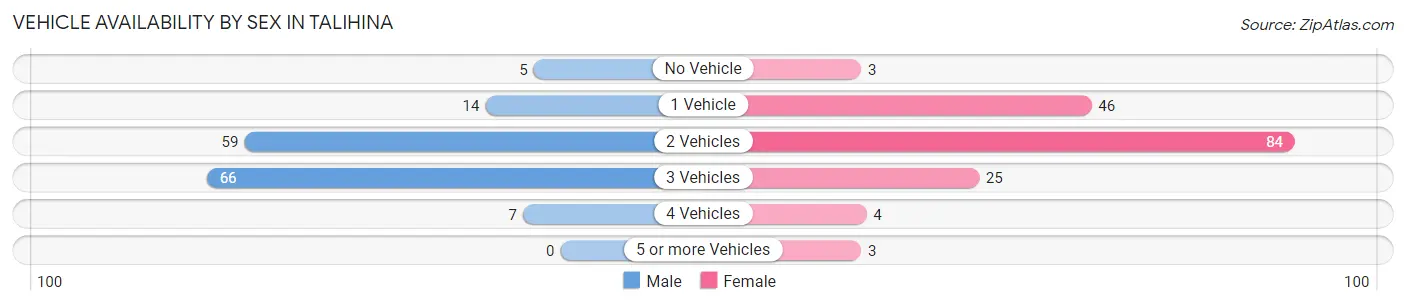
| Vehicles Available | Male | Female |
| No Vehicle | 5 (3.3%) | 3 (1.8%) |
| 1 Vehicle | 14 (9.3%) | 46 (27.9%) |
| 2 Vehicles | 59 (39.1%) | 84 (50.9%) |
| 3 Vehicles | 66 (43.7%) | 25 (15.1%) |
| 4 Vehicles | 7 (4.6%) | 4 (2.4%) |
| 5 or more Vehicles | 0 (0.0%) | 3 (1.8%) |
| Total | 151 (100.0%) | 165 (100.0%) |
Commute Time in Talihina
The most frequently occuring commute durations in Talihina are 10 to 14 minutes (63 commuters, 23.7%), 5 to 9 minutes (61 commuters, 22.9%), and less than 5 minutes (42 commuters, 15.8%).
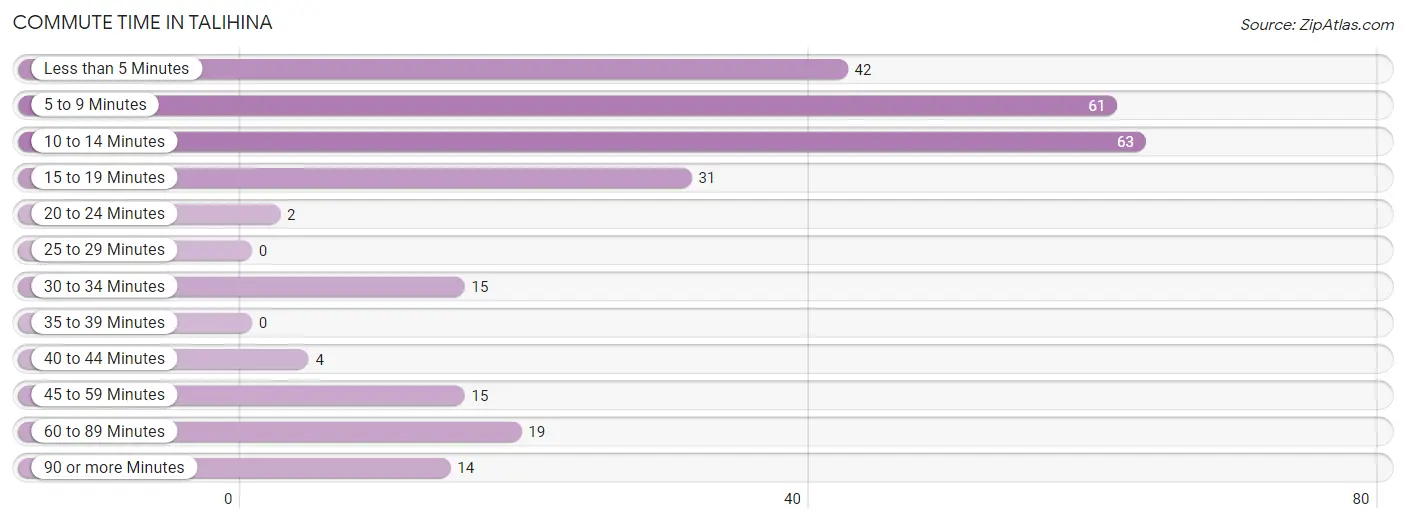
| Commute Time | # Commuters | % Commuters |
| Less than 5 Minutes | 42 | 15.8% |
| 5 to 9 Minutes | 61 | 22.9% |
| 10 to 14 Minutes | 63 | 23.7% |
| 15 to 19 Minutes | 31 | 11.7% |
| 20 to 24 Minutes | 2 | 0.7% |
| 25 to 29 Minutes | 0 | 0.0% |
| 30 to 34 Minutes | 15 | 5.6% |
| 35 to 39 Minutes | 0 | 0.0% |
| 40 to 44 Minutes | 4 | 1.5% |
| 45 to 59 Minutes | 15 | 5.6% |
| 60 to 89 Minutes | 19 | 7.1% |
| 90 or more Minutes | 14 | 5.3% |
Commute Time by Sex in Talihina
The most common commute times in Talihina are 5 to 9 minutes (32 commuters, 21.2%) for males and 10 to 14 minutes (42 commuters, 36.5%) for females.
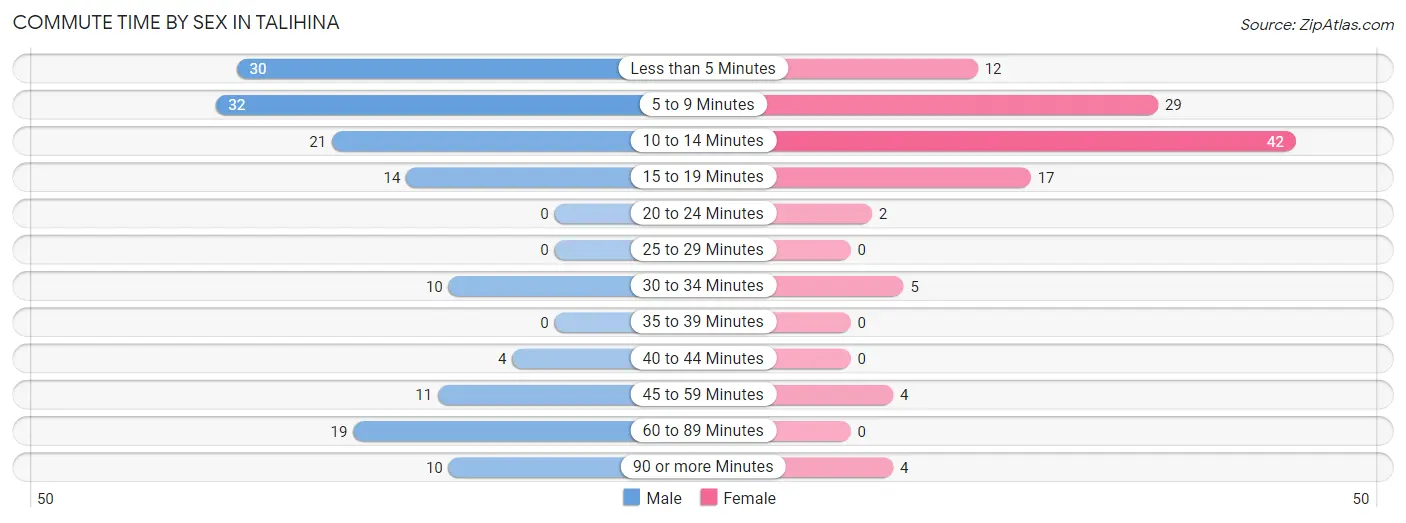
| Commute Time | Male | Female |
| Less than 5 Minutes | 30 (19.9%) | 12 (10.4%) |
| 5 to 9 Minutes | 32 (21.2%) | 29 (25.2%) |
| 10 to 14 Minutes | 21 (13.9%) | 42 (36.5%) |
| 15 to 19 Minutes | 14 (9.3%) | 17 (14.8%) |
| 20 to 24 Minutes | 0 (0.0%) | 2 (1.7%) |
| 25 to 29 Minutes | 0 (0.0%) | 0 (0.0%) |
| 30 to 34 Minutes | 10 (6.6%) | 5 (4.3%) |
| 35 to 39 Minutes | 0 (0.0%) | 0 (0.0%) |
| 40 to 44 Minutes | 4 (2.6%) | 0 (0.0%) |
| 45 to 59 Minutes | 11 (7.3%) | 4 (3.5%) |
| 60 to 89 Minutes | 19 (12.6%) | 0 (0.0%) |
| 90 or more Minutes | 10 (6.6%) | 4 (3.5%) |
Time of Departure to Work by Sex in Talihina
The most frequent times of departure to work in Talihina are 7:00 AM to 7:29 AM (52, 34.4%) for males and 7:30 AM to 7:59 AM (24, 20.9%) for females.
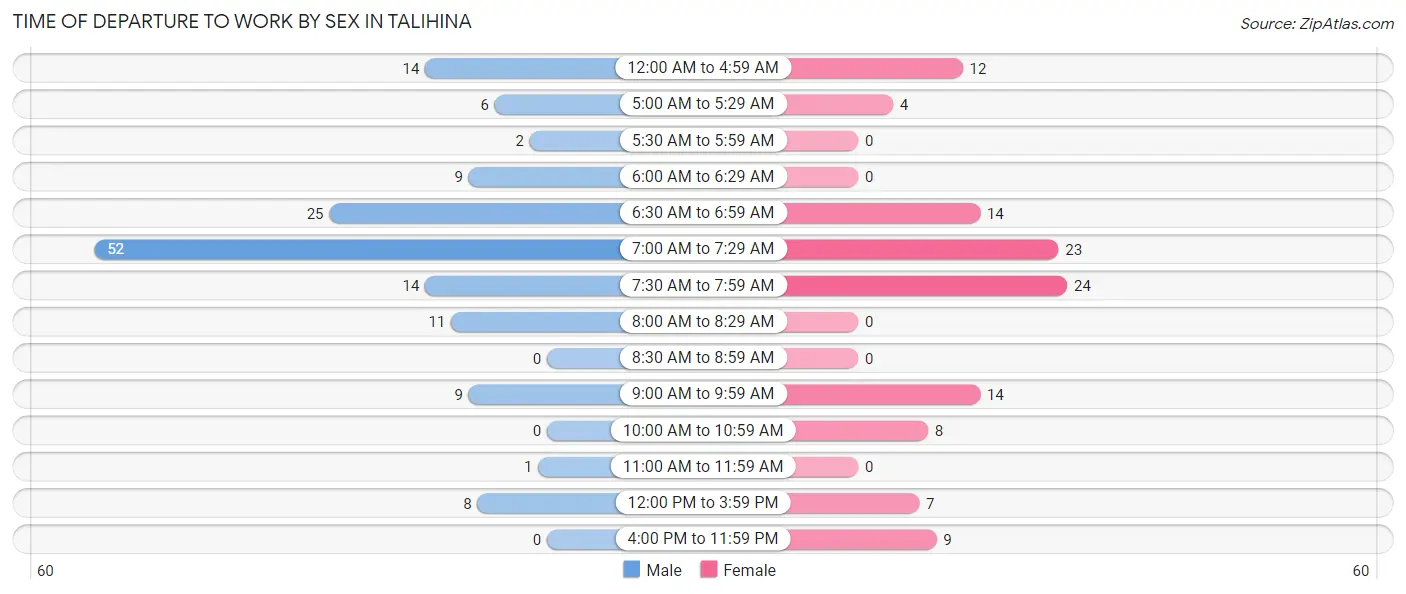
| Time of Departure | Male | Female |
| 12:00 AM to 4:59 AM | 14 (9.3%) | 12 (10.4%) |
| 5:00 AM to 5:29 AM | 6 (4.0%) | 4 (3.5%) |
| 5:30 AM to 5:59 AM | 2 (1.3%) | 0 (0.0%) |
| 6:00 AM to 6:29 AM | 9 (6.0%) | 0 (0.0%) |
| 6:30 AM to 6:59 AM | 25 (16.6%) | 14 (12.2%) |
| 7:00 AM to 7:29 AM | 52 (34.4%) | 23 (20.0%) |
| 7:30 AM to 7:59 AM | 14 (9.3%) | 24 (20.9%) |
| 8:00 AM to 8:29 AM | 11 (7.3%) | 0 (0.0%) |
| 8:30 AM to 8:59 AM | 0 (0.0%) | 0 (0.0%) |
| 9:00 AM to 9:59 AM | 9 (6.0%) | 14 (12.2%) |
| 10:00 AM to 10:59 AM | 0 (0.0%) | 8 (7.0%) |
| 11:00 AM to 11:59 AM | 1 (0.7%) | 0 (0.0%) |
| 12:00 PM to 3:59 PM | 8 (5.3%) | 7 (6.1%) |
| 4:00 PM to 11:59 PM | 0 (0.0%) | 9 (7.8%) |
| Total | 151 (100.0%) | 115 (100.0%) |
Housing Occupancy in Talihina
Occupancy by Ownership in Talihina
Of the total 416 dwellings in Talihina, owner-occupied units account for 215 (51.7%), while renter-occupied units make up 201 (48.3%).
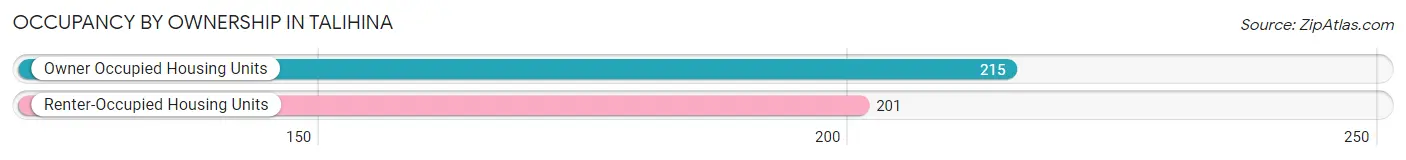
| Occupancy | # Housing Units | % Housing Units |
| Owner Occupied Housing Units | 215 | 51.7% |
| Renter-Occupied Housing Units | 201 | 48.3% |
| Total Occupied Housing Units | 416 | 100.0% |
Occupancy by Household Size in Talihina
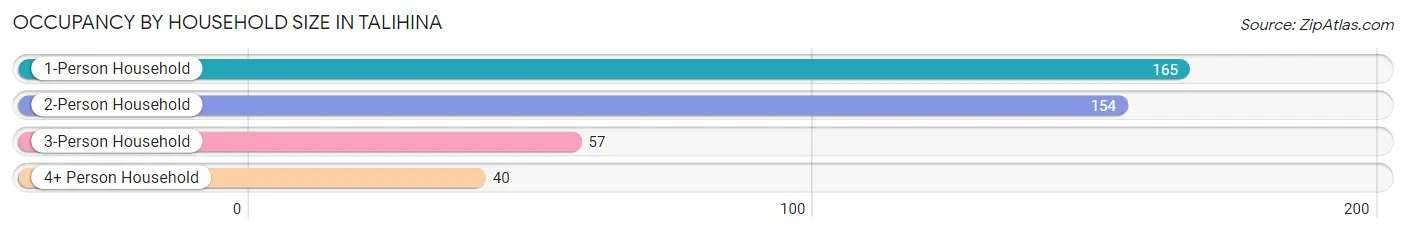
| Household Size | # Housing Units | % Housing Units |
| 1-Person Household | 165 | 39.7% |
| 2-Person Household | 154 | 37.0% |
| 3-Person Household | 57 | 13.7% |
| 4+ Person Household | 40 | 9.6% |
| Total Housing Units | 416 | 100.0% |
Occupancy by Ownership by Household Size in Talihina
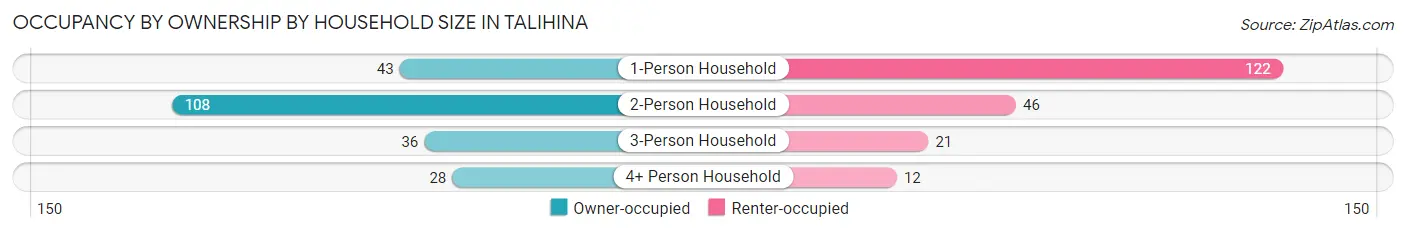
| Household Size | Owner-occupied | Renter-occupied |
| 1-Person Household | 43 (26.1%) | 122 (73.9%) |
| 2-Person Household | 108 (70.1%) | 46 (29.9%) |
| 3-Person Household | 36 (63.2%) | 21 (36.8%) |
| 4+ Person Household | 28 (70.0%) | 12 (30.0%) |
| Total Housing Units | 215 (51.7%) | 201 (48.3%) |
Occupancy by Educational Attainment in Talihina
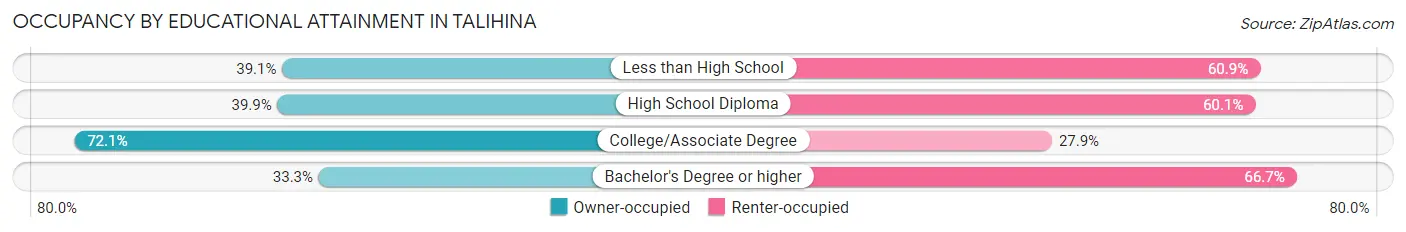
| Household Size | Owner-occupied | Renter-occupied |
| Less than High School | 9 (39.1%) | 14 (60.9%) |
| High School Diploma | 67 (39.9%) | 101 (60.1%) |
| College/Associate Degree | 119 (72.1%) | 46 (27.9%) |
| Bachelor's Degree or higher | 20 (33.3%) | 40 (66.7%) |
Occupancy by Age of Householder in Talihina
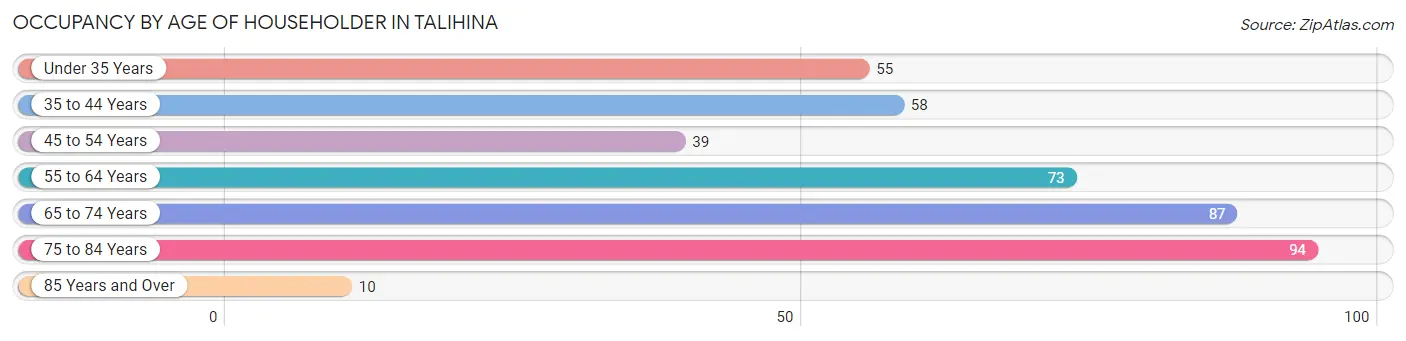
| Age Bracket | # Households | % Households |
| Under 35 Years | 55 | 13.2% |
| 35 to 44 Years | 58 | 13.9% |
| 45 to 54 Years | 39 | 9.4% |
| 55 to 64 Years | 73 | 17.5% |
| 65 to 74 Years | 87 | 20.9% |
| 75 to 84 Years | 94 | 22.6% |
| 85 Years and Over | 10 | 2.4% |
| Total | 416 | 100.0% |
Housing Finances in Talihina
Median Income by Occupancy in Talihina
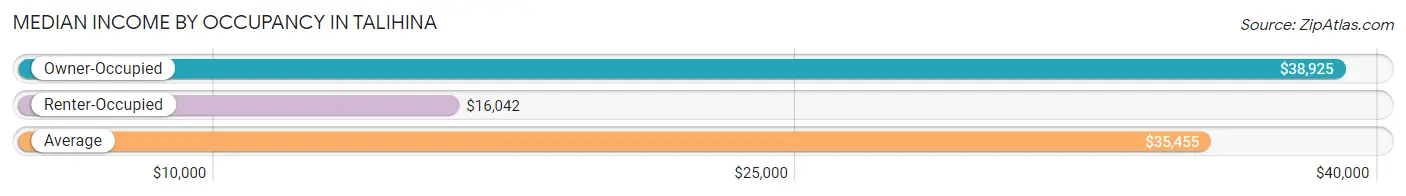
| Occupancy Type | # Households | Median Income |
| Owner-Occupied | 215 (51.7%) | $38,925 |
| Renter-Occupied | 201 (48.3%) | $16,042 |
| Average | 416 (100.0%) | $35,455 |
Occupancy by Householder Income Bracket in Talihina
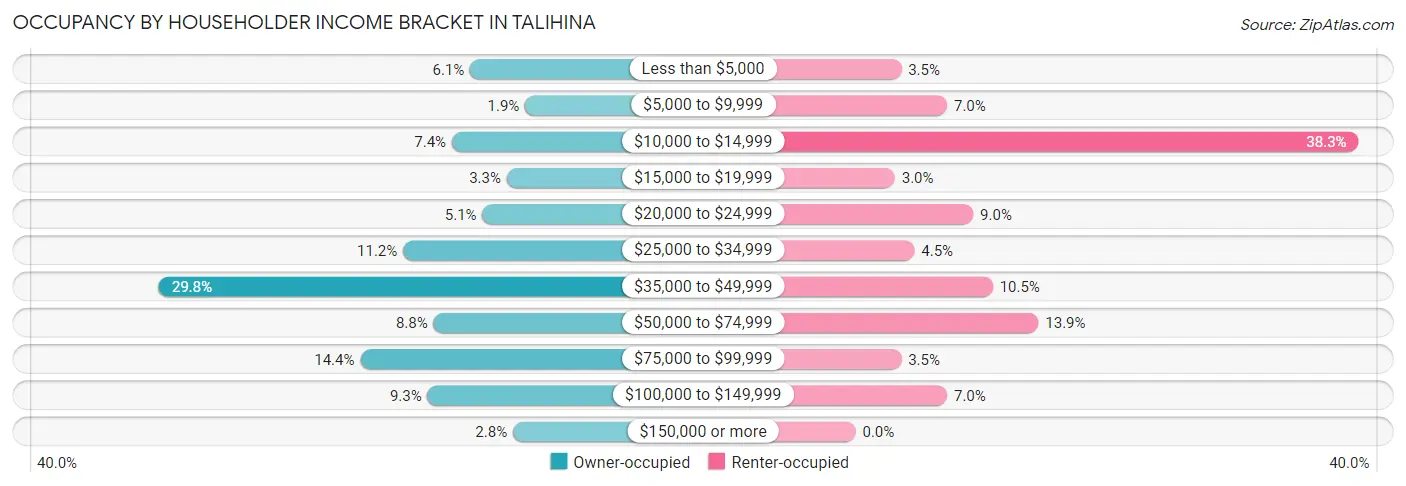
| Income Bracket | Owner-occupied | Renter-occupied |
| Less than $5,000 | 13 (6.0%) | 7 (3.5%) |
| $5,000 to $9,999 | 4 (1.9%) | 14 (7.0%) |
| $10,000 to $14,999 | 16 (7.4%) | 77 (38.3%) |
| $15,000 to $19,999 | 7 (3.3%) | 6 (3.0%) |
| $20,000 to $24,999 | 11 (5.1%) | 18 (9.0%) |
| $25,000 to $34,999 | 24 (11.2%) | 9 (4.5%) |
| $35,000 to $49,999 | 64 (29.8%) | 21 (10.4%) |
| $50,000 to $74,999 | 19 (8.8%) | 28 (13.9%) |
| $75,000 to $99,999 | 31 (14.4%) | 7 (3.5%) |
| $100,000 to $149,999 | 20 (9.3%) | 14 (7.0%) |
| $150,000 or more | 6 (2.8%) | 0 (0.0%) |
| Total | 215 (100.0%) | 201 (100.0%) |
Monthly Housing Cost Tiers in Talihina
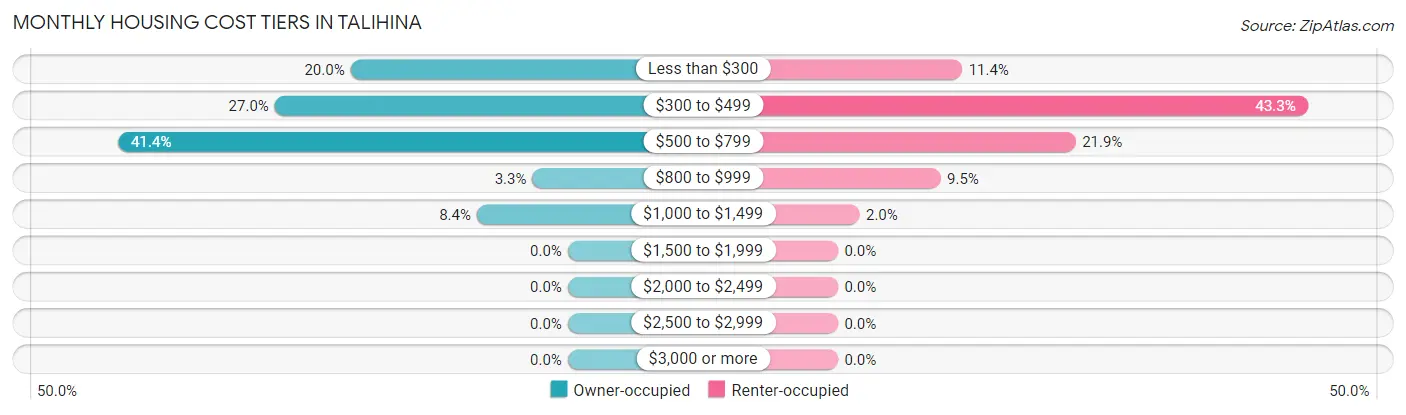
| Monthly Cost | Owner-occupied | Renter-occupied |
| Less than $300 | 43 (20.0%) | 23 (11.4%) |
| $300 to $499 | 58 (27.0%) | 87 (43.3%) |
| $500 to $799 | 89 (41.4%) | 44 (21.9%) |
| $800 to $999 | 7 (3.3%) | 19 (9.5%) |
| $1,000 to $1,499 | 18 (8.4%) | 4 (2.0%) |
| $1,500 to $1,999 | 0 (0.0%) | 0 (0.0%) |
| $2,000 to $2,499 | 0 (0.0%) | 0 (0.0%) |
| $2,500 to $2,999 | 0 (0.0%) | 0 (0.0%) |
| $3,000 or more | 0 (0.0%) | 0 (0.0%) |
| Total | 215 (100.0%) | 201 (100.0%) |
Physical Housing Characteristics in Talihina
Housing Structures in Talihina
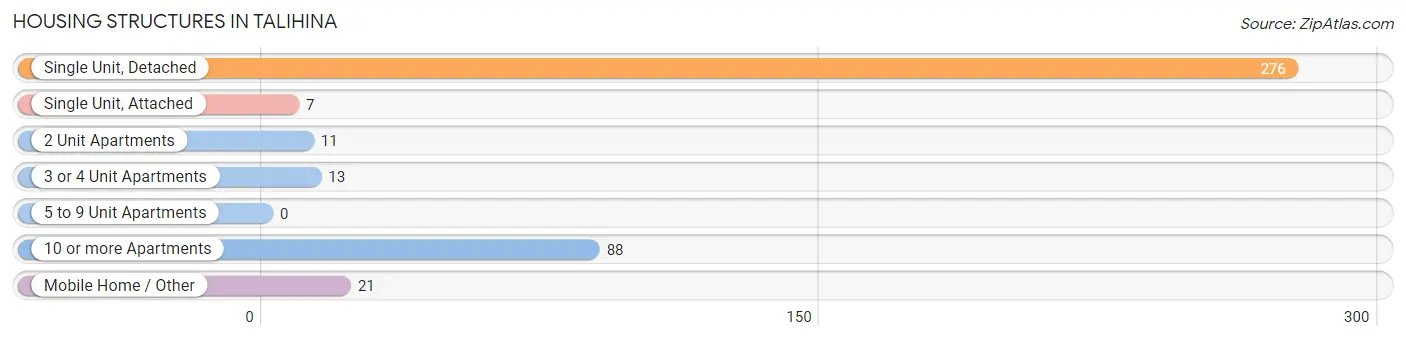
| Structure Type | # Housing Units | % Housing Units |
| Single Unit, Detached | 276 | 66.3% |
| Single Unit, Attached | 7 | 1.7% |
| 2 Unit Apartments | 11 | 2.6% |
| 3 or 4 Unit Apartments | 13 | 3.1% |
| 5 to 9 Unit Apartments | 0 | 0.0% |
| 10 or more Apartments | 88 | 21.1% |
| Mobile Home / Other | 21 | 5.1% |
| Total | 416 | 100.0% |
Housing Structures by Occupancy in Talihina
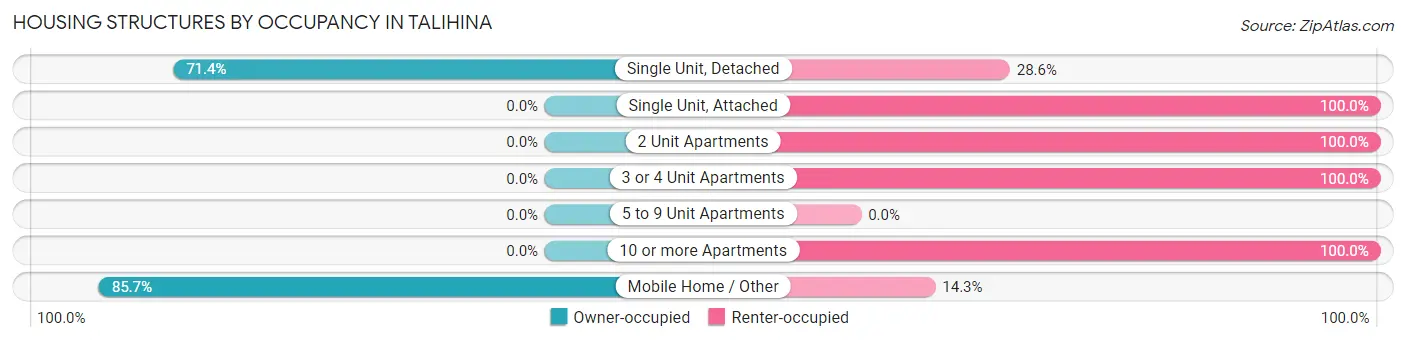
| Structure Type | Owner-occupied | Renter-occupied |
| Single Unit, Detached | 197 (71.4%) | 79 (28.6%) |
| Single Unit, Attached | 0 (0.0%) | 7 (100.0%) |
| 2 Unit Apartments | 0 (0.0%) | 11 (100.0%) |
| 3 or 4 Unit Apartments | 0 (0.0%) | 13 (100.0%) |
| 5 to 9 Unit Apartments | 0 (0.0%) | 0 (0.0%) |
| 10 or more Apartments | 0 (0.0%) | 88 (100.0%) |
| Mobile Home / Other | 18 (85.7%) | 3 (14.3%) |
| Total | 215 (51.7%) | 201 (48.3%) |
Housing Structures by Number of Rooms in Talihina
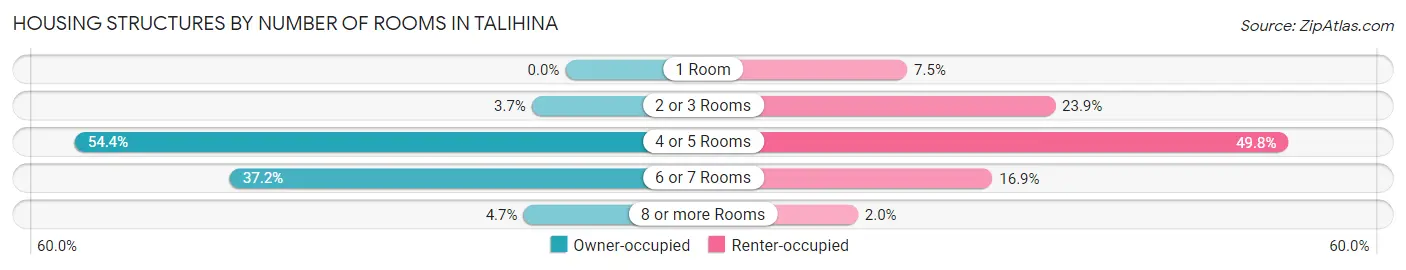
| Number of Rooms | Owner-occupied | Renter-occupied |
| 1 Room | 0 (0.0%) | 15 (7.5%) |
| 2 or 3 Rooms | 8 (3.7%) | 48 (23.9%) |
| 4 or 5 Rooms | 117 (54.4%) | 100 (49.7%) |
| 6 or 7 Rooms | 80 (37.2%) | 34 (16.9%) |
| 8 or more Rooms | 10 (4.6%) | 4 (2.0%) |
| Total | 215 (100.0%) | 201 (100.0%) |
Housing Structure by Heating Type in Talihina
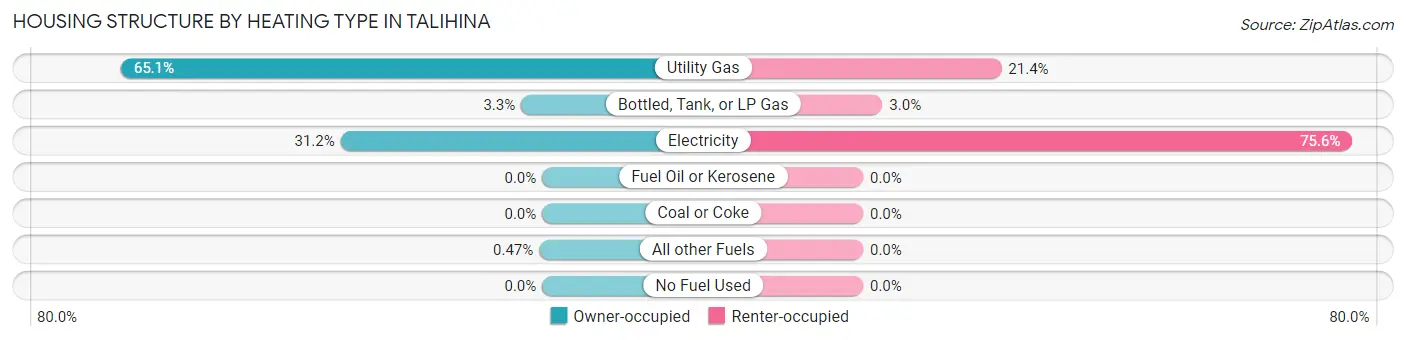
| Heating Type | Owner-occupied | Renter-occupied |
| Utility Gas | 140 (65.1%) | 43 (21.4%) |
| Bottled, Tank, or LP Gas | 7 (3.3%) | 6 (3.0%) |
| Electricity | 67 (31.2%) | 152 (75.6%) |
| Fuel Oil or Kerosene | 0 (0.0%) | 0 (0.0%) |
| Coal or Coke | 0 (0.0%) | 0 (0.0%) |
| All other Fuels | 1 (0.5%) | 0 (0.0%) |
| No Fuel Used | 0 (0.0%) | 0 (0.0%) |
| Total | 215 (100.0%) | 201 (100.0%) |
Household Vehicle Usage in Talihina
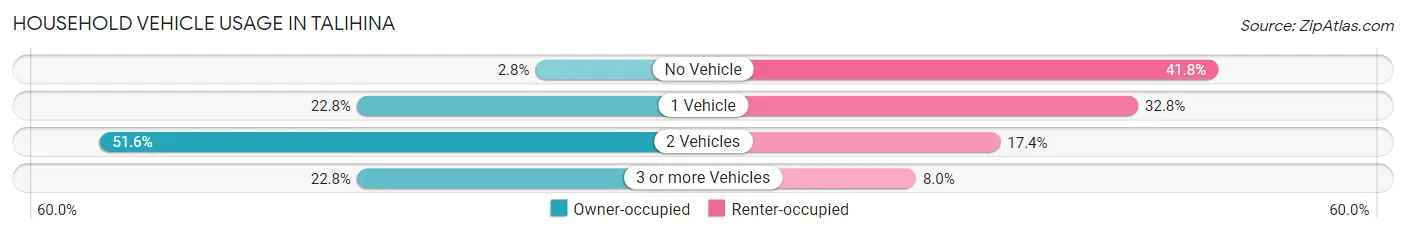
| Vehicles per Household | Owner-occupied | Renter-occupied |
| No Vehicle | 6 (2.8%) | 84 (41.8%) |
| 1 Vehicle | 49 (22.8%) | 66 (32.8%) |
| 2 Vehicles | 111 (51.6%) | 35 (17.4%) |
| 3 or more Vehicles | 49 (22.8%) | 16 (8.0%) |
| Total | 215 (100.0%) | 201 (100.0%) |
Real Estate & Mortgages in Talihina
Real Estate and Mortgage Overview in Talihina
| Characteristic | Without Mortgage | With Mortgage |
| Housing Units | 129 | 86 |
| Median Property Value | $62,500 | $0 |
| Median Household Income | $35,938 | $2 |
| Monthly Housing Costs | $369 | $0 |
| Real Estate Taxes | $300 | $4 |
Property Value by Mortgage Status in Talihina
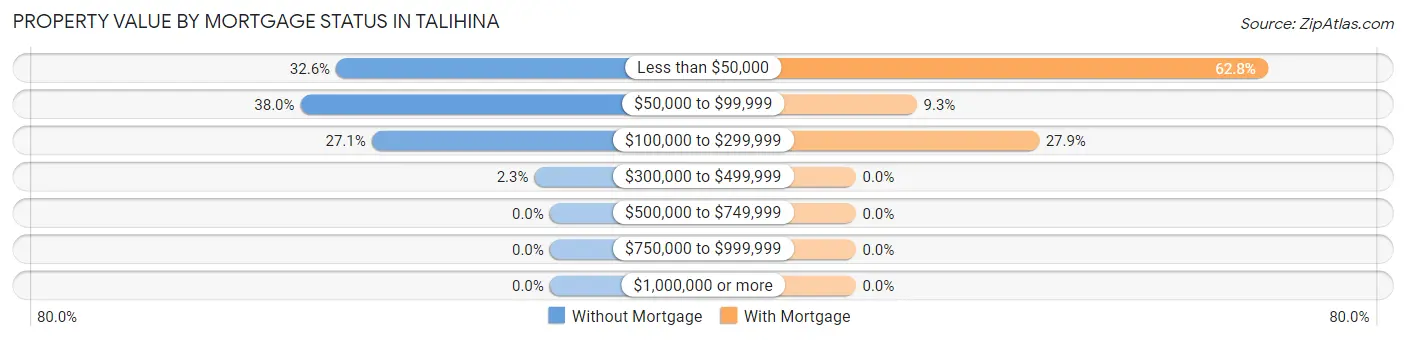
| Property Value | Without Mortgage | With Mortgage |
| Less than $50,000 | 42 (32.6%) | 54 (62.8%) |
| $50,000 to $99,999 | 49 (38.0%) | 8 (9.3%) |
| $100,000 to $299,999 | 35 (27.1%) | 24 (27.9%) |
| $300,000 to $499,999 | 3 (2.3%) | 0 (0.0%) |
| $500,000 to $749,999 | 0 (0.0%) | 0 (0.0%) |
| $750,000 to $999,999 | 0 (0.0%) | 0 (0.0%) |
| $1,000,000 or more | 0 (0.0%) | 0 (0.0%) |
| Total | 129 (100.0%) | 86 (100.0%) |
Household Income by Mortgage Status in Talihina
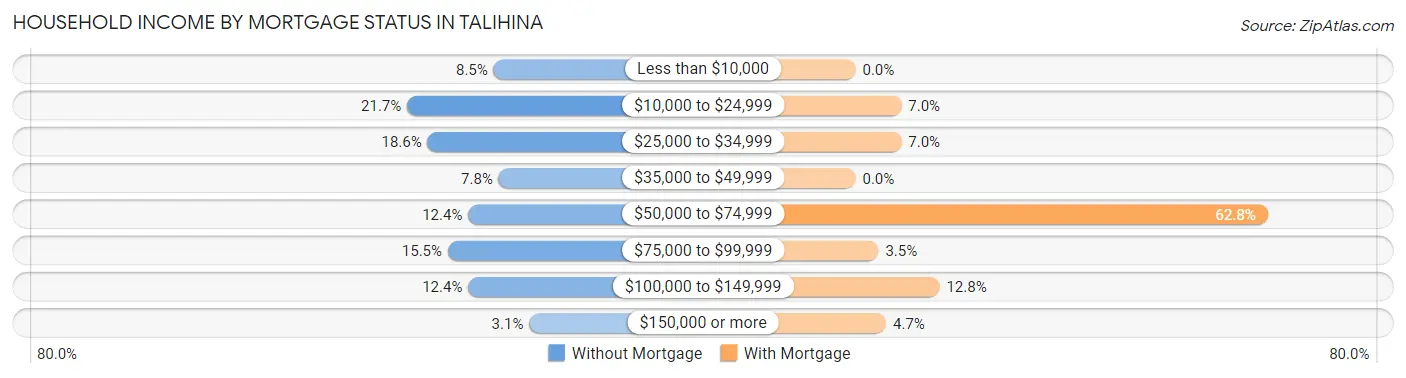
| Household Income | Without Mortgage | With Mortgage |
| Less than $10,000 | 11 (8.5%) | 0 (0.0%) |
| $10,000 to $24,999 | 28 (21.7%) | 6 (7.0%) |
| $25,000 to $34,999 | 24 (18.6%) | 6 (7.0%) |
| $35,000 to $49,999 | 10 (7.7%) | 0 (0.0%) |
| $50,000 to $74,999 | 16 (12.4%) | 54 (62.8%) |
| $75,000 to $99,999 | 20 (15.5%) | 3 (3.5%) |
| $100,000 to $149,999 | 16 (12.4%) | 11 (12.8%) |
| $150,000 or more | 4 (3.1%) | 4 (4.6%) |
| Total | 129 (100.0%) | 86 (100.0%) |
Property Value to Household Income Ratio in Talihina
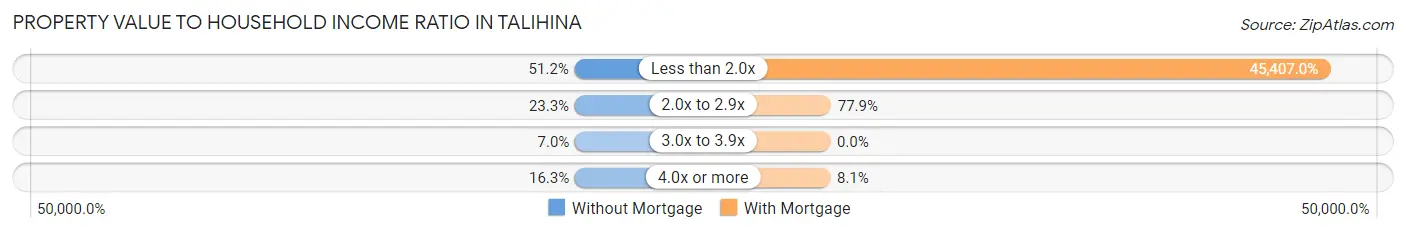
| Value-to-Income Ratio | Without Mortgage | With Mortgage |
| Less than 2.0x | 66 (51.2%) | 39,050 (45,407.0%) |
| 2.0x to 2.9x | 30 (23.3%) | 67 (77.9%) |
| 3.0x to 3.9x | 9 (7.0%) | 0 (0.0%) |
| 4.0x or more | 21 (16.3%) | 7 (8.1%) |
| Total | 129 (100.0%) | 86 (100.0%) |
Real Estate Taxes by Mortgage Status in Talihina
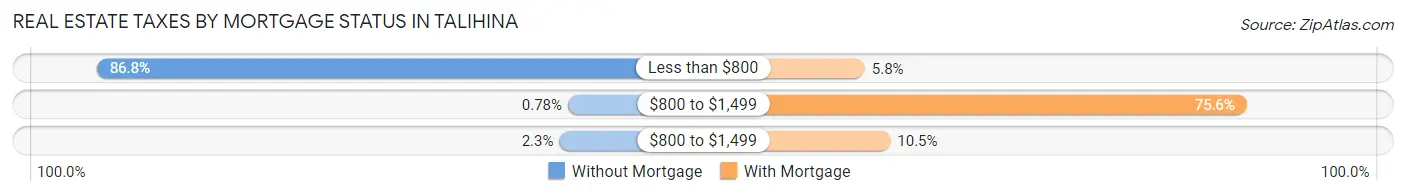
| Property Taxes | Without Mortgage | With Mortgage |
| Less than $800 | 112 (86.8%) | 5 (5.8%) |
| $800 to $1,499 | 1 (0.8%) | 65 (75.6%) |
| $800 to $1,499 | 3 (2.3%) | 9 (10.5%) |
| Total | 129 (100.0%) | 86 (100.0%) |
Health & Disability in Talihina
Health Insurance Coverage by Age in Talihina
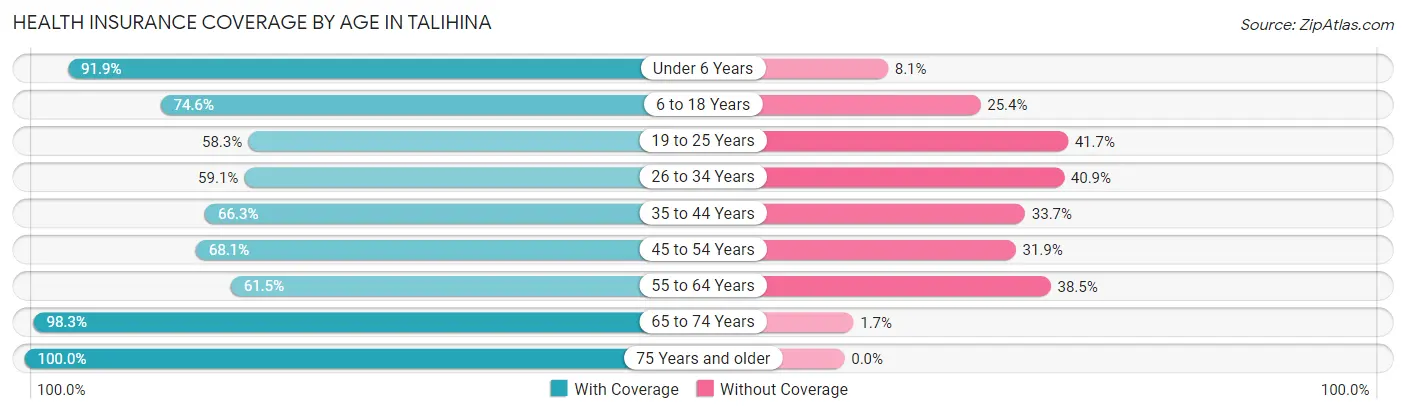
| Age Bracket | With Coverage | Without Coverage |
| Under 6 Years | 34 (91.9%) | 3 (8.1%) |
| 6 to 18 Years | 103 (74.6%) | 35 (25.4%) |
| 19 to 25 Years | 14 (58.3%) | 10 (41.7%) |
| 26 to 34 Years | 75 (59.1%) | 52 (40.9%) |
| 35 to 44 Years | 65 (66.3%) | 33 (33.7%) |
| 45 to 54 Years | 49 (68.1%) | 23 (31.9%) |
| 55 to 64 Years | 64 (61.5%) | 40 (38.5%) |
| 65 to 74 Years | 117 (98.3%) | 2 (1.7%) |
| 75 Years and older | 114 (100.0%) | 0 (0.0%) |
| Total | 635 (76.2%) | 198 (23.8%) |
Health Insurance Coverage by Citizenship Status in Talihina
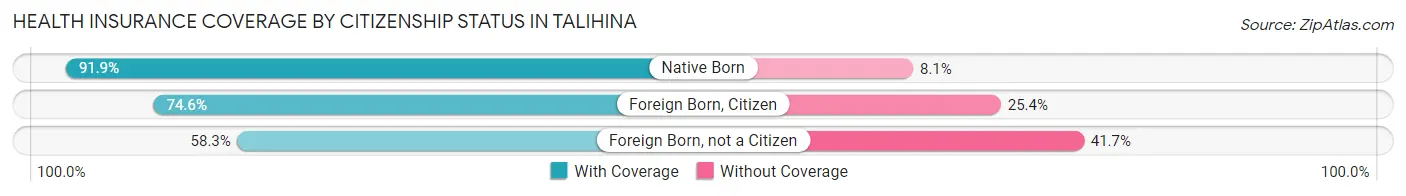
| Citizenship Status | With Coverage | Without Coverage |
| Native Born | 34 (91.9%) | 3 (8.1%) |
| Foreign Born, Citizen | 103 (74.6%) | 35 (25.4%) |
| Foreign Born, not a Citizen | 14 (58.3%) | 10 (41.7%) |
Health Insurance Coverage by Household Income in Talihina
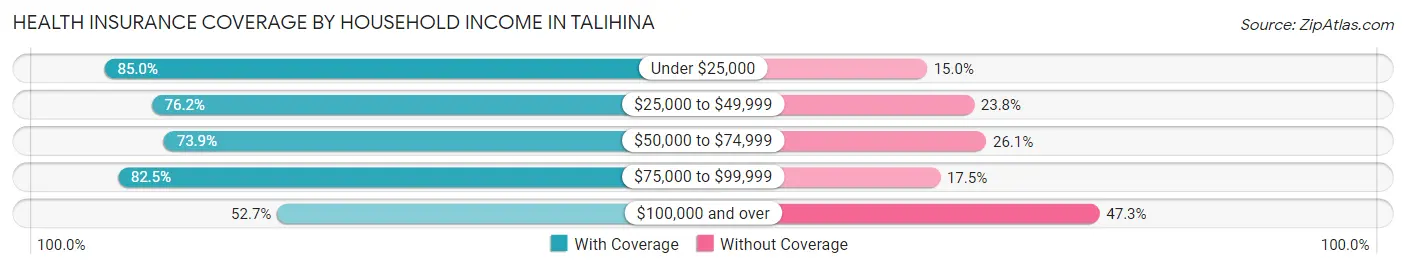
| Household Income | With Coverage | Without Coverage |
| Under $25,000 | 210 (85.0%) | 37 (15.0%) |
| $25,000 to $49,999 | 160 (76.2%) | 50 (23.8%) |
| $50,000 to $74,999 | 102 (73.9%) | 36 (26.1%) |
| $75,000 to $99,999 | 104 (82.5%) | 22 (17.5%) |
| $100,000 and over | 59 (52.7%) | 53 (47.3%) |
Public vs Private Health Insurance Coverage by Age in Talihina
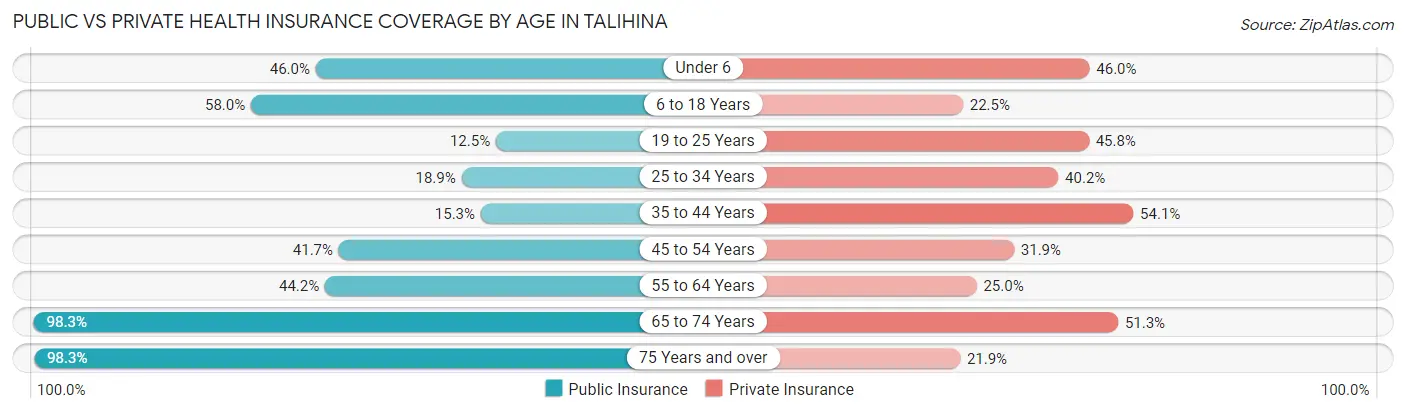
| Age Bracket | Public Insurance | Private Insurance |
| Under 6 | 17 (46.0%) | 17 (46.0%) |
| 6 to 18 Years | 80 (58.0%) | 31 (22.5%) |
| 19 to 25 Years | 3 (12.5%) | 11 (45.8%) |
| 25 to 34 Years | 24 (18.9%) | 51 (40.2%) |
| 35 to 44 Years | 15 (15.3%) | 53 (54.1%) |
| 45 to 54 Years | 30 (41.7%) | 23 (31.9%) |
| 55 to 64 Years | 46 (44.2%) | 26 (25.0%) |
| 65 to 74 Years | 117 (98.3%) | 61 (51.3%) |
| 75 Years and over | 112 (98.3%) | 25 (21.9%) |
| Total | 444 (53.3%) | 298 (35.8%) |
Disability Status by Sex by Age in Talihina
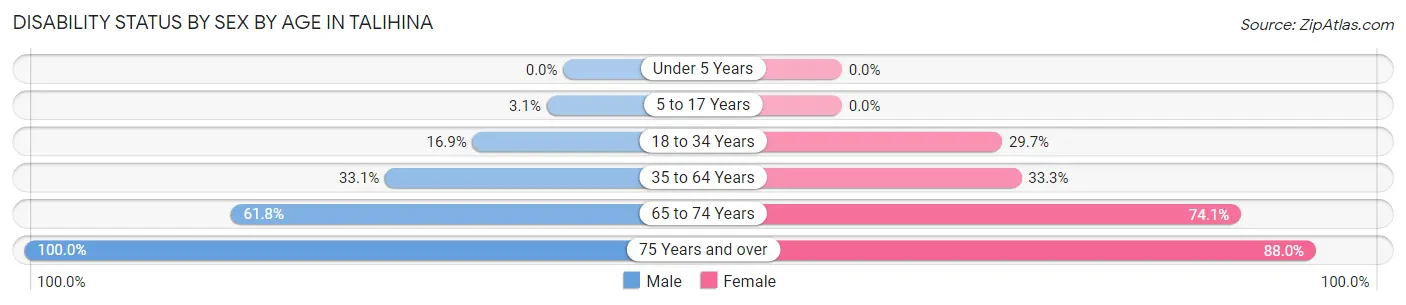
| Age Bracket | Male | Female |
| Under 5 Years | 0 (0.0%) | 0 (0.0%) |
| 5 to 17 Years | 2 (3.1%) | 0 (0.0%) |
| 18 to 34 Years | 15 (16.9%) | 22 (29.7%) |
| 35 to 64 Years | 43 (33.1%) | 48 (33.3%) |
| 65 to 74 Years | 21 (61.8%) | 63 (74.1%) |
| 75 Years and over | 14 (100.0%) | 88 (88.0%) |
Disability Class by Sex by Age in Talihina
Disability Class: Hearing Difficulty
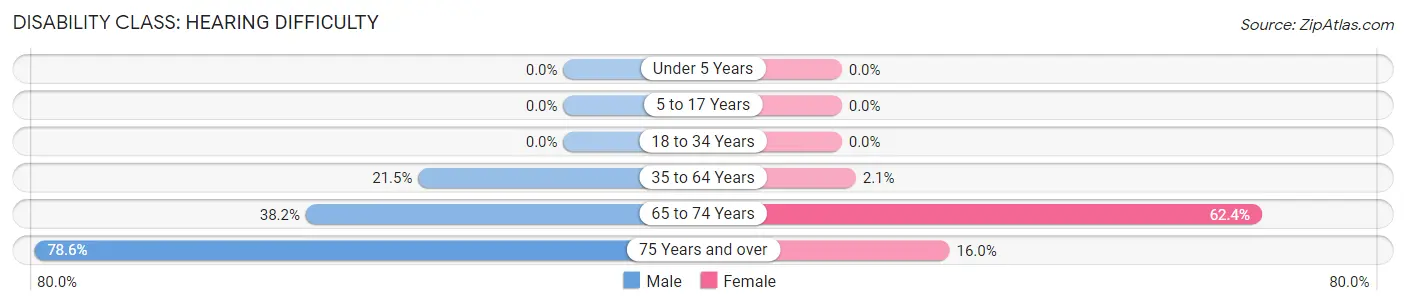
| Age Bracket | Male | Female |
| Under 5 Years | 0 (0.0%) | 0 (0.0%) |
| 5 to 17 Years | 0 (0.0%) | 0 (0.0%) |
| 18 to 34 Years | 0 (0.0%) | 0 (0.0%) |
| 35 to 64 Years | 28 (21.5%) | 3 (2.1%) |
| 65 to 74 Years | 13 (38.2%) | 53 (62.4%) |
| 75 Years and over | 11 (78.6%) | 16 (16.0%) |
Disability Class: Vision Difficulty
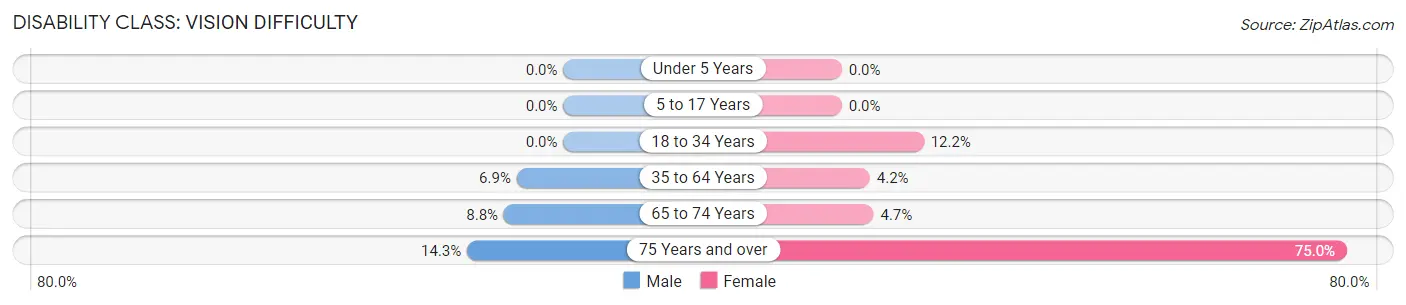
| Age Bracket | Male | Female |
| Under 5 Years | 0 (0.0%) | 0 (0.0%) |
| 5 to 17 Years | 0 (0.0%) | 0 (0.0%) |
| 18 to 34 Years | 0 (0.0%) | 9 (12.2%) |
| 35 to 64 Years | 9 (6.9%) | 6 (4.2%) |
| 65 to 74 Years | 3 (8.8%) | 4 (4.7%) |
| 75 Years and over | 2 (14.3%) | 75 (75.0%) |
Disability Class: Cognitive Difficulty
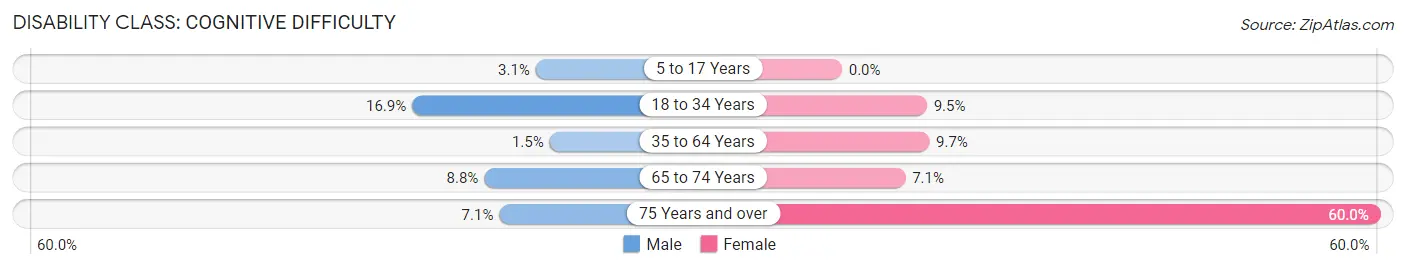
| Age Bracket | Male | Female |
| 5 to 17 Years | 2 (3.1%) | 0 (0.0%) |
| 18 to 34 Years | 15 (16.9%) | 7 (9.5%) |
| 35 to 64 Years | 2 (1.5%) | 14 (9.7%) |
| 65 to 74 Years | 3 (8.8%) | 6 (7.1%) |
| 75 Years and over | 1 (7.1%) | 60 (60.0%) |
Disability Class: Ambulatory Difficulty
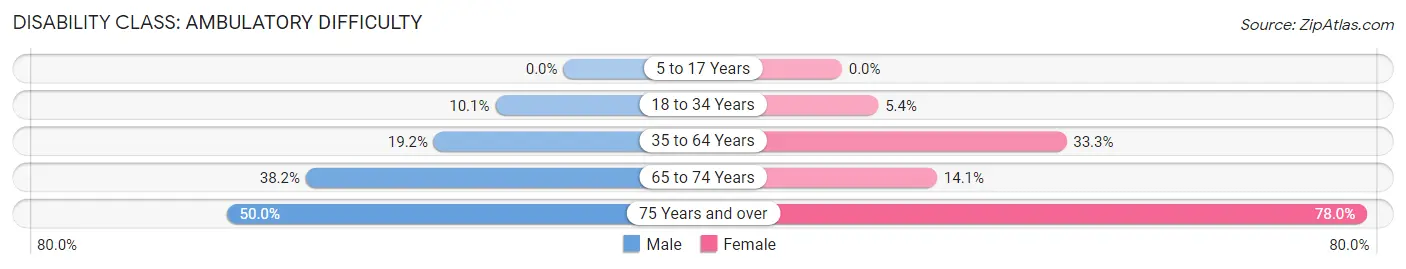
| Age Bracket | Male | Female |
| 5 to 17 Years | 0 (0.0%) | 0 (0.0%) |
| 18 to 34 Years | 9 (10.1%) | 4 (5.4%) |
| 35 to 64 Years | 25 (19.2%) | 48 (33.3%) |
| 65 to 74 Years | 13 (38.2%) | 12 (14.1%) |
| 75 Years and over | 7 (50.0%) | 78 (78.0%) |
Disability Class: Self-Care Difficulty
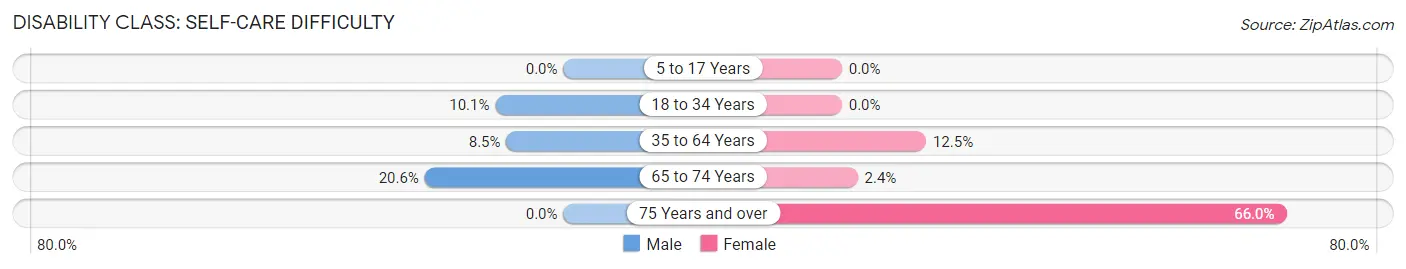
| Age Bracket | Male | Female |
| 5 to 17 Years | 0 (0.0%) | 0 (0.0%) |
| 18 to 34 Years | 9 (10.1%) | 0 (0.0%) |
| 35 to 64 Years | 11 (8.5%) | 18 (12.5%) |
| 65 to 74 Years | 7 (20.6%) | 2 (2.4%) |
| 75 Years and over | 0 (0.0%) | 66 (66.0%) |
Technology Access in Talihina
Computing Device Access in Talihina
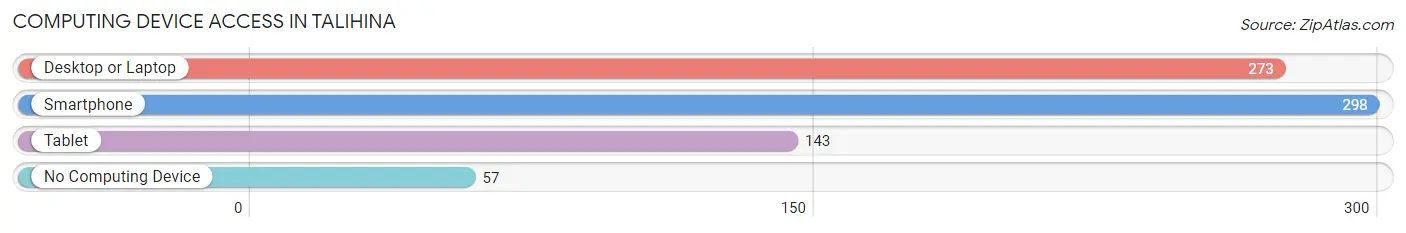
| Device Type | # Households | % Households |
| Desktop or Laptop | 273 | 65.6% |
| Smartphone | 298 | 71.6% |
| Tablet | 143 | 34.4% |
| No Computing Device | 57 | 13.7% |
| Total | 416 | 100.0% |
Internet Access in Talihina
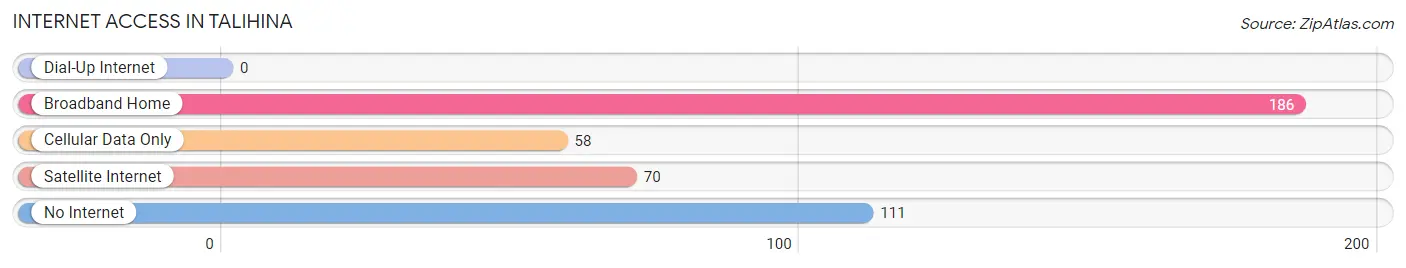
| Internet Type | # Households | % Households |
| Dial-Up Internet | 0 | 0.0% |
| Broadband Home | 186 | 44.7% |
| Cellular Data Only | 58 | 13.9% |
| Satellite Internet | 70 | 16.8% |
| No Internet | 111 | 26.7% |
| Total | 416 | 100.0% |
Talihina Summary
Talihina is a small town located in LeFlore County, Oklahoma. It is situated in the foothills of the Ouachita Mountains, near the Arkansas border. The town was founded in 1884 and was named after the Choctaw words for “iron road”. Talihina is the county seat of LeFlore County and is home to a population of approximately 1,500 people.
History
The area that is now Talihina was originally inhabited by the Choctaw Indians. The Choctaw were forced to move to the area in the 1830s as part of the Indian Removal Act. The town of Talihina was founded in 1884 and was named after the Choctaw words for “iron road”. The town was originally a stop on the St. Louis and San Francisco Railway.
In the early 1900s, Talihina was a bustling town with a population of over 1,000 people. The town was home to several businesses, including a hotel, a bank, a newspaper, and a variety of stores. The town also had a school, a post office, and a hospital.
In the 1920s, Talihina experienced a period of economic decline. The Great Depression caused many businesses to close and the population of the town decreased. In the 1940s, the town experienced a resurgence in population and economic activity. The town was home to several manufacturing plants, including a cotton mill and a furniture factory.
Geography
Talihina is located in the foothills of the Ouachita Mountains in southeastern Oklahoma. The town is situated at the intersection of U.S. Highway 271 and State Highway 63. Talihina is approximately 90 miles southeast of Tulsa and 120 miles northeast of Oklahoma City.
The town is located in a region of rolling hills and forests. The area is known for its scenic beauty and is home to several state parks, including Talimena State Park and Robbers Cave State Park.
Economy
The economy of Talihina is largely based on agriculture and tourism. The town is home to several farms and ranches, which produce a variety of crops, including cotton, corn, and soybeans. The town is also home to several tourist attractions, including the Talimena Scenic Drive, which is a popular destination for sightseers.
The town is also home to several manufacturing plants, including a furniture factory and a cotton mill. The town is also home to several retail stores, restaurants, and other businesses.
Demographics
As of the 2010 census, the population of Talihina was 1,521. The town is predominantly white, with approximately 90% of the population identifying as white. The town is also home to a small Hispanic population, with approximately 5% of the population identifying as Hispanic or Latino.
The median household income in Talihina is $30,000, which is lower than the national average. The town has a poverty rate of approximately 20%, which is higher than the national average.
Conclusion
Talihina is a small town located in LeFlore County, Oklahoma. The town was founded in 1884 and was named after the Choctaw words for “iron road”. Talihina is the county seat of LeFlore County and is home to a population of approximately 1,500 people. The town is situated in the foothills of the Ouachita Mountains and is known for its scenic beauty and tourist attractions. The economy of Talihina is largely based on agriculture and tourism. The town is predominantly white, with a small Hispanic population. The median household income in Talihina is lower than the national average and the town has a poverty rate of approximately 20%.
Common Questions
What is Per Capita Income in Talihina?
Per Capita income in Talihina is $21,247.
What is the Median Family Income in Talihina?
Median Family Income in Talihina is $43,571.
What is the Median Household income in Talihina?
Median Household Income in Talihina is $35,455.
What is Income or Wage Gap in Talihina?
Income or Wage Gap in Talihina is 43.3%.
Women in Talihina earn 56.7 cents for every dollar earned by a man.
What is Family Income Deficit in Talihina?
Family Income Deficit in Talihina is $13,838.
Families that are below poverty line in Talihina earn $13,838 less on average than the poverty threshold level.
What is Inequality or Gini Index in Talihina?
Inequality or Gini Index in Talihina is 0.45.
What is the Total Population of Talihina?
Total Population of Talihina is 870.
What is the Total Male Population of Talihina?
Total Male Population of Talihina is 373.
What is the Total Female Population of Talihina?
Total Female Population of Talihina is 497.
What is the Ratio of Males per 100 Females in Talihina?
There are 75.05 Males per 100 Females in Talihina.
What is the Ratio of Females per 100 Males in Talihina?
There are 133.24 Females per 100 Males in Talihina.
What is the Median Population Age in Talihina?
Median Population Age in Talihina is 45.5 Years.
What is the Average Family Size in Talihina
Average Family Size in Talihina is 2.6 People.
What is the Average Household Size in Talihina
Average Household Size in Talihina is 2.0 People.
How Large is the Labor Force in Talihina?
There are 345 People in the Labor Forcein in Talihina.
What is the Percentage of People in the Labor Force in Talihina?
47.0% of People are in the Labor Force in Talihina.
What is the Unemployment Rate in Talihina?
Unemployment Rate in Talihina is 5.2%.