Navajo Dam, NM Map & Demographics
Navajo Dam Map
Navajo Dam Overview
$31,930
PER CAPITA INCOME
$70,625
AVG FAMILY INCOME
$63,375
AVG HOUSEHOLD INCOME
0.38
INEQUALITY / GINI INDEX
330
TOTAL POPULATION
173
MALE POPULATION
157
FEMALE POPULATION
110.19
MALES / 100 FEMALES
90.75
FEMALES / 100 MALES
36.6
MEDIAN AGE
4.7
AVG FAMILY SIZE
3.7
AVG HOUSEHOLD SIZE
221
LABOR FORCE [ PEOPLE ]
76.5%
PERCENT IN LABOR FORCE
28.5%
UNEMPLOYMENT RATE
Navajo Dam Zip Codes
Navajo Dam Area Codes
Income in Navajo Dam
Income Overview in Navajo Dam
Per Capita Income in Navajo Dam is $31,930, while median incomes of families and households are $70,625 and $63,375 respectively.
| Characteristic | Number | Measure |
| Per Capita Income | 330 | $31,930 |
| Median Family Income | 64 | $70,625 |
| Mean Family Income | 64 | $75,106 |
| Median Household Income | 89 | $63,375 |
| Mean Household Income | 89 | $59,155 |
| Income Deficit | 64 | $0 |
| Wage / Income Gap (%) | 330 | 0.00% |
| Wage / Income Gap ($) | 330 | 100.00¢ per $1 |
| Gini / Inequality Index | 330 | 0.38 |
Earnings by Sex in Navajo Dam
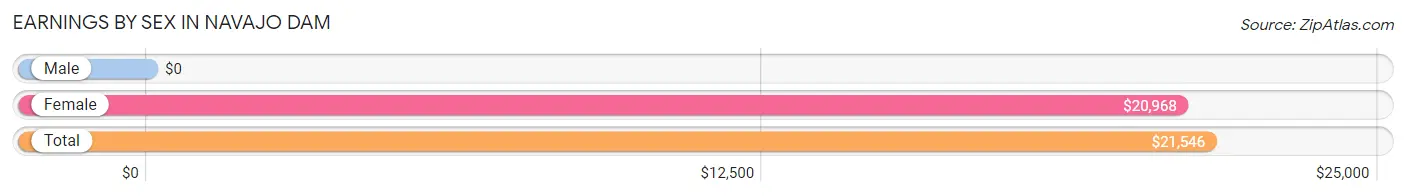
| Sex | Number | Average Earnings |
| Male | 101 (45.7%) | $0 |
| Female | 120 (54.3%) | $20,968 |
| Total | 221 (100.0%) | $21,546 |
Earnings by Sex by Income Bracket in Navajo Dam
The most common earnings brackets in Navajo Dam are $17,500 to $19,999 for men (25 | 24.7%) and $20,000 to $22,499 for women (93 | 77.5%).
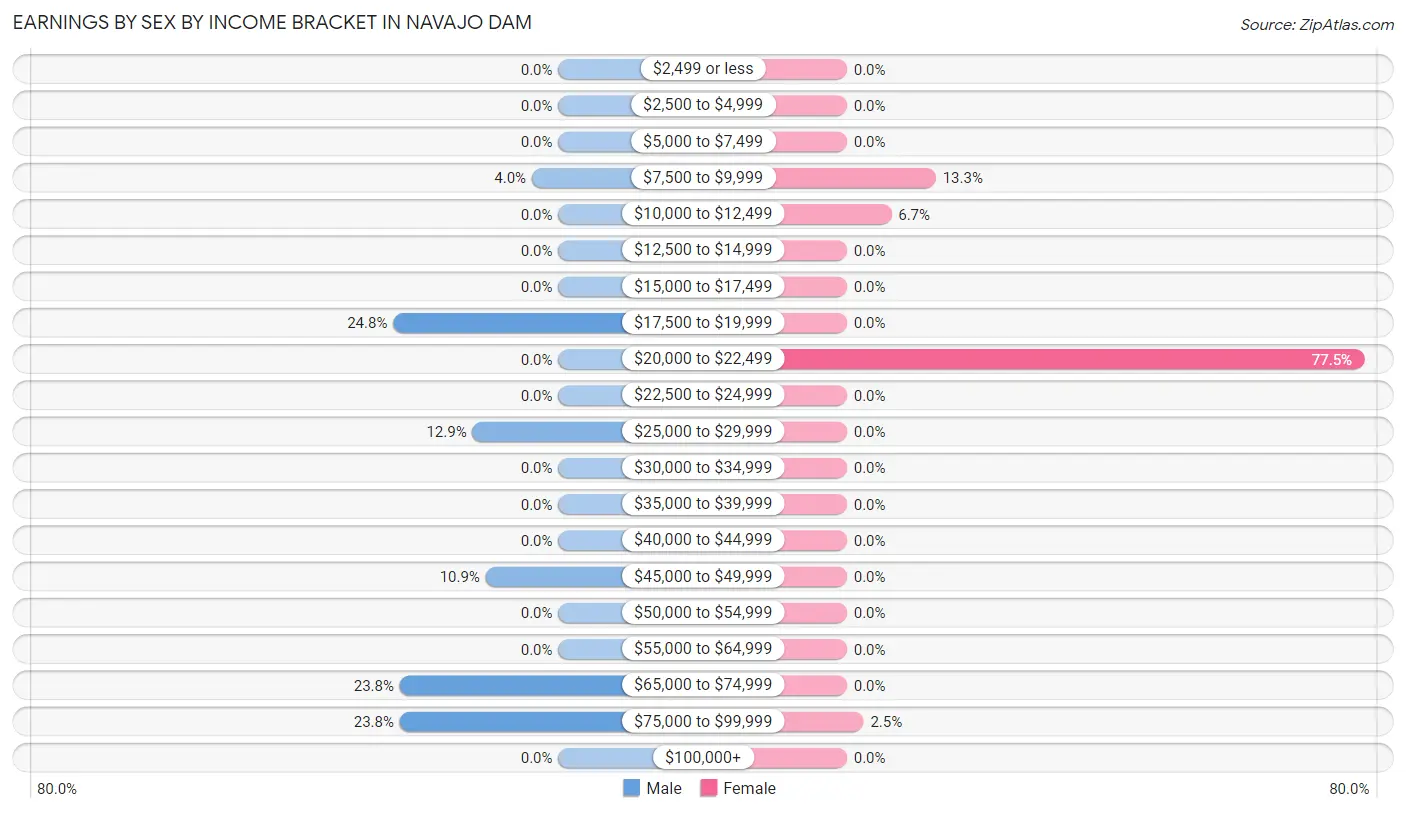
| Income | Male | Female |
| $2,499 or less | 0 (0.0%) | 0 (0.0%) |
| $2,500 to $4,999 | 0 (0.0%) | 0 (0.0%) |
| $5,000 to $7,499 | 0 (0.0%) | 0 (0.0%) |
| $7,500 to $9,999 | 4 (4.0%) | 16 (13.3%) |
| $10,000 to $12,499 | 0 (0.0%) | 8 (6.7%) |
| $12,500 to $14,999 | 0 (0.0%) | 0 (0.0%) |
| $15,000 to $17,499 | 0 (0.0%) | 0 (0.0%) |
| $17,500 to $19,999 | 25 (24.7%) | 0 (0.0%) |
| $20,000 to $22,499 | 0 (0.0%) | 93 (77.5%) |
| $22,500 to $24,999 | 0 (0.0%) | 0 (0.0%) |
| $25,000 to $29,999 | 13 (12.9%) | 0 (0.0%) |
| $30,000 to $34,999 | 0 (0.0%) | 0 (0.0%) |
| $35,000 to $39,999 | 0 (0.0%) | 0 (0.0%) |
| $40,000 to $44,999 | 0 (0.0%) | 0 (0.0%) |
| $45,000 to $49,999 | 11 (10.9%) | 0 (0.0%) |
| $50,000 to $54,999 | 0 (0.0%) | 0 (0.0%) |
| $55,000 to $64,999 | 0 (0.0%) | 0 (0.0%) |
| $65,000 to $74,999 | 24 (23.8%) | 0 (0.0%) |
| $75,000 to $99,999 | 24 (23.8%) | 3 (2.5%) |
| $100,000+ | 0 (0.0%) | 0 (0.0%) |
| Total | 101 (100.0%) | 120 (100.0%) |
Earnings by Sex by Educational Attainment in Navajo Dam
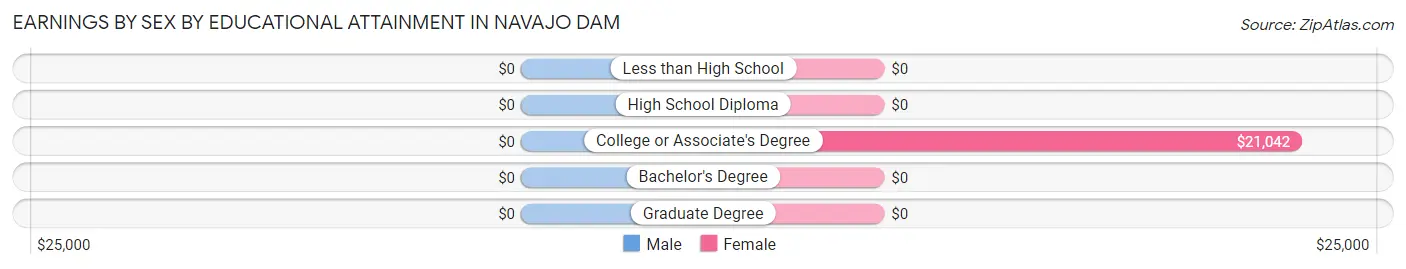
| Educational Attainment | Male Income | Female Income |
| Less than High School | - | - |
| High School Diploma | - | - |
| College or Associate's Degree | - | - |
| Bachelor's Degree | - | - |
| Graduate Degree | - | - |
| Total | $70,625 | $20,968 |
Family Income in Navajo Dam
Family Income Brackets in Navajo Dam
According to the Navajo Dam family income data, there are 34 families falling into the $50,000 to $74,999 income range, which is the most common income bracket and makes up 53.1% of all families.
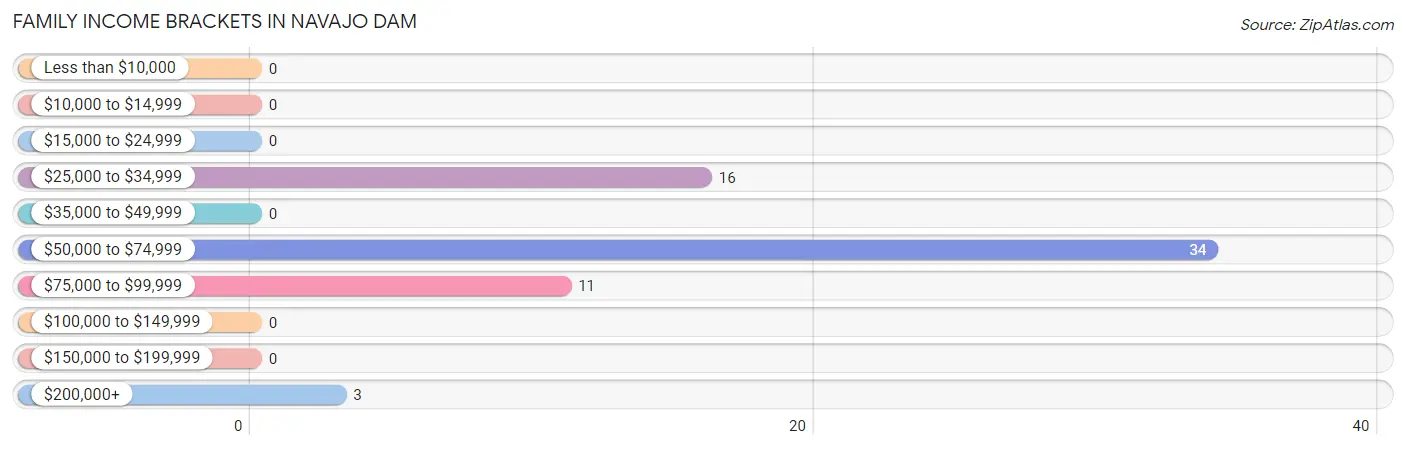
| Income Bracket | # Families | % Families |
| Less than $10,000 | 0 | 0.0% |
| $10,000 to $14,999 | 0 | 0.0% |
| $15,000 to $24,999 | 0 | 0.0% |
| $25,000 to $34,999 | 16 | 25.0% |
| $35,000 to $49,999 | 0 | 0.0% |
| $50,000 to $74,999 | 34 | 53.1% |
| $75,000 to $99,999 | 11 | 17.2% |
| $100,000 to $149,999 | 0 | 0.0% |
| $150,000 to $199,999 | 0 | 0.0% |
| $200,000+ | 3 | 4.7% |
Family Income by Famaliy Size in Navajo Dam
| Income Bracket | # Families | Median Income |
| 2-Person Families | 26 (40.6%) | $0 |
| 3-Person Families | 24 (37.5%) | $0 |
| 4-Person Families | 11 (17.2%) | $0 |
| 5-Person Families | 3 (4.7%) | $0 |
| 6-Person Families | 0 (0.0%) | $0 |
| 7+ Person Families | 0 (0.0%) | $0 |
| Total | 64 (100.0%) | $70,625 |
Family Income by Number of Earners in Navajo Dam
| Number of Earners | # Families | Median Income |
| No Earners | 10 (15.6%) | $0 |
| 1 Earner | 24 (37.5%) | $0 |
| 2 Earners | 27 (42.2%) | $0 |
| 3+ Earners | 3 (4.7%) | $0 |
| Total | 64 (100.0%) | $70,625 |
Household Income in Navajo Dam
Household Income Brackets in Navajo Dam
With 34 households falling in the category, the $50,000 to $74,999 income range is the most frequent in Navajo Dam, accounting for 38.2% of all households.
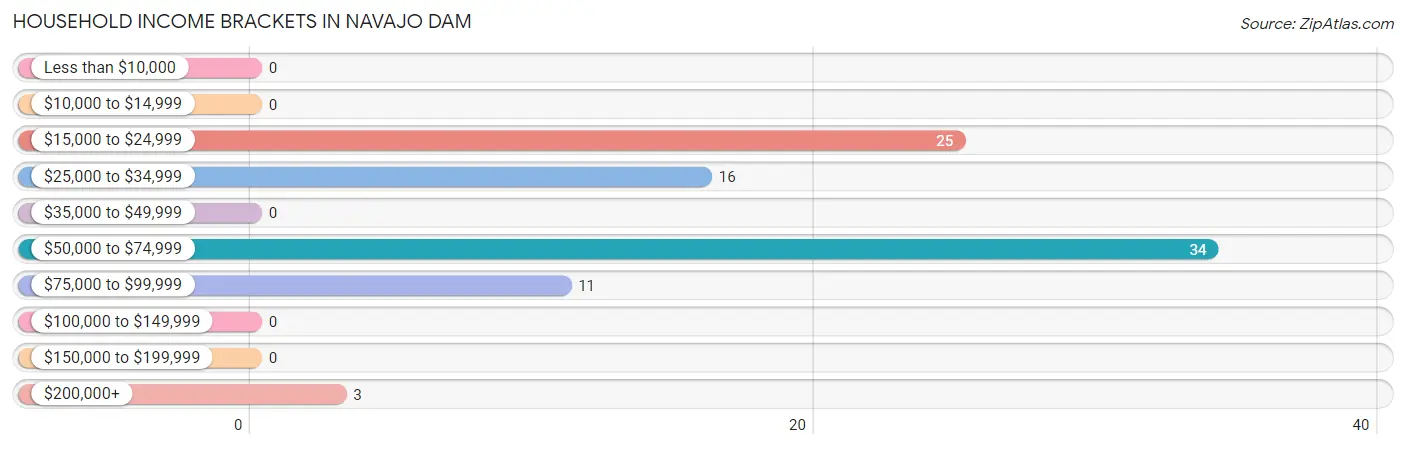
| Income Bracket | # Households | % Households |
| Less than $10,000 | 0 | 0.0% |
| $10,000 to $14,999 | 0 | 0.0% |
| $15,000 to $24,999 | 25 | 28.1% |
| $25,000 to $34,999 | 16 | 18.0% |
| $35,000 to $49,999 | 0 | 0.0% |
| $50,000 to $74,999 | 34 | 38.2% |
| $75,000 to $99,999 | 11 | 12.4% |
| $100,000 to $149,999 | 0 | 0.0% |
| $150,000 to $199,999 | 0 | 0.0% |
| $200,000+ | 3 | 3.4% |
Household Income by Householder Age in Navajo Dam
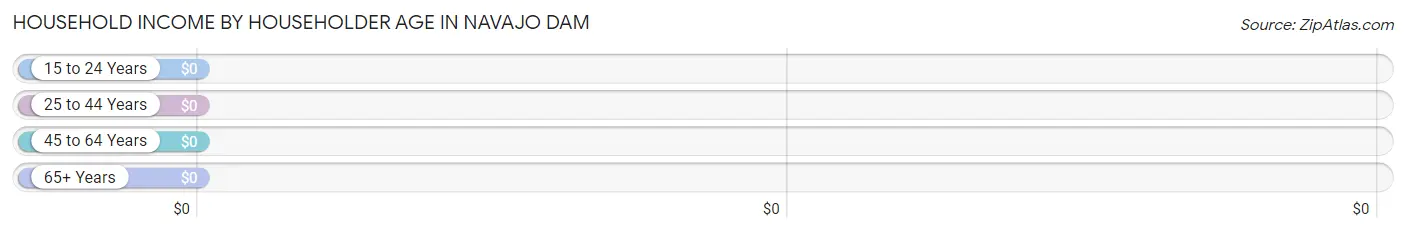
| Income Bracket | # Households | Median Income |
| 15 to 24 Years | 0 (0.0%) | $0 |
| 25 to 44 Years | 0 (0.0%) | $0 |
| 45 to 64 Years | 79 (88.8%) | $0 |
| 65+ Years | 10 (11.2%) | $0 |
| Total | 89 (100.0%) | $63,375 |
Poverty in Navajo Dam
Income Below Poverty by Sex and Age in Navajo Dam
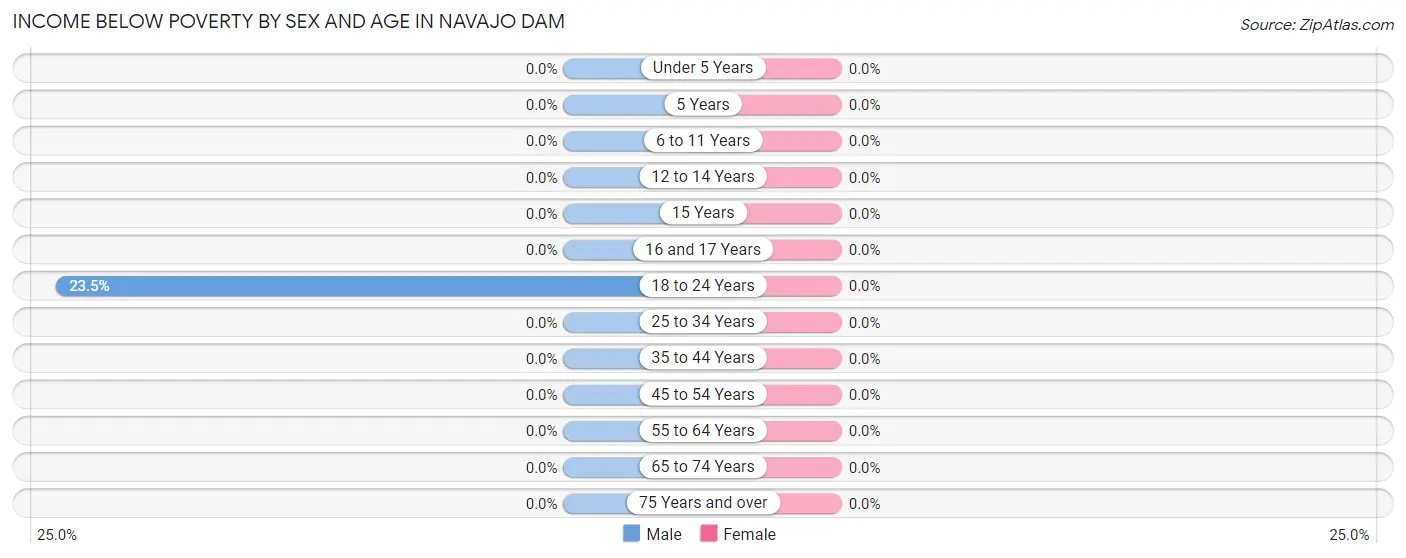
| Age Bracket | Male | Female |
| Under 5 Years | 0 (0.0%) | 0 (0.0%) |
| 5 Years | 0 (0.0%) | 0 (0.0%) |
| 6 to 11 Years | 0 (0.0%) | 0 (0.0%) |
| 12 to 14 Years | 0 (0.0%) | 0 (0.0%) |
| 15 Years | 0 (0.0%) | 0 (0.0%) |
| 16 and 17 Years | 0 (0.0%) | 0 (0.0%) |
| 18 to 24 Years | 4 (23.5%) | 0 (0.0%) |
| 25 to 34 Years | 0 (0.0%) | 0 (0.0%) |
| 35 to 44 Years | 0 (0.0%) | 0 (0.0%) |
| 45 to 54 Years | 0 (0.0%) | 0 (0.0%) |
| 55 to 64 Years | 0 (0.0%) | 0 (0.0%) |
| 65 to 74 Years | 0 (0.0%) | 0 (0.0%) |
| 75 Years and over | 0 (0.0%) | 0 (0.0%) |
| Total | 4 (2.3%) | 0 (0.0%) |
Income Above Poverty by Sex and Age in Navajo Dam
According to the poverty statistics in Navajo Dam, males aged 6 to 11 years and females aged 25 to 34 years are the age groups that are most secure financially, with 100.0% of males and 100.0% of females in these age groups living above the poverty line.
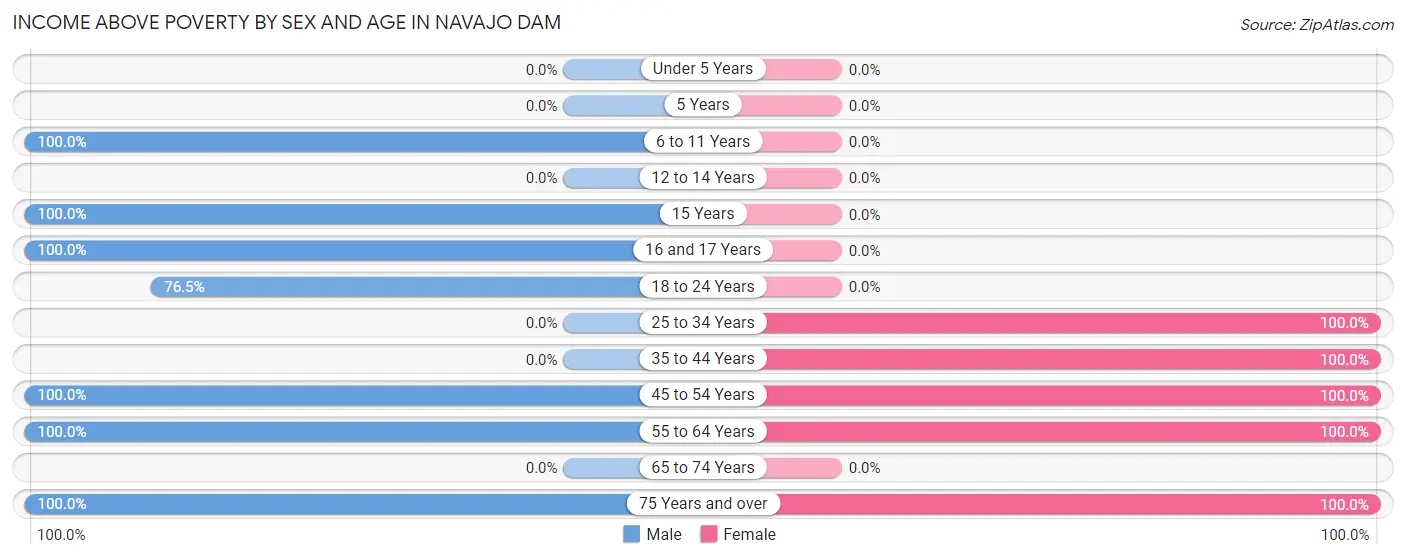
| Age Bracket | Male | Female |
| Under 5 Years | 0 (0.0%) | 0 (0.0%) |
| 5 Years | 0 (0.0%) | 0 (0.0%) |
| 6 to 11 Years | 29 (100.0%) | 0 (0.0%) |
| 12 to 14 Years | 0 (0.0%) | 0 (0.0%) |
| 15 Years | 12 (100.0%) | 0 (0.0%) |
| 16 and 17 Years | 19 (100.0%) | 0 (0.0%) |
| 18 to 24 Years | 13 (76.5%) | 0 (0.0%) |
| 25 to 34 Years | 0 (0.0%) | 71 (100.0%) |
| 35 to 44 Years | 0 (0.0%) | 30 (100.0%) |
| 45 to 54 Years | 59 (100.0%) | 30 (100.0%) |
| 55 to 64 Years | 25 (100.0%) | 16 (100.0%) |
| 65 to 74 Years | 0 (0.0%) | 0 (0.0%) |
| 75 Years and over | 12 (100.0%) | 10 (100.0%) |
| Total | 169 (97.7%) | 157 (100.0%) |
Income Below Poverty Among Married-Couple Families in Navajo Dam
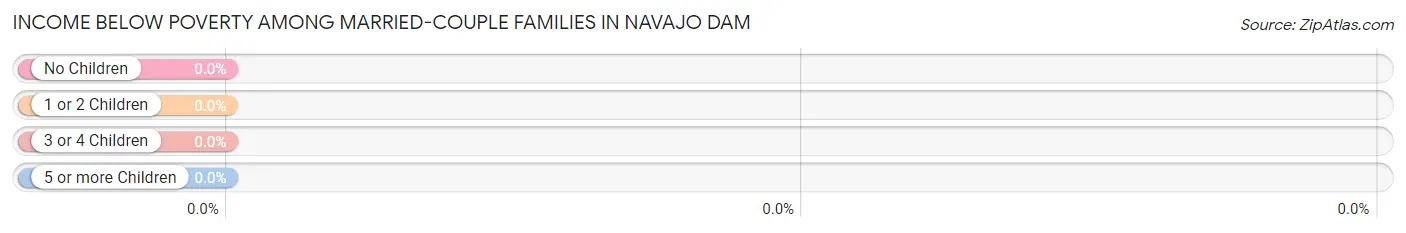
| Children | Above Poverty | Below Poverty |
| No Children | 10 (100.0%) | 0 (0.0%) |
| 1 or 2 Children | 38 (100.0%) | 0 (0.0%) |
| 3 or 4 Children | 0 (0.0%) | 0 (0.0%) |
| 5 or more Children | 0 (0.0%) | 0 (0.0%) |
| Total | 48 (100.0%) | 0 (0.0%) |
Income Below Poverty Among Single-Parent Households in Navajo Dam
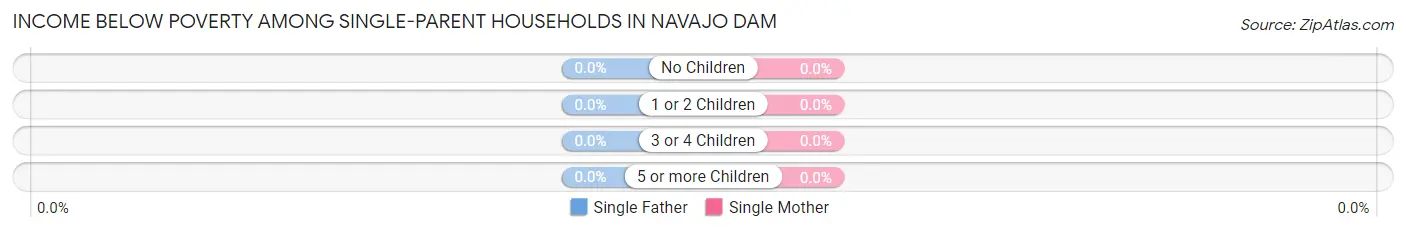
| Children | Single Father | Single Mother |
| No Children | 0 (0.0%) | 0 (0.0%) |
| 1 or 2 Children | 0 (0.0%) | 0 (0.0%) |
| 3 or 4 Children | 0 (0.0%) | 0 (0.0%) |
| 5 or more Children | 0 (0.0%) | 0 (0.0%) |
| Total | 0 (0.0%) | 0 (0.0%) |
Income Below Poverty Among Married-Couple vs Single-Parent Households in Navajo Dam
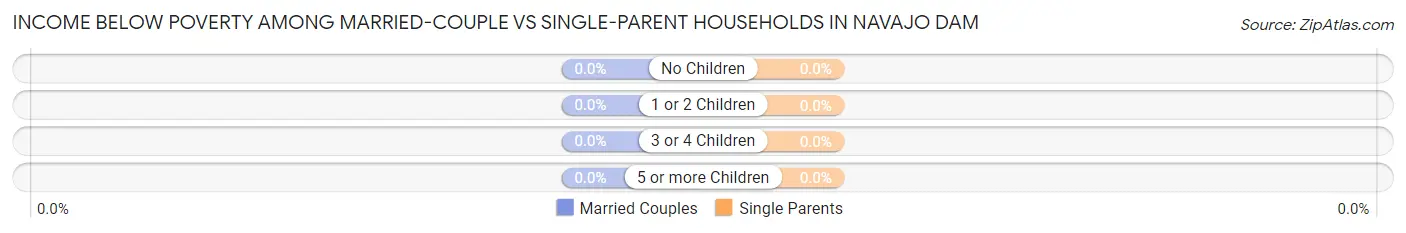
| Children | Married-Couple Families | Single-Parent Households |
| No Children | 0 (0.0%) | 0 (0.0%) |
| 1 or 2 Children | 0 (0.0%) | 0 (0.0%) |
| 3 or 4 Children | 0 (0.0%) | 0 (0.0%) |
| 5 or more Children | 0 (0.0%) | 0 (0.0%) |
| Total | 0 (0.0%) | 0 (0.0%) |
Race in Navajo Dam
The most populous races in Navajo Dam are White / Caucasian (274 | 83.0%), Hispanic or Latino (222 | 67.3%), and Two or more Races (35 | 10.6%).
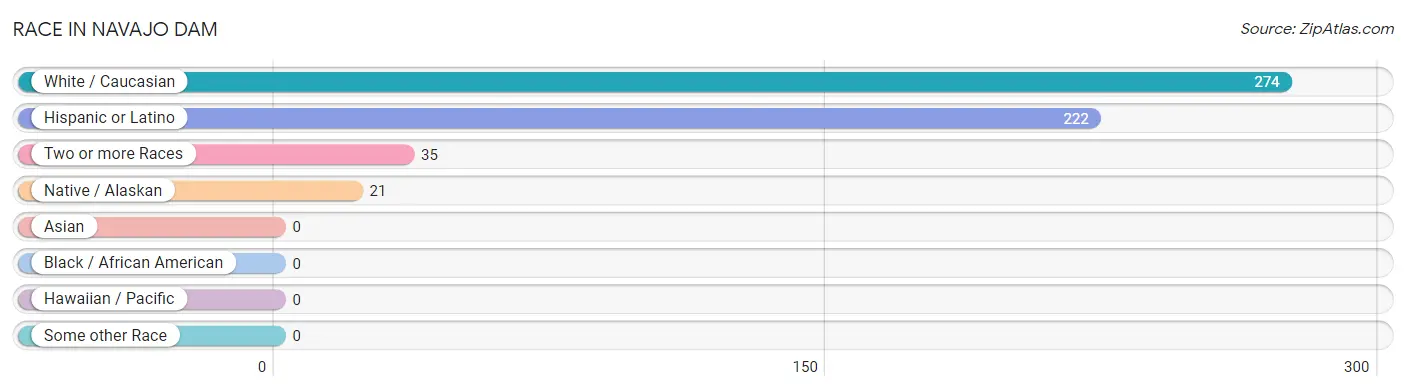
| Race | # Population | % Population |
| Asian | 0 | 0.0% |
| Black / African American | 0 | 0.0% |
| Hawaiian / Pacific | 0 | 0.0% |
| Hispanic or Latino | 222 | 67.3% |
| Native / Alaskan | 21 | 6.4% |
| White / Caucasian | 274 | 83.0% |
| Two or more Races | 35 | 10.6% |
| Some other Race | 0 | 0.0% |
| Total | 330 | 100.0% |
Ancestry in Navajo Dam
The most populous ancestries reported in Navajo Dam are Cuban (141 | 42.7%), German (107 | 32.4%), Mexican (81 | 24.5%), European (24 | 7.3%), and Navajo (21 | 6.4%), together accounting for 113.3% of all Navajo Dam residents.
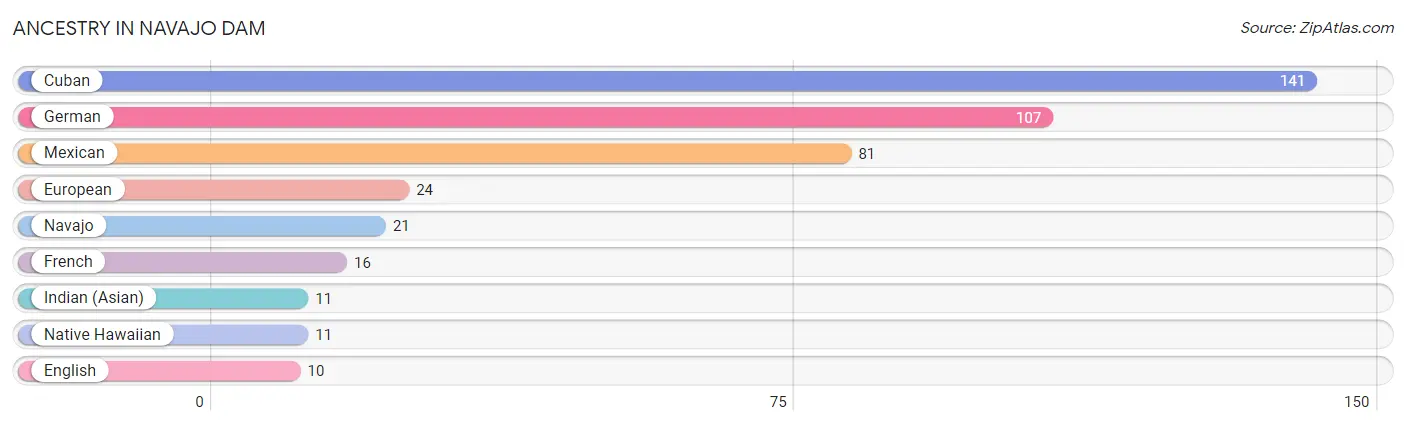
| Ancestry | # Population | % Population |
| Cuban | 141 | 42.7% |
| English | 10 | 3.0% |
| European | 24 | 7.3% |
| French | 16 | 4.9% |
| German | 107 | 32.4% |
| Indian (Asian) | 11 | 3.3% |
| Mexican | 81 | 24.5% |
| Native Hawaiian | 11 | 3.3% |
| Navajo | 21 | 6.4% | View All 9 Rows |
Immigrants in Navajo Dam
The most numerous immigrant groups reported in Navajo Dam came from Caribbean (25 | 7.6%), Cuba (25 | 7.6%), and Latin America (25 | 7.6%), together accounting for 22.7% of all Navajo Dam residents.
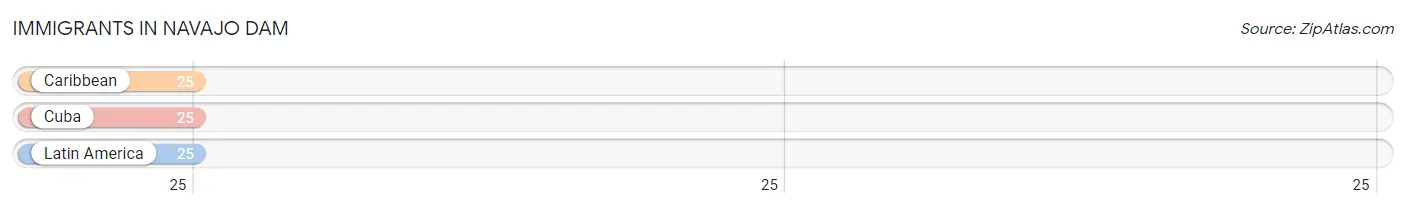
| Immigration Origin | # Population | % Population |
| Caribbean | 25 | 7.6% |
| Cuba | 25 | 7.6% |
| Latin America | 25 | 7.6% | View All 3 Rows |
Sex and Age in Navajo Dam
Sex and Age in Navajo Dam
The most populous age groups in Navajo Dam are 50 to 54 Years (48 | 27.8%) for men and 25 to 29 Years (71 | 45.2%) for women.
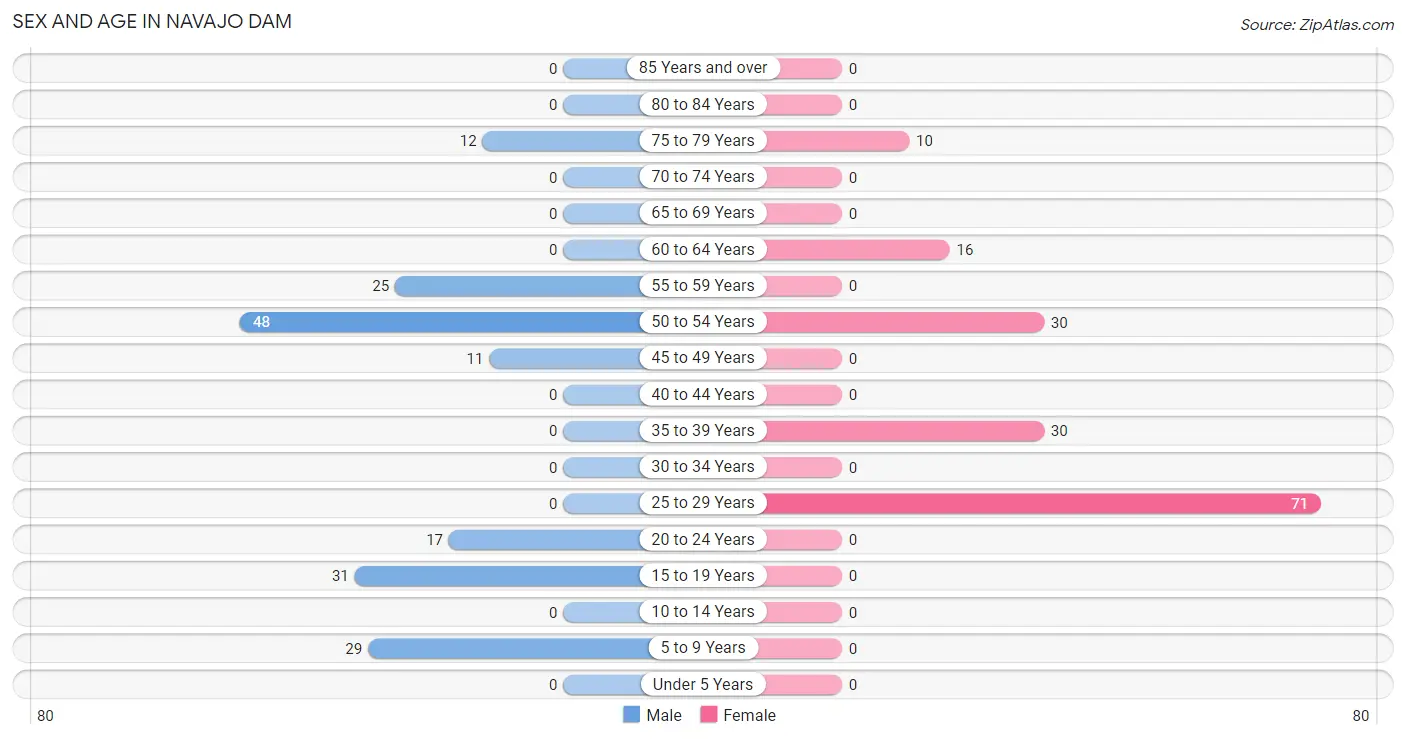
| Age Bracket | Male | Female |
| Under 5 Years | 0 (0.0%) | 0 (0.0%) |
| 5 to 9 Years | 29 (16.8%) | 0 (0.0%) |
| 10 to 14 Years | 0 (0.0%) | 0 (0.0%) |
| 15 to 19 Years | 31 (17.9%) | 0 (0.0%) |
| 20 to 24 Years | 17 (9.8%) | 0 (0.0%) |
| 25 to 29 Years | 0 (0.0%) | 71 (45.2%) |
| 30 to 34 Years | 0 (0.0%) | 0 (0.0%) |
| 35 to 39 Years | 0 (0.0%) | 30 (19.1%) |
| 40 to 44 Years | 0 (0.0%) | 0 (0.0%) |
| 45 to 49 Years | 11 (6.4%) | 0 (0.0%) |
| 50 to 54 Years | 48 (27.8%) | 30 (19.1%) |
| 55 to 59 Years | 25 (14.4%) | 0 (0.0%) |
| 60 to 64 Years | 0 (0.0%) | 16 (10.2%) |
| 65 to 69 Years | 0 (0.0%) | 0 (0.0%) |
| 70 to 74 Years | 0 (0.0%) | 0 (0.0%) |
| 75 to 79 Years | 12 (6.9%) | 10 (6.4%) |
| 80 to 84 Years | 0 (0.0%) | 0 (0.0%) |
| 85 Years and over | 0 (0.0%) | 0 (0.0%) |
| Total | 173 (100.0%) | 157 (100.0%) |
Families and Households in Navajo Dam
Median Family Size in Navajo Dam
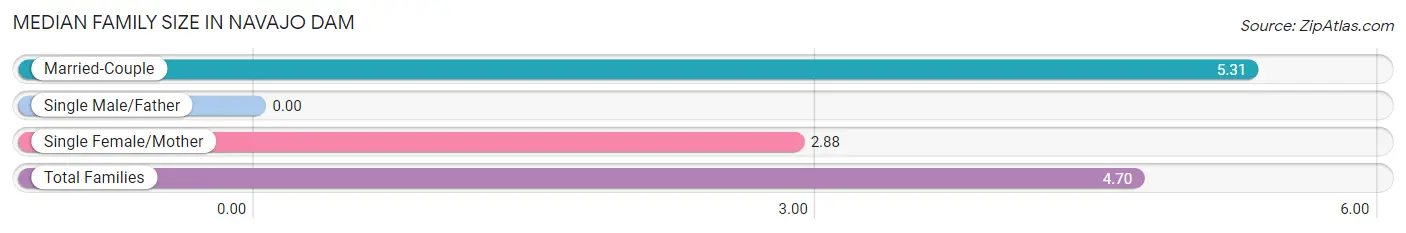
| Family Type | # Families | Family Size |
| Married-Couple | 48 (75.0%) | 5.31 |
| Single Male/Father | 0 (0.0%) | - |
| Single Female/Mother | 16 (25.0%) | 2.88 |
| Total Families | 64 (100.0%) | 4.70 |
Median Household Size in Navajo Dam
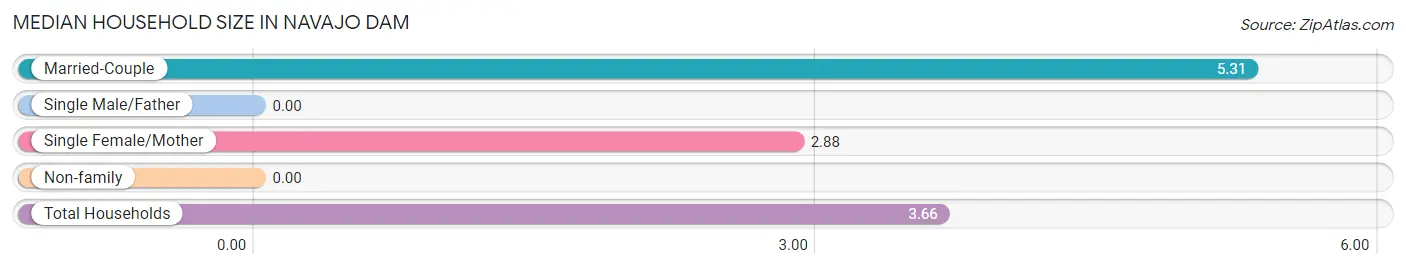
| Household Type | # Households | Household Size |
| Married-Couple | 48 (53.9%) | 5.31 |
| Single Male/Father | 0 (0.0%) | - |
| Single Female/Mother | 16 (18.0%) | 2.88 |
| Non-family | 25 (28.1%) | - |
| Total Households | 89 (100.0%) | 3.66 |
Household Size by Marriage Status in Navajo Dam
Out of a total of 89 households in Navajo Dam, 64 (71.9%) are family households, while 25 (28.1%) are nonfamily households. The most numerous type of family households are 2-person households, comprising 26, and the most common type of nonfamily households are 1-person households, comprising 25.
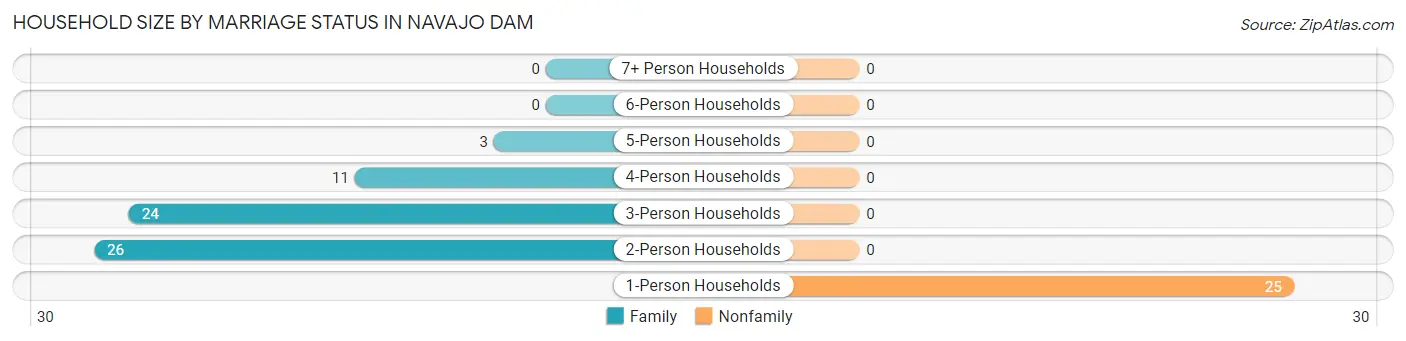
| Household Size | Family Households | Nonfamily Households |
| 1-Person Households | - | 25 (28.1%) |
| 2-Person Households | 26 (29.2%) | 0 (0.0%) |
| 3-Person Households | 24 (27.0%) | 0 (0.0%) |
| 4-Person Households | 11 (12.4%) | 0 (0.0%) |
| 5-Person Households | 3 (3.4%) | 0 (0.0%) |
| 6-Person Households | 0 (0.0%) | 0 (0.0%) |
| 7+ Person Households | 0 (0.0%) | 0 (0.0%) |
| Total | 64 (71.9%) | 25 (28.1%) |
Female Fertility in Navajo Dam
Fertility by Age in Navajo Dam
| Age Bracket | Women with Births | Births / 1,000 Women |
| 15 to 19 years | 0 (0.0%) | 0.0 |
| 20 to 34 years | 0 (0.0%) | 0.0 |
| 35 to 50 years | 0 (0.0%) | 0.0 |
| Total | 0 (0.0%) | 0.0 |
Fertility by Age by Marriage Status in Navajo Dam
| Age Bracket | Married | Unmarried |
| 15 to 19 years | 0 (0.0%) | 0 (0.0%) |
| 20 to 34 years | 0 (0.0%) | 0 (0.0%) |
| 35 to 50 years | 0 (0.0%) | 0 (0.0%) |
| Total | 0 (0.0%) | 0 (0.0%) |
Fertility by Education in Navajo Dam
| Educational Attainment | Women with Births | Births / 1,000 Women |
| Less than High School | 0 (0.0%) | 0.0 |
| High School Diploma | 0 (0.0%) | 0.0 |
| College or Associate's Degree | 0 (0.0%) | 0.0 |
| Bachelor's Degree | 0 (0.0%) | 0.0 |
| Graduate Degree | 0 (0.0%) | 0.0 |
| Total | 0 (0.0%) | 0.0 |
Fertility by Education by Marriage Status in Navajo Dam
| Educational Attainment | Married | Unmarried |
| Less than High School | 0 (0.0%) | 0 (0.0%) |
| High School Diploma | 0 (0.0%) | 0 (0.0%) |
| College or Associate's Degree | 0 (0.0%) | 0 (0.0%) |
| Bachelor's Degree | 0 (0.0%) | 0 (0.0%) |
| Graduate Degree | 0 (0.0%) | 0 (0.0%) |
| Total | 0 (0.0%) | 0 (0.0%) |
Employment Characteristics in Navajo Dam
Employment by Class of Employer in Navajo Dam
Among the 158 employed individuals in Navajo Dam, private company employees (102 | 64.6%), state government employees (27 | 17.1%), and self-employed (not incorporated) (25 | 15.8%) make up the most common classes of employment.
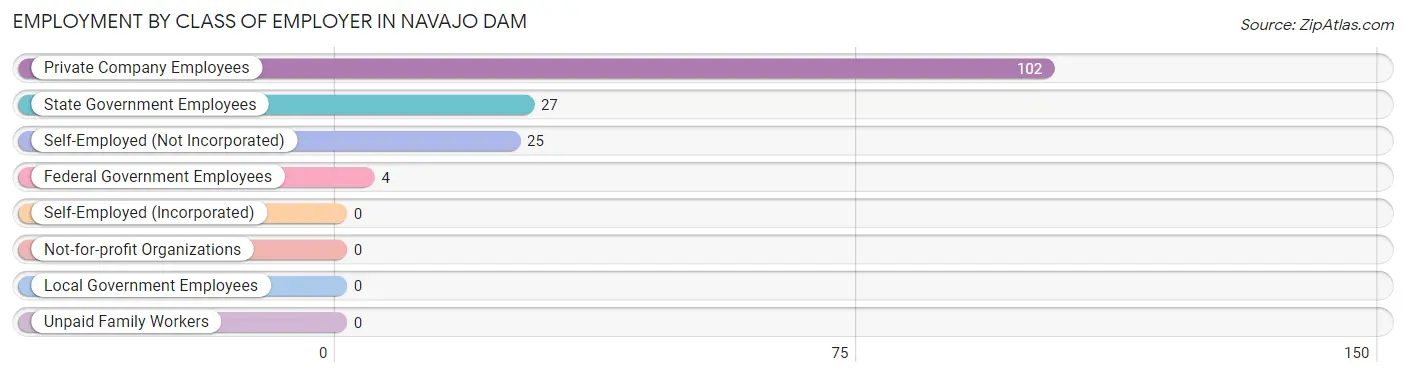
| Employer Class | # Employees | % Employees |
| Private Company Employees | 102 | 64.6% |
| Self-Employed (Incorporated) | 0 | 0.0% |
| Self-Employed (Not Incorporated) | 25 | 15.8% |
| Not-for-profit Organizations | 0 | 0.0% |
| Local Government Employees | 0 | 0.0% |
| State Government Employees | 27 | 17.1% |
| Federal Government Employees | 4 | 2.5% |
| Unpaid Family Workers | 0 | 0.0% |
| Total | 158 | 100.0% |
Employment Status by Age in Navajo Dam
According to the labor force statistics for Navajo Dam, out of the total population over 16 years of age (289), 76.5% or 221 individuals are in the labor force, with 28.5% or 63 of them unemployed. The age group with the highest labor force participation rate is 20 to 24 years, with 100.0% or 17 individuals in the labor force. Within the labor force, the 25 to 29 years age range has the highest percentage of unemployed individuals, with 88.7% or 63 of them being unemployed.
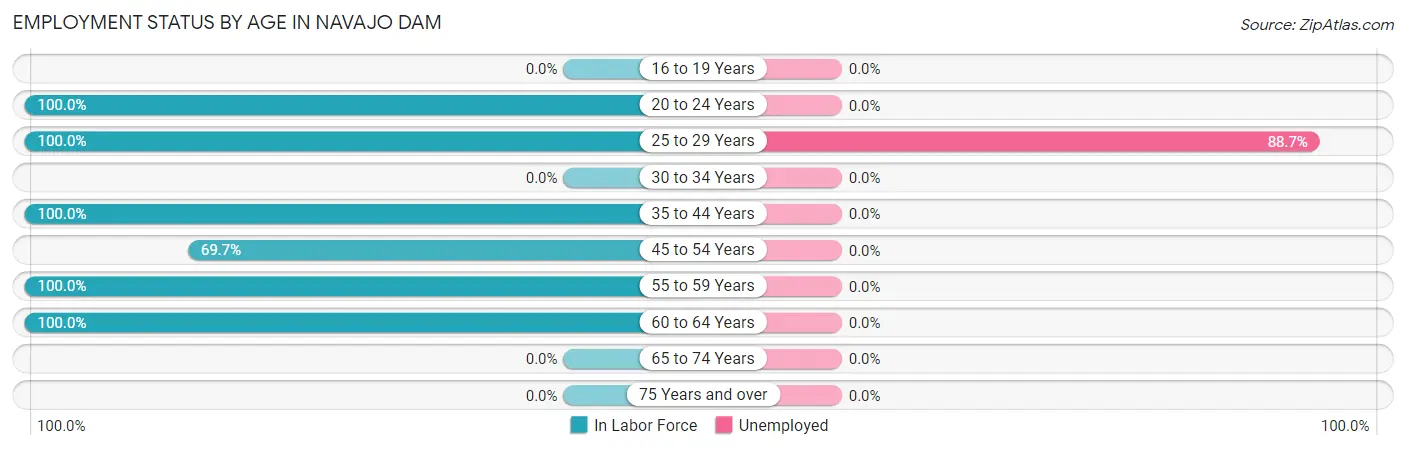
| Age Bracket | In Labor Force | Unemployed |
| 16 to 19 Years | 0 (0.0%) | 0 (0.0%) |
| 20 to 24 Years | 17 (100.0%) | 0 (0.0%) |
| 25 to 29 Years | 71 (100.0%) | 63 (88.7%) |
| 30 to 34 Years | 0 (0.0%) | 0 (0.0%) |
| 35 to 44 Years | 30 (100.0%) | 0 (0.0%) |
| 45 to 54 Years | 62 (69.7%) | 0 (0.0%) |
| 55 to 59 Years | 25 (100.0%) | 0 (0.0%) |
| 60 to 64 Years | 16 (100.0%) | 0 (0.0%) |
| 65 to 74 Years | 0 (0.0%) | 0 (0.0%) |
| 75 Years and over | 0 (0.0%) | 0 (0.0%) |
| Total | 221 (76.5%) | 63 (28.5%) |
Employment Status by Educational Attainment in Navajo Dam
According to labor force statistics for Navajo Dam, 88.3% of individuals (204) out of the total population between 25 and 64 years of age (231) are in the labor force, with 30.9% or 63 of them being unemployed. The group with the highest labor force participation rate are those with the educational attainment of high school diploma, with 100.0% or 79 individuals in the labor force. Within the labor force, individuals with high school diploma education have the highest percentage of unemployment, with 79.7% or 63 of them being unemployed.
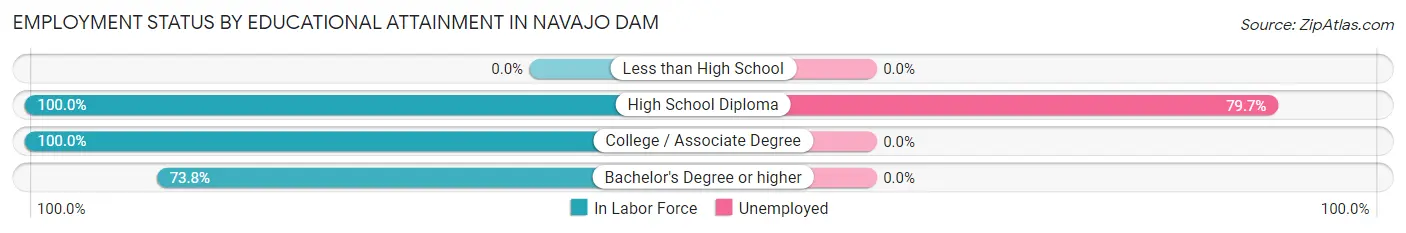
| Educational Attainment | In Labor Force | Unemployed |
| Less than High School | 0 (0.0%) | 0 (0.0%) |
| High School Diploma | 79 (100.0%) | 63 (79.7%) |
| College / Associate Degree | 77 (100.0%) | 0 (0.0%) |
| Bachelor's Degree or higher | 48 (73.8%) | 0 (0.0%) |
| Total | 204 (88.3%) | 71 (30.9%) |
Employment Occupations by Sex in Navajo Dam
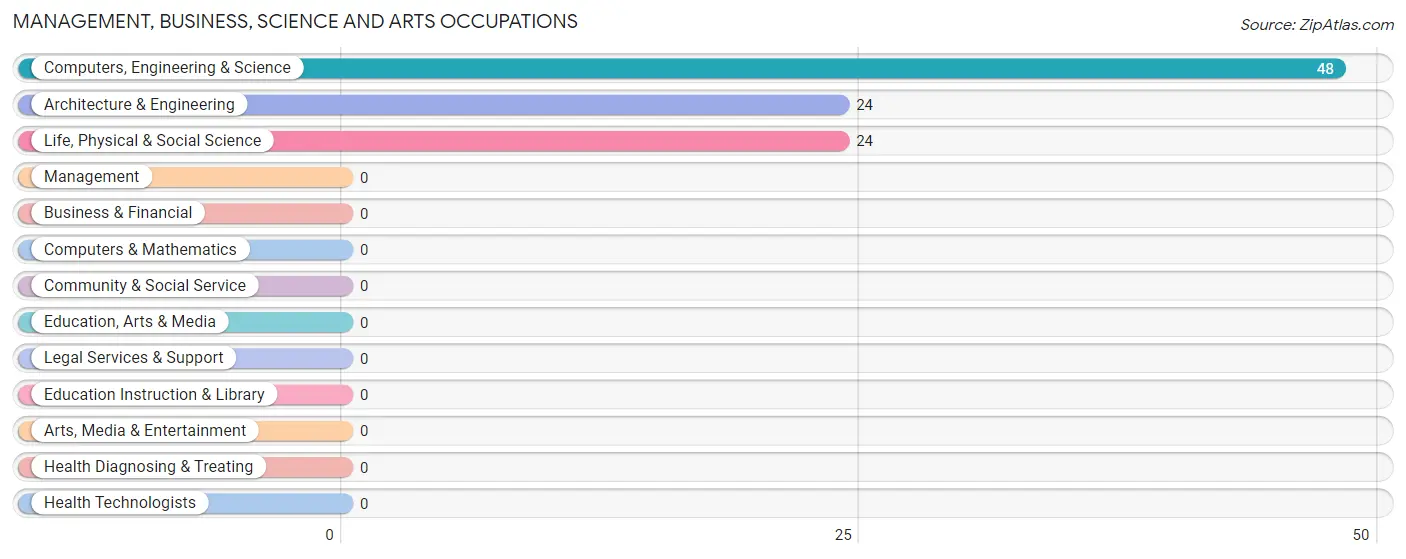
Management, Business, Science and Arts Occupations
The most common Management, Business, Science and Arts occupations in Navajo Dam are Computers, Engineering & Science (48 | 30.4%), Architecture & Engineering (24 | 15.2%), and Life, Physical & Social Science (24 | 15.2%).
Management, Business, Science and Arts Occupations by Sex
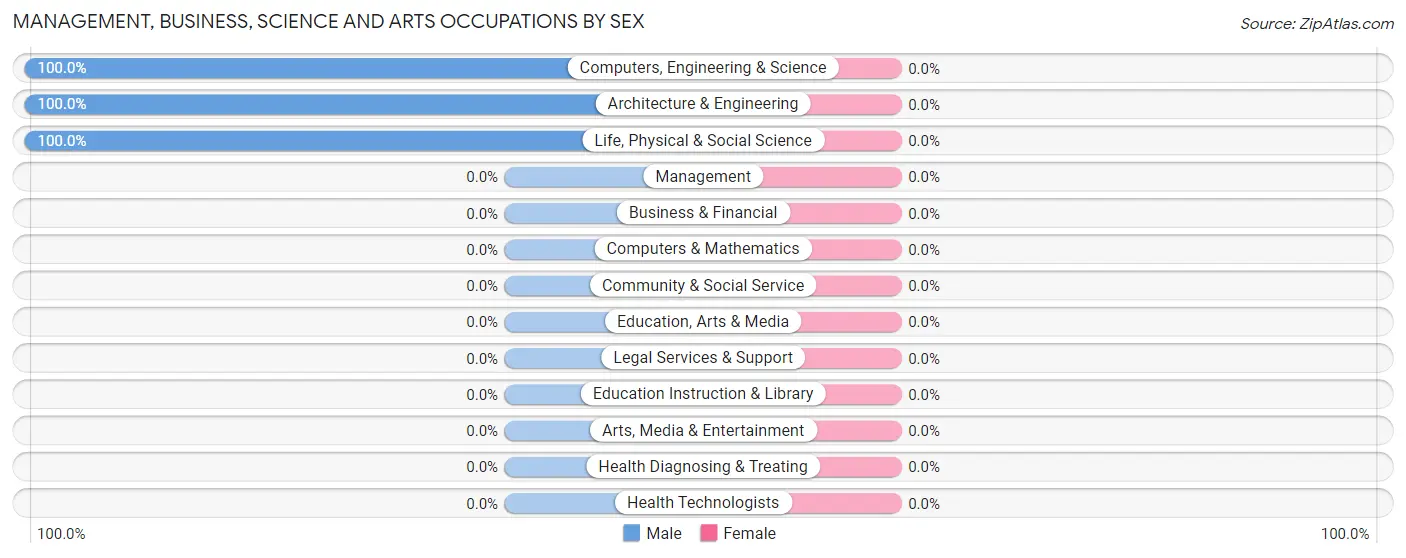
| Occupation | Male | Female |
| Management | 0 (0.0%) | 0 (0.0%) |
| Business & Financial | 0 (0.0%) | 0 (0.0%) |
| Computers, Engineering & Science | 48 (100.0%) | 0 (0.0%) |
| Computers & Mathematics | 0 (0.0%) | 0 (0.0%) |
| Architecture & Engineering | 24 (100.0%) | 0 (0.0%) |
| Life, Physical & Social Science | 24 (100.0%) | 0 (0.0%) |
| Community & Social Service | 0 (0.0%) | 0 (0.0%) |
| Education, Arts & Media | 0 (0.0%) | 0 (0.0%) |
| Legal Services & Support | 0 (0.0%) | 0 (0.0%) |
| Education Instruction & Library | 0 (0.0%) | 0 (0.0%) |
| Arts, Media & Entertainment | 0 (0.0%) | 0 (0.0%) |
| Health Diagnosing & Treating | 0 (0.0%) | 0 (0.0%) |
| Health Technologists | 0 (0.0%) | 0 (0.0%) |
| Total (Category) | 48 (100.0%) | 0 (0.0%) |
| Total (Overall) | 101 (63.9%) | 57 (36.1%) |
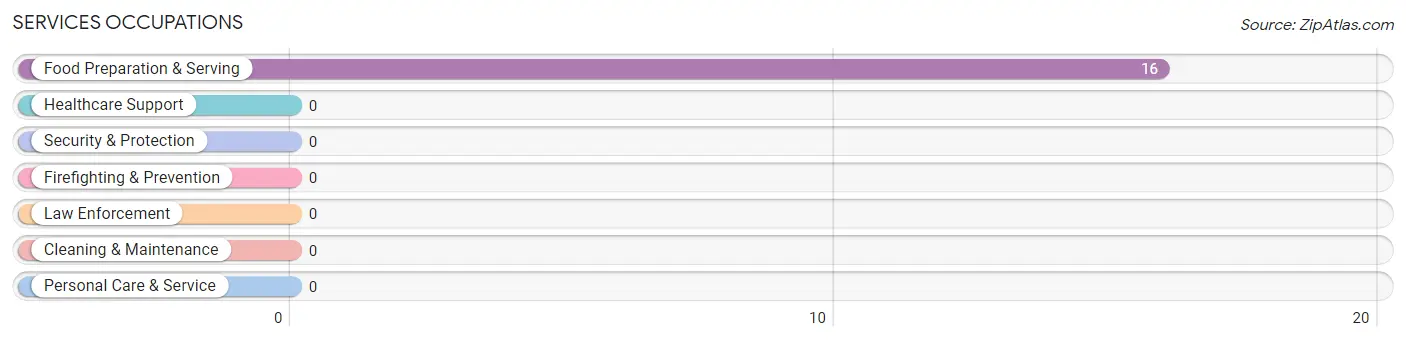
Services Occupations
The most common Services occupations in Navajo Dam are , and Food Preparation & Serving (16 | 10.1%).
Services Occupations by Sex
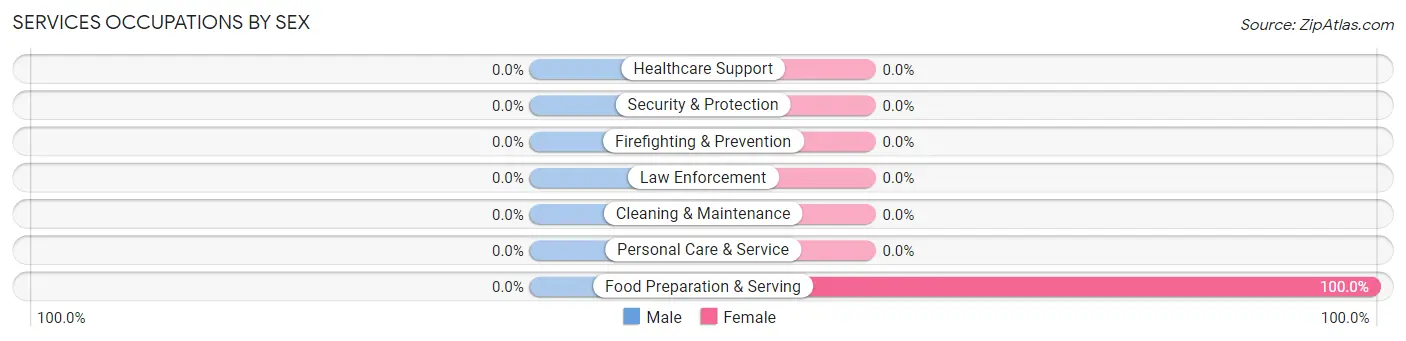
| Occupation | Male | Female |
| Healthcare Support | 0 (0.0%) | 0 (0.0%) |
| Security & Protection | 0 (0.0%) | 0 (0.0%) |
| Firefighting & Prevention | 0 (0.0%) | 0 (0.0%) |
| Law Enforcement | 0 (0.0%) | 0 (0.0%) |
| Food Preparation & Serving | 0 (0.0%) | 16 (100.0%) |
| Cleaning & Maintenance | 0 (0.0%) | 0 (0.0%) |
| Personal Care & Service | 0 (0.0%) | 0 (0.0%) |
| Total (Category) | 0 (0.0%) | 16 (100.0%) |
| Total (Overall) | 101 (63.9%) | 57 (36.1%) |
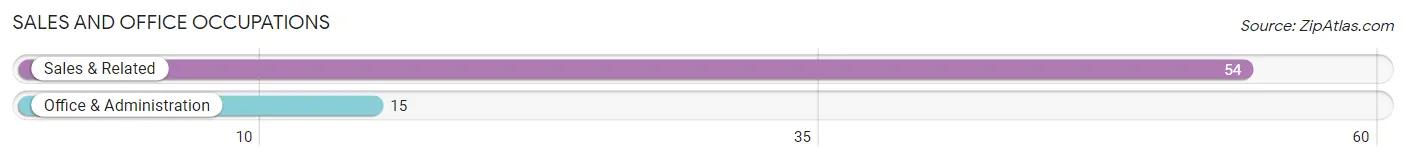
Sales and Office Occupations
The most common Sales and Office occupations in Navajo Dam are Sales & Related (54 | 34.2%), and Office & Administration (15 | 9.5%).
Sales and Office Occupations by Sex
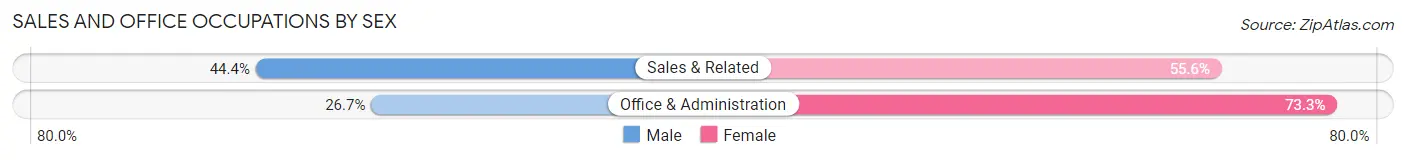
| Occupation | Male | Female |
| Sales & Related | 24 (44.4%) | 30 (55.6%) |
| Office & Administration | 4 (26.7%) | 11 (73.3%) |
| Total (Category) | 28 (40.6%) | 41 (59.4%) |
| Total (Overall) | 101 (63.9%) | 57 (36.1%) |
Natural Resources, Construction and Maintenance Occupations
Natural Resources, Construction and Maintenance Occupations by Sex
| Occupation | Male | Female |
| Farming, Fishing & Forestry | 0 (0.0%) | 0 (0.0%) |
| Construction & Extraction | 0 (0.0%) | 0 (0.0%) |
| Installation, Maintenance & Repair | 0 (0.0%) | 0 (0.0%) |
| Total (Category) | 0 (0.0%) | 0 (0.0%) |
| Total (Overall) | 101 (63.9%) | 57 (36.1%) |
Production, Transportation and Moving Occupations
The most common Production, Transportation and Moving occupations in Navajo Dam are , and Transportation (25 | 15.8%).
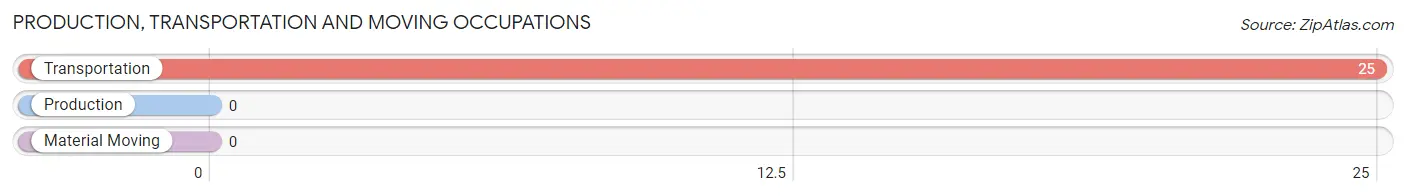
Production, Transportation and Moving Occupations by Sex
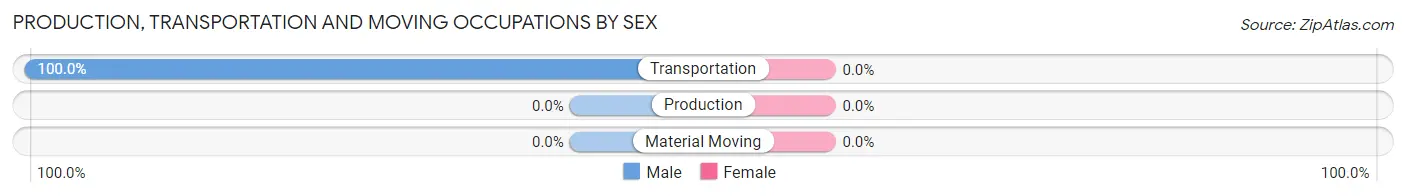
| Occupation | Male | Female |
| Production | 0 (0.0%) | 0 (0.0%) |
| Transportation | 25 (100.0%) | 0 (0.0%) |
| Material Moving | 0 (0.0%) | 0 (0.0%) |
| Total (Category) | 25 (100.0%) | 0 (0.0%) |
| Total (Overall) | 101 (63.9%) | 57 (36.1%) |
Employment Industries by Sex in Navajo Dam
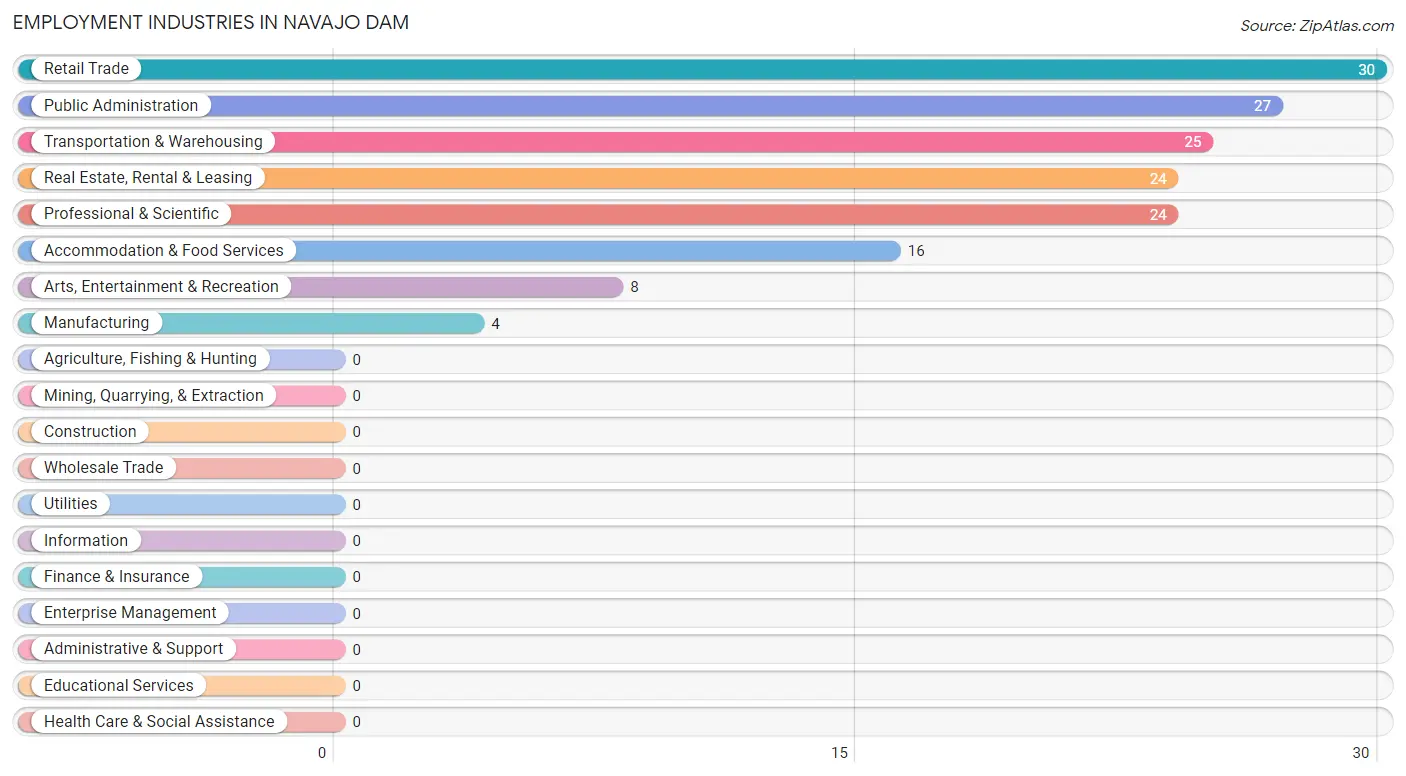
Employment Industries in Navajo Dam
The major employment industries in Navajo Dam include Retail Trade (30 | 19.0%), Public Administration (27 | 17.1%), Transportation & Warehousing (25 | 15.8%), Real Estate, Rental & Leasing (24 | 15.2%), and Professional & Scientific (24 | 15.2%).
Employment Industries by Sex in Navajo Dam
The Navajo Dam industries that see more men than women are Manufacturing (100.0%), Transportation & Warehousing (100.0%), and Real Estate, Rental & Leasing (100.0%), whereas the industries that tend to have a higher number of women are Retail Trade (100.0%), Arts, Entertainment & Recreation (100.0%), and Accommodation & Food Services (100.0%).
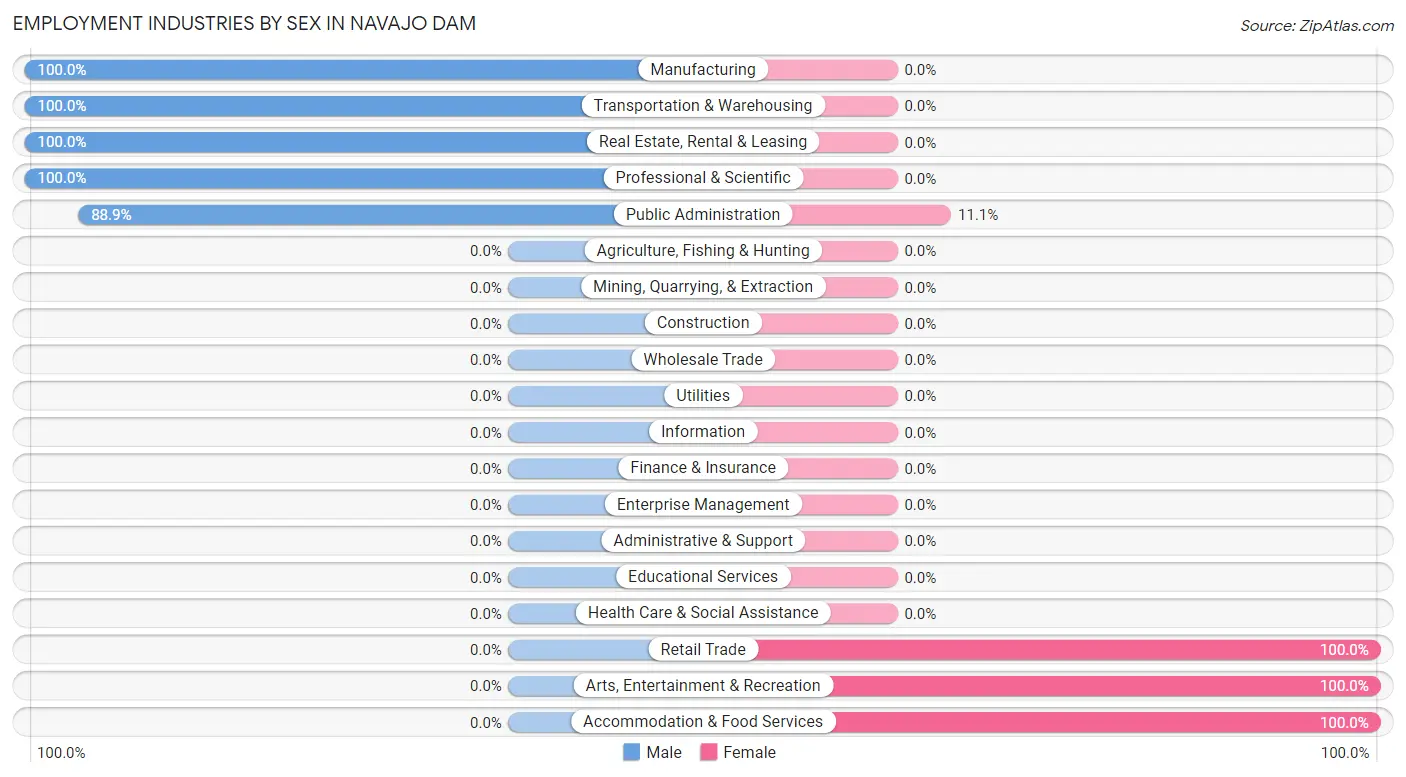
| Industry | Male | Female |
| Agriculture, Fishing & Hunting | 0 (0.0%) | 0 (0.0%) |
| Mining, Quarrying, & Extraction | 0 (0.0%) | 0 (0.0%) |
| Construction | 0 (0.0%) | 0 (0.0%) |
| Manufacturing | 4 (100.0%) | 0 (0.0%) |
| Wholesale Trade | 0 (0.0%) | 0 (0.0%) |
| Retail Trade | 0 (0.0%) | 30 (100.0%) |
| Transportation & Warehousing | 25 (100.0%) | 0 (0.0%) |
| Utilities | 0 (0.0%) | 0 (0.0%) |
| Information | 0 (0.0%) | 0 (0.0%) |
| Finance & Insurance | 0 (0.0%) | 0 (0.0%) |
| Real Estate, Rental & Leasing | 24 (100.0%) | 0 (0.0%) |
| Professional & Scientific | 24 (100.0%) | 0 (0.0%) |
| Enterprise Management | 0 (0.0%) | 0 (0.0%) |
| Administrative & Support | 0 (0.0%) | 0 (0.0%) |
| Educational Services | 0 (0.0%) | 0 (0.0%) |
| Health Care & Social Assistance | 0 (0.0%) | 0 (0.0%) |
| Arts, Entertainment & Recreation | 0 (0.0%) | 8 (100.0%) |
| Accommodation & Food Services | 0 (0.0%) | 16 (100.0%) |
| Public Administration | 24 (88.9%) | 3 (11.1%) |
| Total | 101 (63.9%) | 57 (36.1%) |
Education in Navajo Dam
School Enrollment in Navajo Dam
The most common levels of schooling among the 67 students in Navajo Dam are high school (31 | 46.3%), elementary school (29 | 43.3%), and college / undergraduate (7 | 10.4%).
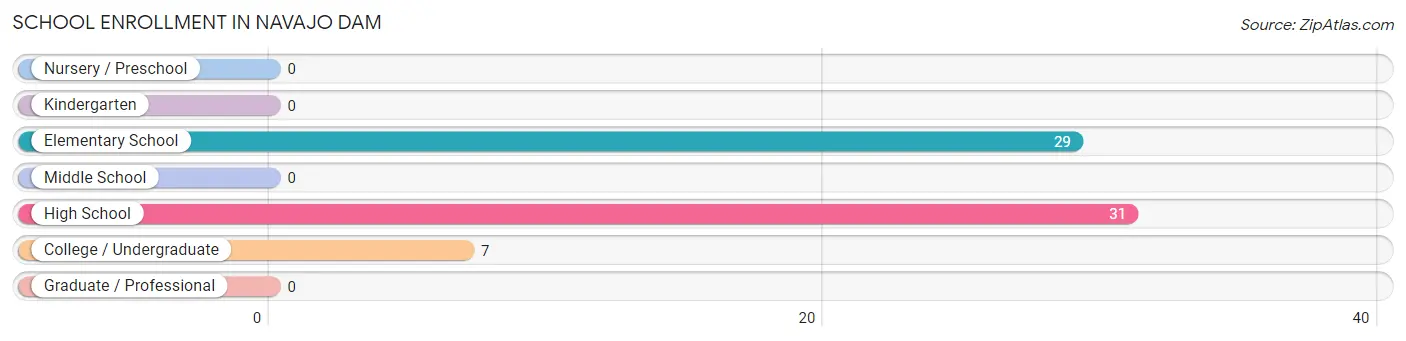
| School Level | # Students | % Students |
| Nursery / Preschool | 0 | 0.0% |
| Kindergarten | 0 | 0.0% |
| Elementary School | 29 | 43.3% |
| Middle School | 0 | 0.0% |
| High School | 31 | 46.3% |
| College / Undergraduate | 7 | 10.4% |
| Graduate / Professional | 0 | 0.0% |
| Total | 67 | 100.0% |
School Enrollment by Age by Funding Source in Navajo Dam
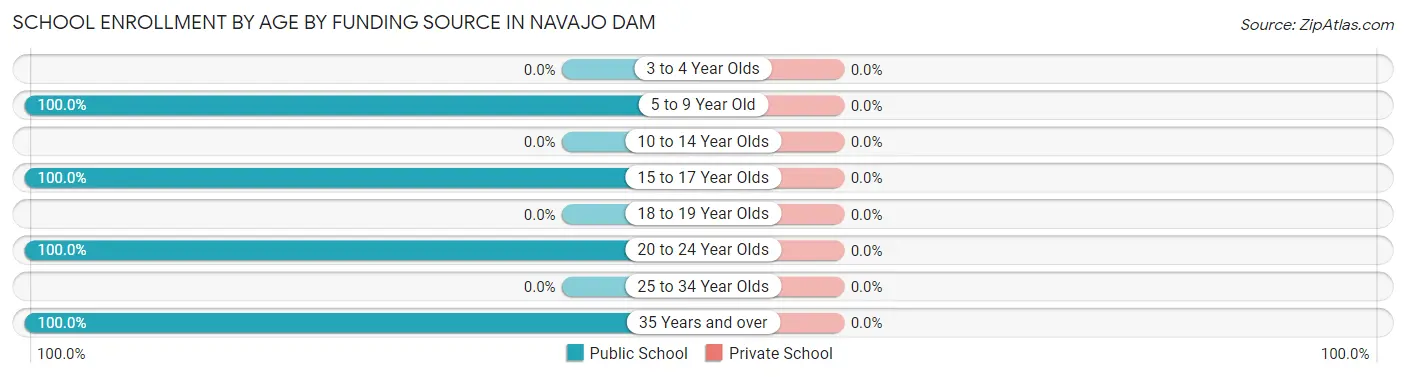
| Age Bracket | Public School | Private School |
| 3 to 4 Year Olds | 0 (0.0%) | 0 (0.0%) |
| 5 to 9 Year Old | 29 (100.0%) | 0 (0.0%) |
| 10 to 14 Year Olds | 0 (0.0%) | 0 (0.0%) |
| 15 to 17 Year Olds | 31 (100.0%) | 0 (0.0%) |
| 18 to 19 Year Olds | 0 (0.0%) | 0 (0.0%) |
| 20 to 24 Year Olds | 4 (100.0%) | 0 (0.0%) |
| 25 to 34 Year Olds | 0 (0.0%) | 0 (0.0%) |
| 35 Years and over | 3 (100.0%) | 0 (0.0%) |
| Total | 67 (100.0%) | 0 (0.0%) |
Educational Attainment by Field of Study in Navajo Dam
Bio, nature & agricultural (24 | 32.0%), liberal arts & history (24 | 32.0%), business (17 | 22.7%), and education (10 | 13.3%) are the most common fields of study among 75 individuals in Navajo Dam who have obtained a bachelor's degree or higher.
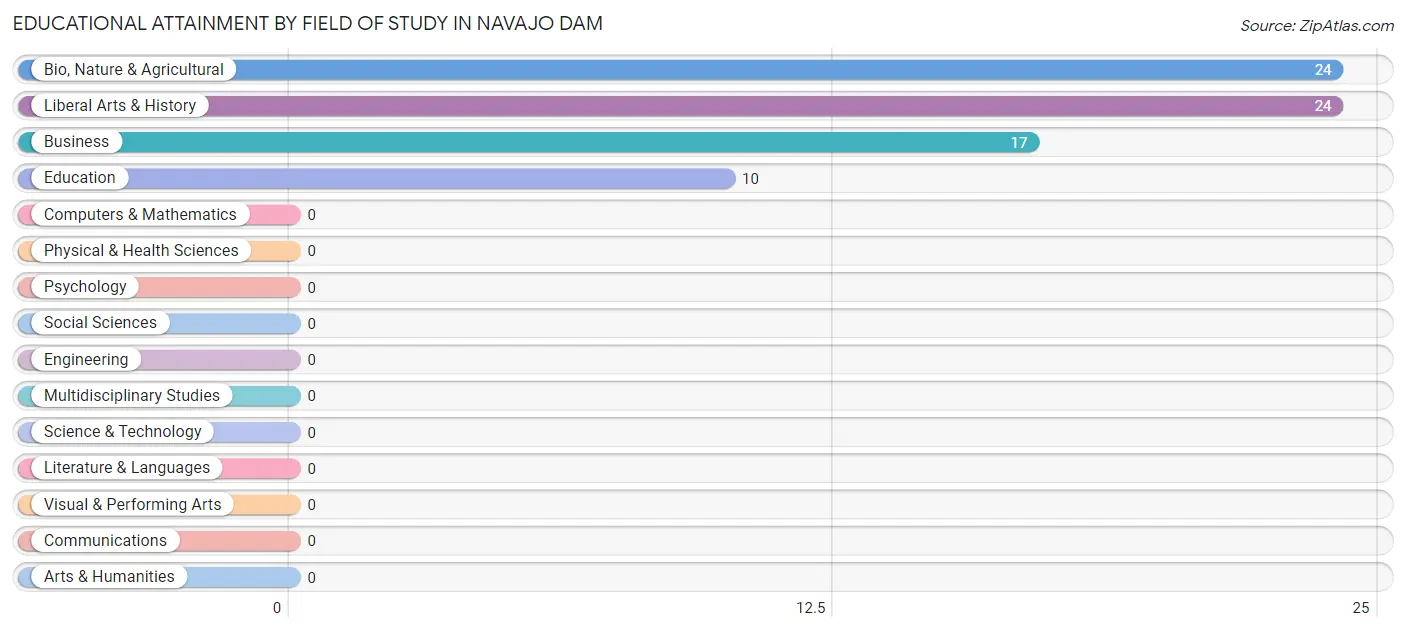
| Field of Study | # Graduates | % Graduates |
| Computers & Mathematics | 0 | 0.0% |
| Bio, Nature & Agricultural | 24 | 32.0% |
| Physical & Health Sciences | 0 | 0.0% |
| Psychology | 0 | 0.0% |
| Social Sciences | 0 | 0.0% |
| Engineering | 0 | 0.0% |
| Multidisciplinary Studies | 0 | 0.0% |
| Science & Technology | 0 | 0.0% |
| Business | 17 | 22.7% |
| Education | 10 | 13.3% |
| Literature & Languages | 0 | 0.0% |
| Liberal Arts & History | 24 | 32.0% |
| Visual & Performing Arts | 0 | 0.0% |
| Communications | 0 | 0.0% |
| Arts & Humanities | 0 | 0.0% |
| Total | 75 | 100.0% |
Transportation & Commute in Navajo Dam
Vehicle Availability by Sex in Navajo Dam
The most prevalent vehicle ownership categories in Navajo Dam are males with 3 vehicles (25, accounting for 25.8%) and females with 3 vehicles (0, making up 43.9%).
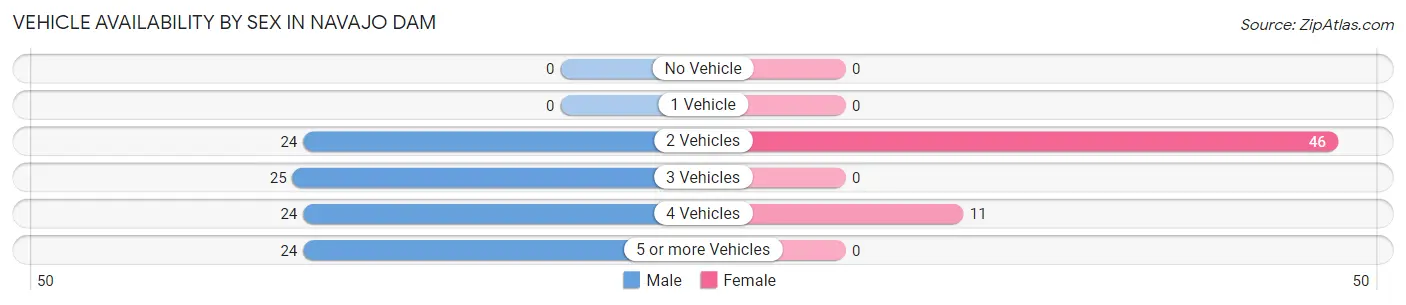
| Vehicles Available | Male | Female |
| No Vehicle | 0 (0.0%) | 0 (0.0%) |
| 1 Vehicle | 0 (0.0%) | 0 (0.0%) |
| 2 Vehicles | 24 (24.7%) | 46 (80.7%) |
| 3 Vehicles | 25 (25.8%) | 0 (0.0%) |
| 4 Vehicles | 24 (24.7%) | 11 (19.3%) |
| 5 or more Vehicles | 24 (24.7%) | 0 (0.0%) |
| Total | 97 (100.0%) | 57 (100.0%) |
Commute Time in Navajo Dam
The most frequently occuring commute durations in Navajo Dam are less than 5 minutes (70 commuters, 45.2%), 15 to 19 minutes (32 commuters, 20.6%), and 20 to 24 minutes (25 commuters, 16.1%).
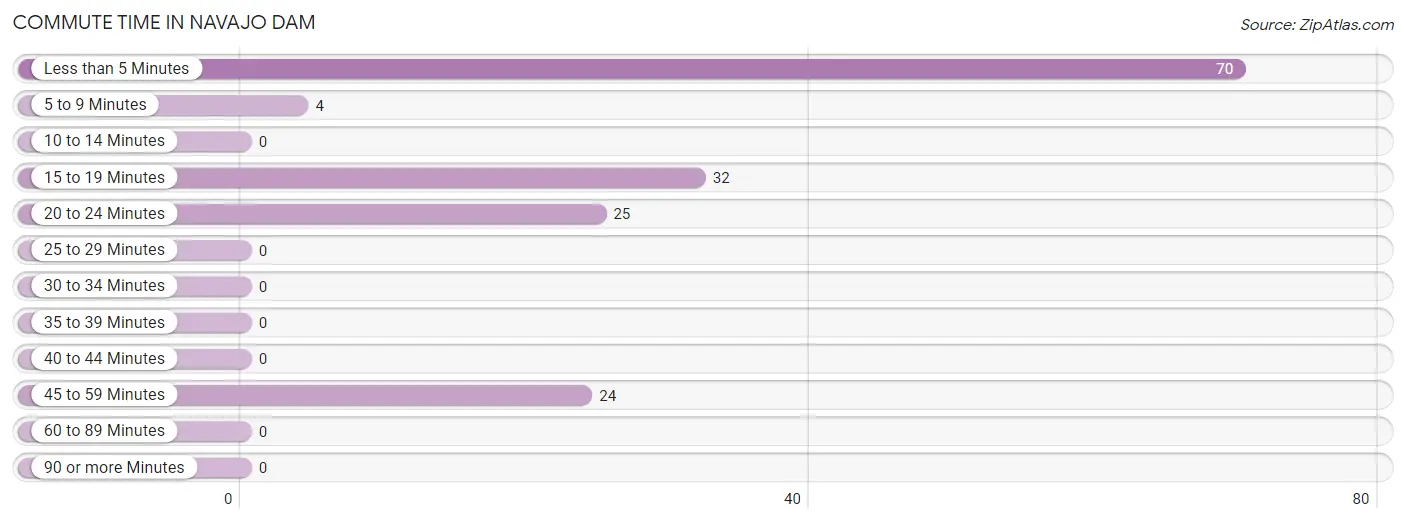
| Commute Time | # Commuters | % Commuters |
| Less than 5 Minutes | 70 | 45.2% |
| 5 to 9 Minutes | 4 | 2.6% |
| 10 to 14 Minutes | 0 | 0.0% |
| 15 to 19 Minutes | 32 | 20.6% |
| 20 to 24 Minutes | 25 | 16.1% |
| 25 to 29 Minutes | 0 | 0.0% |
| 30 to 34 Minutes | 0 | 0.0% |
| 35 to 39 Minutes | 0 | 0.0% |
| 40 to 44 Minutes | 0 | 0.0% |
| 45 to 59 Minutes | 24 | 15.5% |
| 60 to 89 Minutes | 0 | 0.0% |
| 90 or more Minutes | 0 | 0.0% |
Commute Time by Sex in Navajo Dam
The most common commute times in Navajo Dam are 20 to 24 minutes (25 commuters, 24.7%) for males and less than 5 minutes (46 commuters, 85.2%) for females.
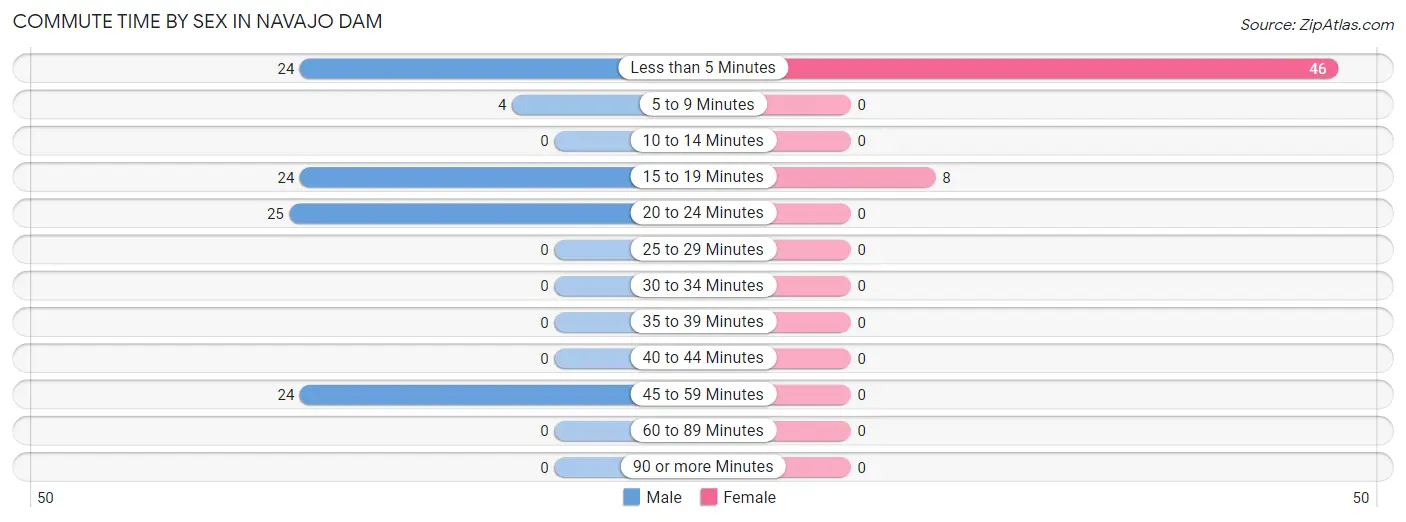
| Commute Time | Male | Female |
| Less than 5 Minutes | 24 (23.8%) | 46 (85.2%) |
| 5 to 9 Minutes | 4 (4.0%) | 0 (0.0%) |
| 10 to 14 Minutes | 0 (0.0%) | 0 (0.0%) |
| 15 to 19 Minutes | 24 (23.8%) | 8 (14.8%) |
| 20 to 24 Minutes | 25 (24.7%) | 0 (0.0%) |
| 25 to 29 Minutes | 0 (0.0%) | 0 (0.0%) |
| 30 to 34 Minutes | 0 (0.0%) | 0 (0.0%) |
| 35 to 39 Minutes | 0 (0.0%) | 0 (0.0%) |
| 40 to 44 Minutes | 0 (0.0%) | 0 (0.0%) |
| 45 to 59 Minutes | 24 (23.8%) | 0 (0.0%) |
| 60 to 89 Minutes | 0 (0.0%) | 0 (0.0%) |
| 90 or more Minutes | 0 (0.0%) | 0 (0.0%) |
Time of Departure to Work by Sex in Navajo Dam
The most frequent times of departure to work in Navajo Dam are 7:30 AM to 7:59 AM (28, 27.7%) for males and 5:30 AM to 5:59 AM (30, 55.6%) for females.
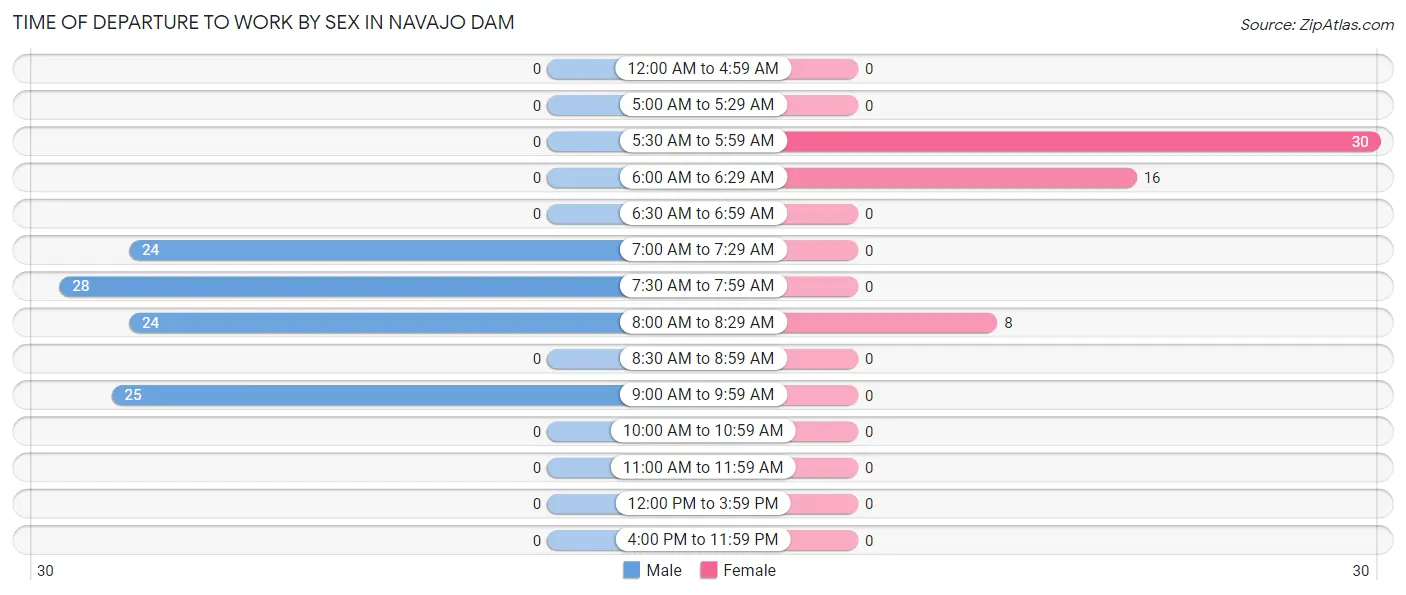
| Time of Departure | Male | Female |
| 12:00 AM to 4:59 AM | 0 (0.0%) | 0 (0.0%) |
| 5:00 AM to 5:29 AM | 0 (0.0%) | 0 (0.0%) |
| 5:30 AM to 5:59 AM | 0 (0.0%) | 30 (55.6%) |
| 6:00 AM to 6:29 AM | 0 (0.0%) | 16 (29.6%) |
| 6:30 AM to 6:59 AM | 0 (0.0%) | 0 (0.0%) |
| 7:00 AM to 7:29 AM | 24 (23.8%) | 0 (0.0%) |
| 7:30 AM to 7:59 AM | 28 (27.7%) | 0 (0.0%) |
| 8:00 AM to 8:29 AM | 24 (23.8%) | 8 (14.8%) |
| 8:30 AM to 8:59 AM | 0 (0.0%) | 0 (0.0%) |
| 9:00 AM to 9:59 AM | 25 (24.7%) | 0 (0.0%) |
| 10:00 AM to 10:59 AM | 0 (0.0%) | 0 (0.0%) |
| 11:00 AM to 11:59 AM | 0 (0.0%) | 0 (0.0%) |
| 12:00 PM to 3:59 PM | 0 (0.0%) | 0 (0.0%) |
| 4:00 PM to 11:59 PM | 0 (0.0%) | 0 (0.0%) |
| Total | 101 (100.0%) | 54 (100.0%) |
Housing Occupancy in Navajo Dam
Occupancy by Ownership in Navajo Dam
Of the total 89 dwellings in Navajo Dam, owner-occupied units account for 38 (42.7%), while renter-occupied units make up 51 (57.3%).
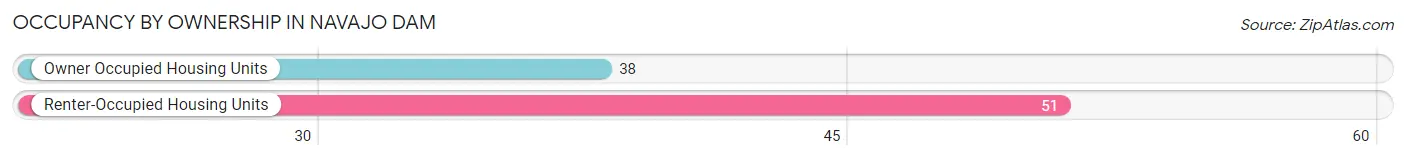
| Occupancy | # Housing Units | % Housing Units |
| Owner Occupied Housing Units | 38 | 42.7% |
| Renter-Occupied Housing Units | 51 | 57.3% |
| Total Occupied Housing Units | 89 | 100.0% |
Occupancy by Household Size in Navajo Dam
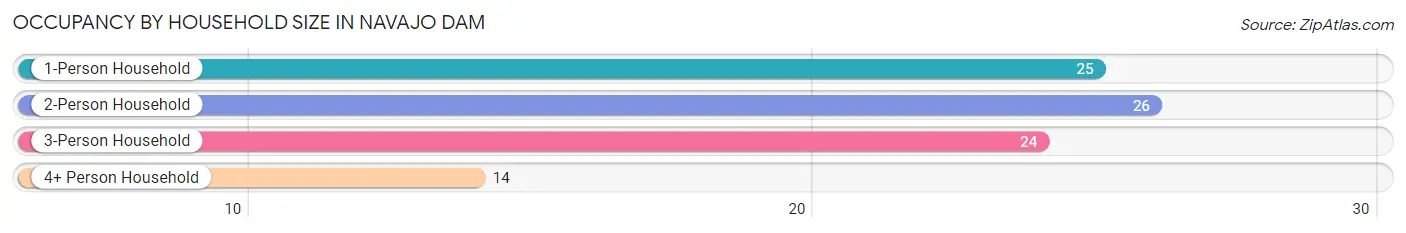
| Household Size | # Housing Units | % Housing Units |
| 1-Person Household | 25 | 28.1% |
| 2-Person Household | 26 | 29.2% |
| 3-Person Household | 24 | 27.0% |
| 4+ Person Household | 14 | 15.7% |
| Total Housing Units | 89 | 100.0% |
Occupancy by Ownership by Household Size in Navajo Dam
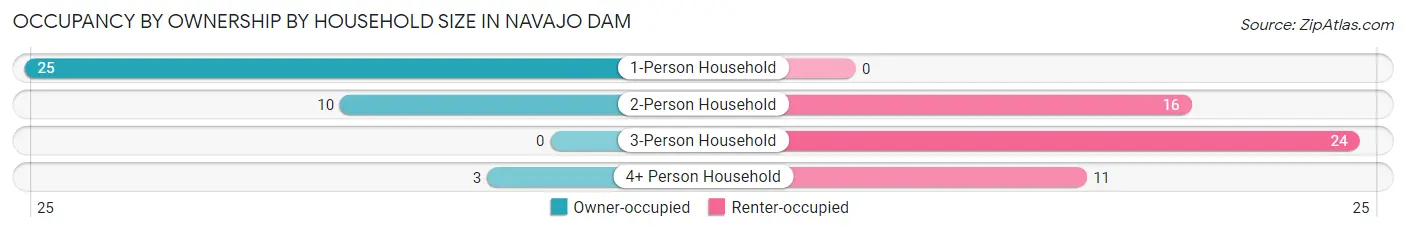
| Household Size | Owner-occupied | Renter-occupied |
| 1-Person Household | 25 (100.0%) | 0 (0.0%) |
| 2-Person Household | 10 (38.5%) | 16 (61.5%) |
| 3-Person Household | 0 (0.0%) | 24 (100.0%) |
| 4+ Person Household | 3 (21.4%) | 11 (78.6%) |
| Total Housing Units | 38 (42.7%) | 51 (57.3%) |
Occupancy by Educational Attainment in Navajo Dam
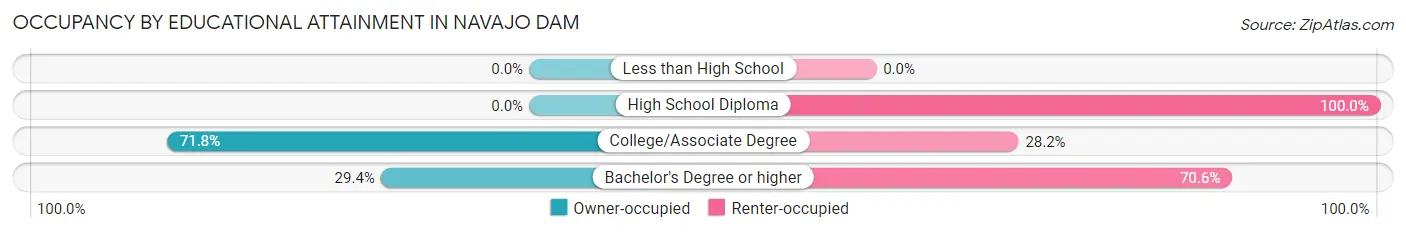
| Household Size | Owner-occupied | Renter-occupied |
| Less than High School | 0 (0.0%) | 0 (0.0%) |
| High School Diploma | 0 (0.0%) | 16 (100.0%) |
| College/Associate Degree | 28 (71.8%) | 11 (28.2%) |
| Bachelor's Degree or higher | 10 (29.4%) | 24 (70.6%) |
Occupancy by Age of Householder in Navajo Dam
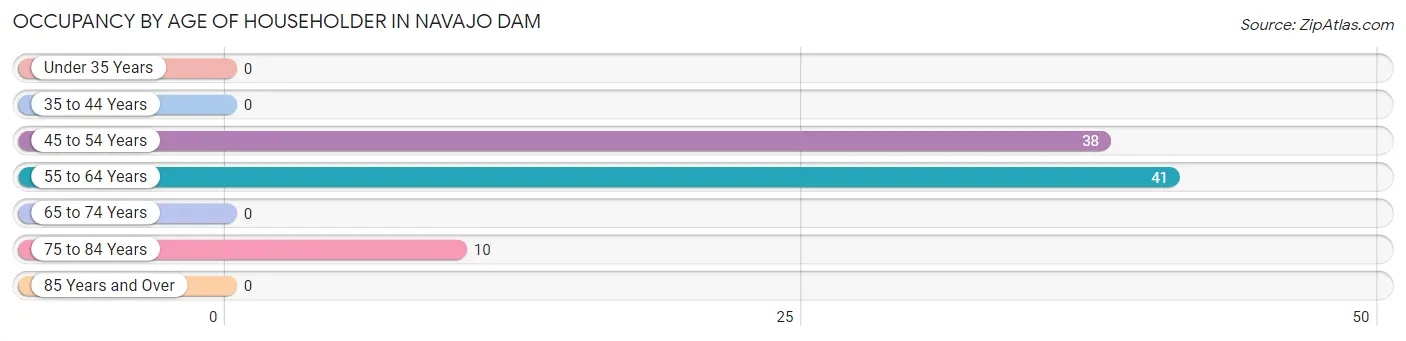
| Age Bracket | # Households | % Households |
| Under 35 Years | 0 | 0.0% |
| 35 to 44 Years | 0 | 0.0% |
| 45 to 54 Years | 38 | 42.7% |
| 55 to 64 Years | 41 | 46.1% |
| 65 to 74 Years | 0 | 0.0% |
| 75 to 84 Years | 10 | 11.2% |
| 85 Years and Over | 0 | 0.0% |
| Total | 89 | 100.0% |
Housing Finances in Navajo Dam
Median Income by Occupancy in Navajo Dam
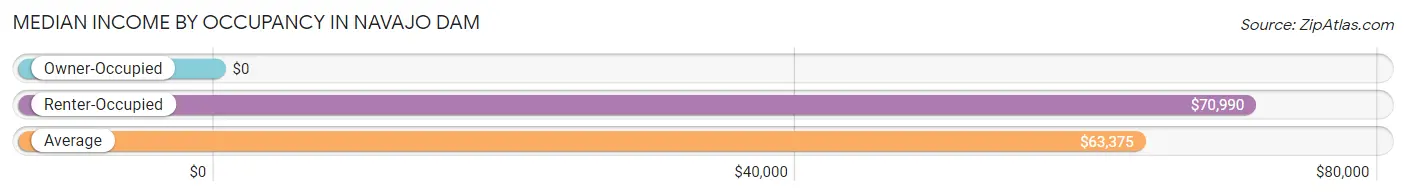
| Occupancy Type | # Households | Median Income |
| Owner-Occupied | 38 (42.7%) | $0 |
| Renter-Occupied | 51 (57.3%) | $70,990 |
| Average | 89 (100.0%) | $63,375 |
Occupancy by Householder Income Bracket in Navajo Dam
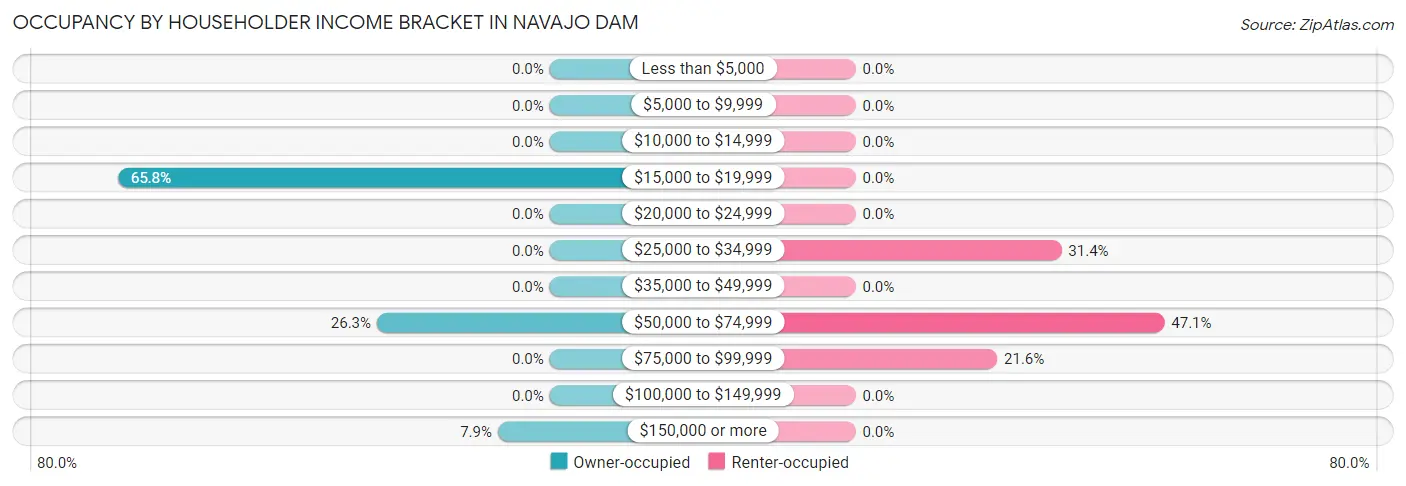
| Income Bracket | Owner-occupied | Renter-occupied |
| Less than $5,000 | 0 (0.0%) | 0 (0.0%) |
| $5,000 to $9,999 | 0 (0.0%) | 0 (0.0%) |
| $10,000 to $14,999 | 0 (0.0%) | 0 (0.0%) |
| $15,000 to $19,999 | 25 (65.8%) | 0 (0.0%) |
| $20,000 to $24,999 | 0 (0.0%) | 0 (0.0%) |
| $25,000 to $34,999 | 0 (0.0%) | 16 (31.4%) |
| $35,000 to $49,999 | 0 (0.0%) | 0 (0.0%) |
| $50,000 to $74,999 | 10 (26.3%) | 24 (47.1%) |
| $75,000 to $99,999 | 0 (0.0%) | 11 (21.6%) |
| $100,000 to $149,999 | 0 (0.0%) | 0 (0.0%) |
| $150,000 or more | 3 (7.9%) | 0 (0.0%) |
| Total | 38 (100.0%) | 51 (100.0%) |
Monthly Housing Cost Tiers in Navajo Dam
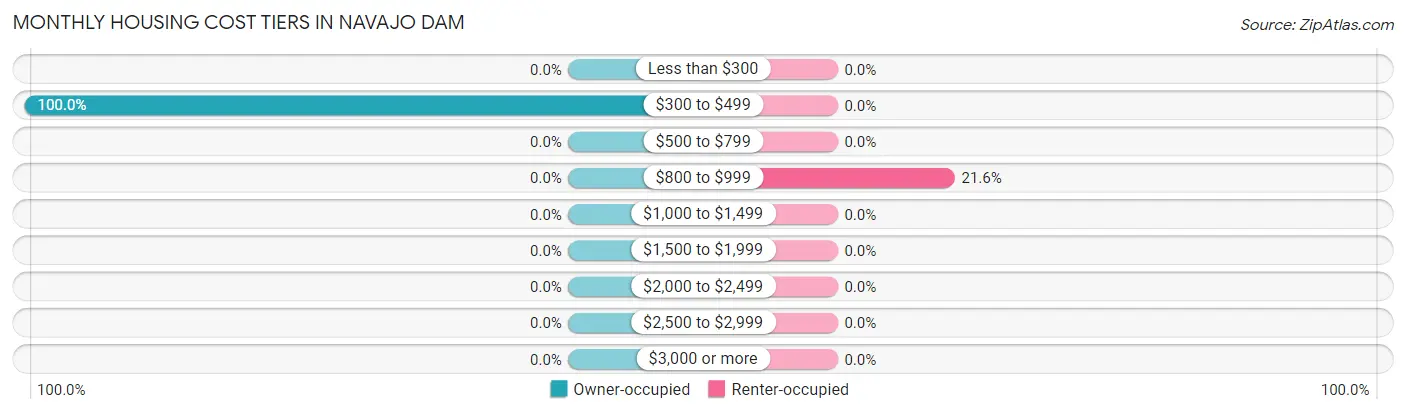
| Monthly Cost | Owner-occupied | Renter-occupied |
| Less than $300 | 0 (0.0%) | 0 (0.0%) |
| $300 to $499 | 38 (100.0%) | 0 (0.0%) |
| $500 to $799 | 0 (0.0%) | 0 (0.0%) |
| $800 to $999 | 0 (0.0%) | 11 (21.6%) |
| $1,000 to $1,499 | 0 (0.0%) | 0 (0.0%) |
| $1,500 to $1,999 | 0 (0.0%) | 0 (0.0%) |
| $2,000 to $2,499 | 0 (0.0%) | 0 (0.0%) |
| $2,500 to $2,999 | 0 (0.0%) | 0 (0.0%) |
| $3,000 or more | 0 (0.0%) | 0 (0.0%) |
| Total | 38 (100.0%) | 51 (100.0%) |
Physical Housing Characteristics in Navajo Dam
Housing Structures in Navajo Dam
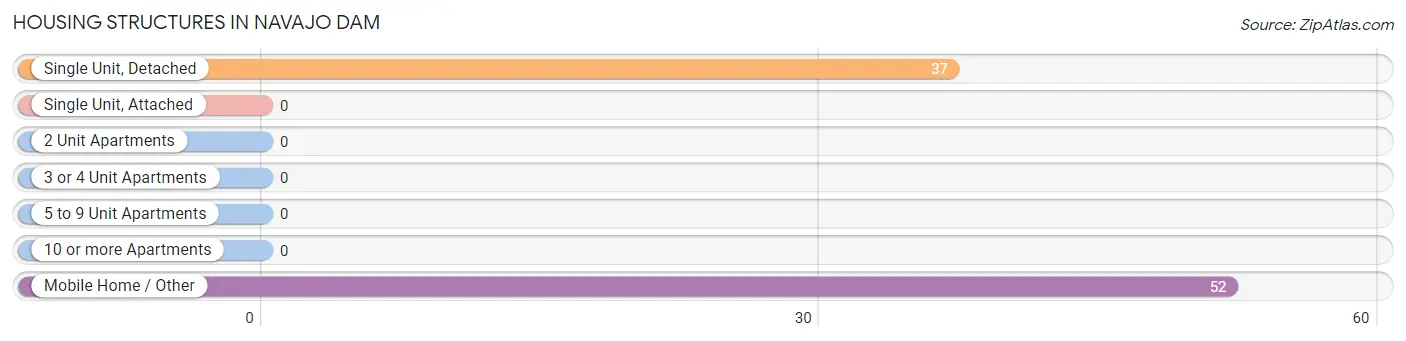
| Structure Type | # Housing Units | % Housing Units |
| Single Unit, Detached | 37 | 41.6% |
| Single Unit, Attached | 0 | 0.0% |
| 2 Unit Apartments | 0 | 0.0% |
| 3 or 4 Unit Apartments | 0 | 0.0% |
| 5 to 9 Unit Apartments | 0 | 0.0% |
| 10 or more Apartments | 0 | 0.0% |
| Mobile Home / Other | 52 | 58.4% |
| Total | 89 | 100.0% |
Housing Structures by Occupancy in Navajo Dam
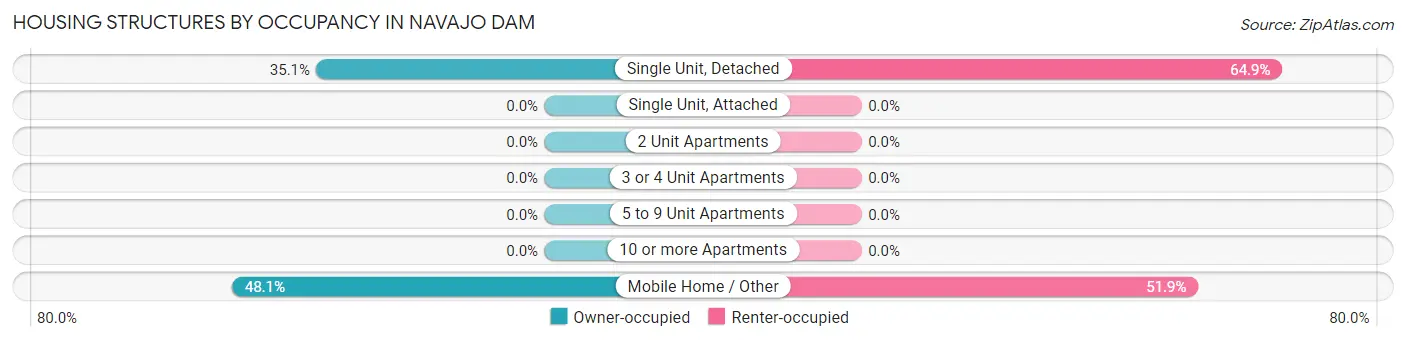
| Structure Type | Owner-occupied | Renter-occupied |
| Single Unit, Detached | 13 (35.1%) | 24 (64.9%) |
| Single Unit, Attached | 0 (0.0%) | 0 (0.0%) |
| 2 Unit Apartments | 0 (0.0%) | 0 (0.0%) |
| 3 or 4 Unit Apartments | 0 (0.0%) | 0 (0.0%) |
| 5 to 9 Unit Apartments | 0 (0.0%) | 0 (0.0%) |
| 10 or more Apartments | 0 (0.0%) | 0 (0.0%) |
| Mobile Home / Other | 25 (48.1%) | 27 (51.9%) |
| Total | 38 (42.7%) | 51 (57.3%) |
Housing Structures by Number of Rooms in Navajo Dam
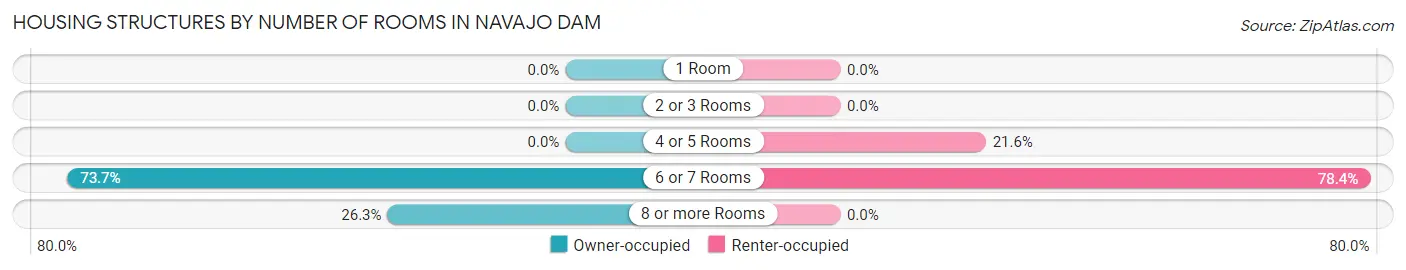
| Number of Rooms | Owner-occupied | Renter-occupied |
| 1 Room | 0 (0.0%) | 0 (0.0%) |
| 2 or 3 Rooms | 0 (0.0%) | 0 (0.0%) |
| 4 or 5 Rooms | 0 (0.0%) | 11 (21.6%) |
| 6 or 7 Rooms | 28 (73.7%) | 40 (78.4%) |
| 8 or more Rooms | 10 (26.3%) | 0 (0.0%) |
| Total | 38 (100.0%) | 51 (100.0%) |
Housing Structure by Heating Type in Navajo Dam
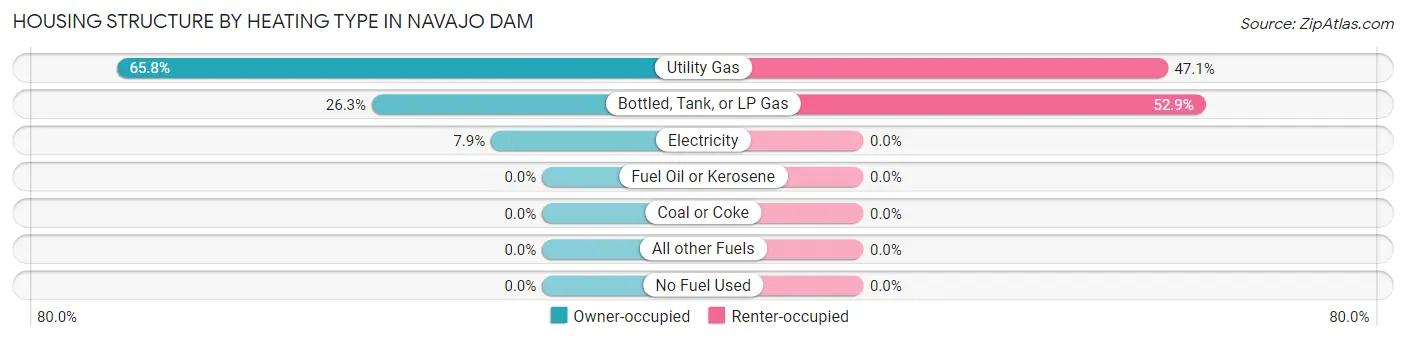
| Heating Type | Owner-occupied | Renter-occupied |
| Utility Gas | 25 (65.8%) | 24 (47.1%) |
| Bottled, Tank, or LP Gas | 10 (26.3%) | 27 (52.9%) |
| Electricity | 3 (7.9%) | 0 (0.0%) |
| Fuel Oil or Kerosene | 0 (0.0%) | 0 (0.0%) |
| Coal or Coke | 0 (0.0%) | 0 (0.0%) |
| All other Fuels | 0 (0.0%) | 0 (0.0%) |
| No Fuel Used | 0 (0.0%) | 0 (0.0%) |
| Total | 38 (100.0%) | 51 (100.0%) |
Household Vehicle Usage in Navajo Dam
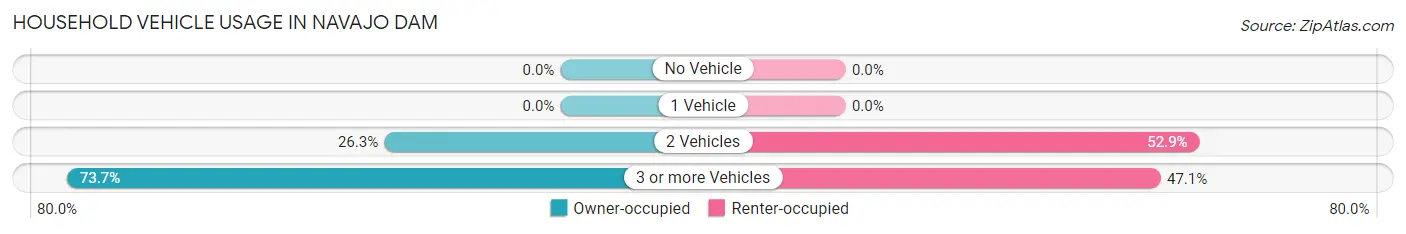
| Vehicles per Household | Owner-occupied | Renter-occupied |
| No Vehicle | 0 (0.0%) | 0 (0.0%) |
| 1 Vehicle | 0 (0.0%) | 0 (0.0%) |
| 2 Vehicles | 10 (26.3%) | 27 (52.9%) |
| 3 or more Vehicles | 28 (73.7%) | 24 (47.1%) |
| Total | 38 (100.0%) | 51 (100.0%) |
Real Estate & Mortgages in Navajo Dam
Real Estate and Mortgage Overview in Navajo Dam
| Characteristic | Without Mortgage | With Mortgage |
| Housing Units | 38 | 0 |
| Median Property Value | - | - |
| Median Household Income | - | - |
| Monthly Housing Costs | $424 | $0 |
| Real Estate Taxes | $1,120 | $0 |
Property Value by Mortgage Status in Navajo Dam
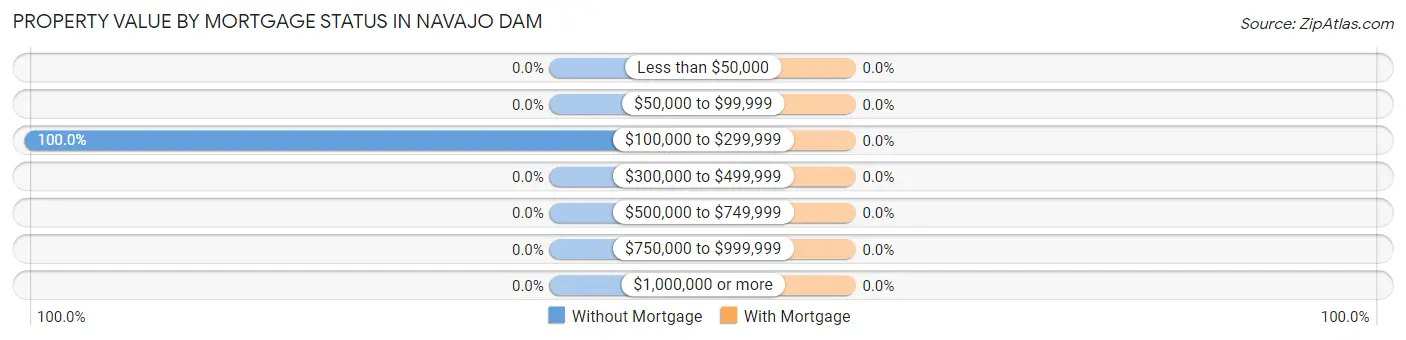
| Property Value | Without Mortgage | With Mortgage |
| Less than $50,000 | 0 (0.0%) | 0 (0.0%) |
| $50,000 to $99,999 | 0 (0.0%) | 0 (0.0%) |
| $100,000 to $299,999 | 38 (100.0%) | 0 (0.0%) |
| $300,000 to $499,999 | 0 (0.0%) | 0 (0.0%) |
| $500,000 to $749,999 | 0 (0.0%) | 0 (0.0%) |
| $750,000 to $999,999 | 0 (0.0%) | 0 (0.0%) |
| $1,000,000 or more | 0 (0.0%) | 0 (0.0%) |
| Total | 38 (100.0%) | 0 (0.0%) |
Household Income by Mortgage Status in Navajo Dam
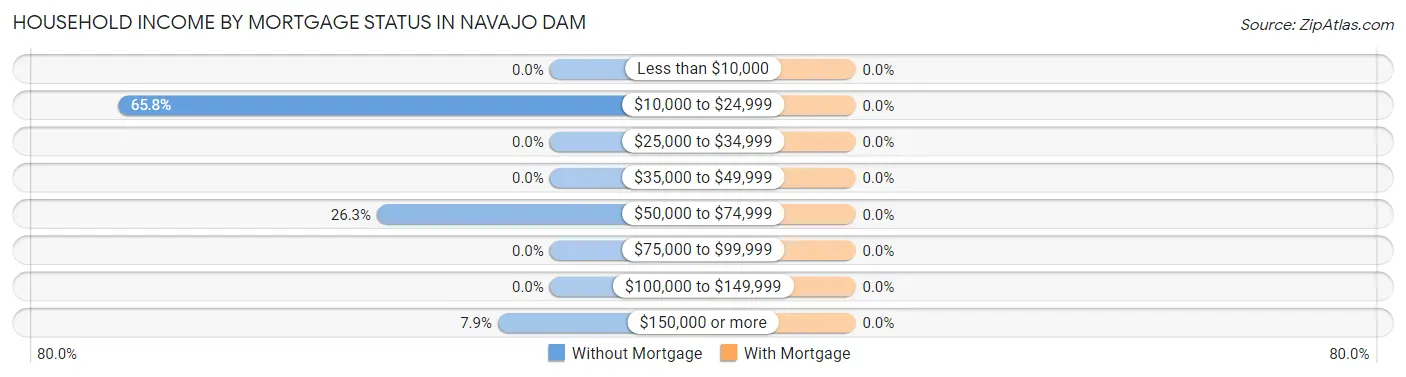
| Household Income | Without Mortgage | With Mortgage |
| Less than $10,000 | 0 (0.0%) | 0 (0.0%) |
| $10,000 to $24,999 | 25 (65.8%) | 0 (0.0%) |
| $25,000 to $34,999 | 0 (0.0%) | 0 (0.0%) |
| $35,000 to $49,999 | 0 (0.0%) | 0 (0.0%) |
| $50,000 to $74,999 | 10 (26.3%) | 0 (0.0%) |
| $75,000 to $99,999 | 0 (0.0%) | 0 (0.0%) |
| $100,000 to $149,999 | 0 (0.0%) | 0 (0.0%) |
| $150,000 or more | 3 (7.9%) | 0 (0.0%) |
| Total | 38 (100.0%) | 0 (0.0%) |
Property Value to Household Income Ratio in Navajo Dam
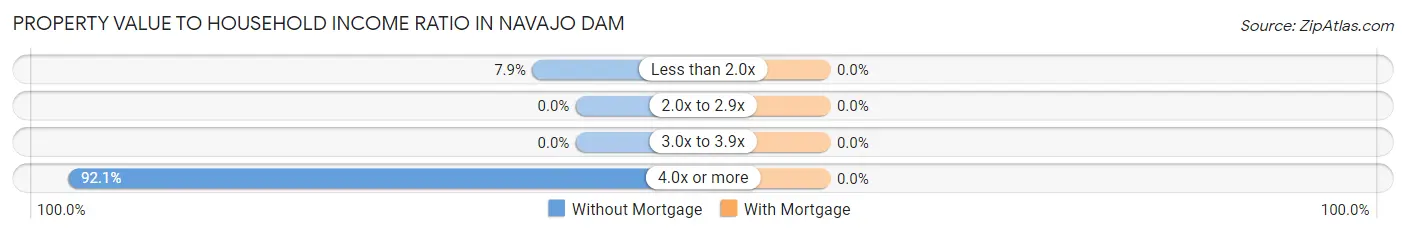
| Value-to-Income Ratio | Without Mortgage | With Mortgage |
| Less than 2.0x | 3 (7.9%) | 0 (0.0%) |
| 2.0x to 2.9x | 0 (0.0%) | 0 (0.0%) |
| 3.0x to 3.9x | 0 (0.0%) | 0 (0.0%) |
| 4.0x or more | 35 (92.1%) | 0 (0.0%) |
| Total | 38 (100.0%) | 0 (0.0%) |
Real Estate Taxes by Mortgage Status in Navajo Dam
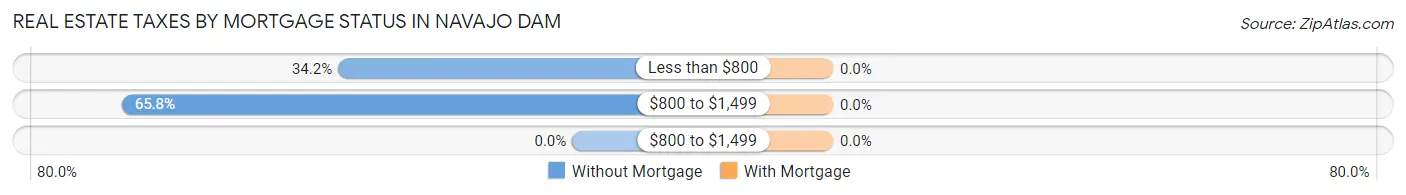
| Property Taxes | Without Mortgage | With Mortgage |
| Less than $800 | 13 (34.2%) | 0 (0.0%) |
| $800 to $1,499 | 25 (65.8%) | 0 (0.0%) |
| $800 to $1,499 | 0 (0.0%) | 0 (0.0%) |
| Total | 38 (100.0%) | 0 (0.0%) |
Health & Disability in Navajo Dam
Health Insurance Coverage by Age in Navajo Dam
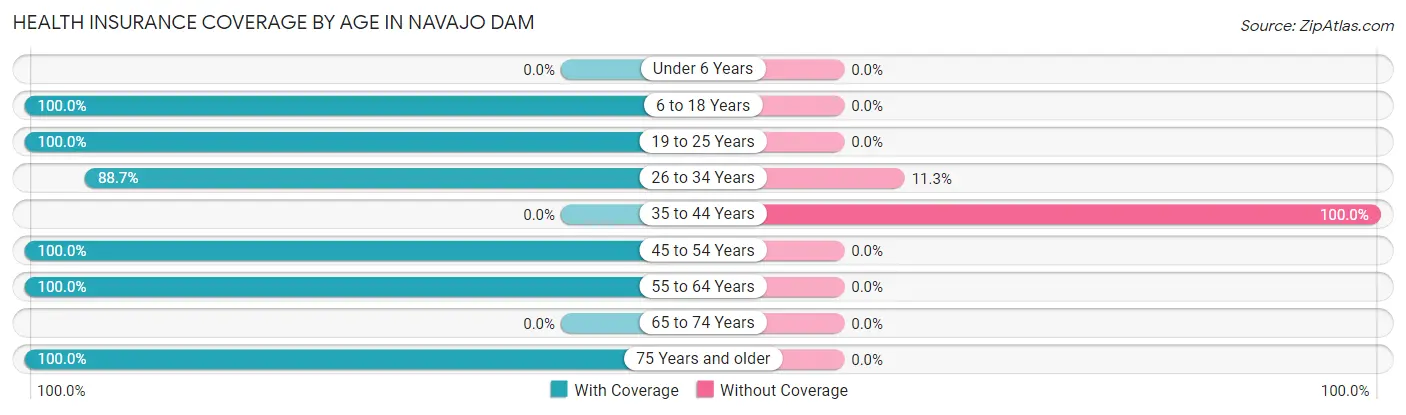
| Age Bracket | With Coverage | Without Coverage |
| Under 6 Years | 0 (0.0%) | 0 (0.0%) |
| 6 to 18 Years | 60 (100.0%) | 0 (0.0%) |
| 19 to 25 Years | 17 (100.0%) | 0 (0.0%) |
| 26 to 34 Years | 63 (88.7%) | 8 (11.3%) |
| 35 to 44 Years | 0 (0.0%) | 30 (100.0%) |
| 45 to 54 Years | 89 (100.0%) | 0 (0.0%) |
| 55 to 64 Years | 41 (100.0%) | 0 (0.0%) |
| 65 to 74 Years | 0 (0.0%) | 0 (0.0%) |
| 75 Years and older | 22 (100.0%) | 0 (0.0%) |
| Total | 292 (88.5%) | 38 (11.5%) |
Health Insurance Coverage by Citizenship Status in Navajo Dam
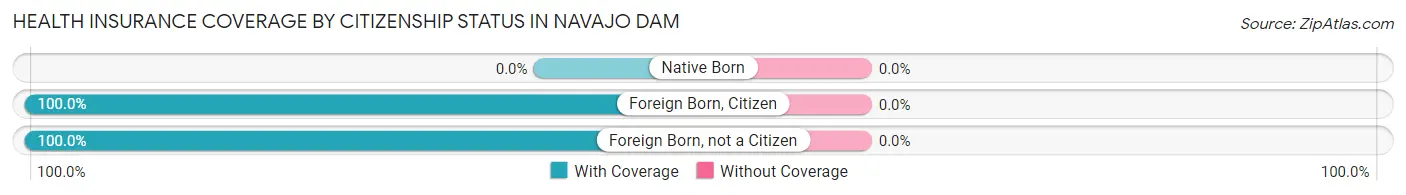
| Citizenship Status | With Coverage | Without Coverage |
| Native Born | 0 (0.0%) | 0 (0.0%) |
| Foreign Born, Citizen | 60 (100.0%) | 0 (0.0%) |
| Foreign Born, not a Citizen | 17 (100.0%) | 0 (0.0%) |
Health Insurance Coverage by Household Income in Navajo Dam
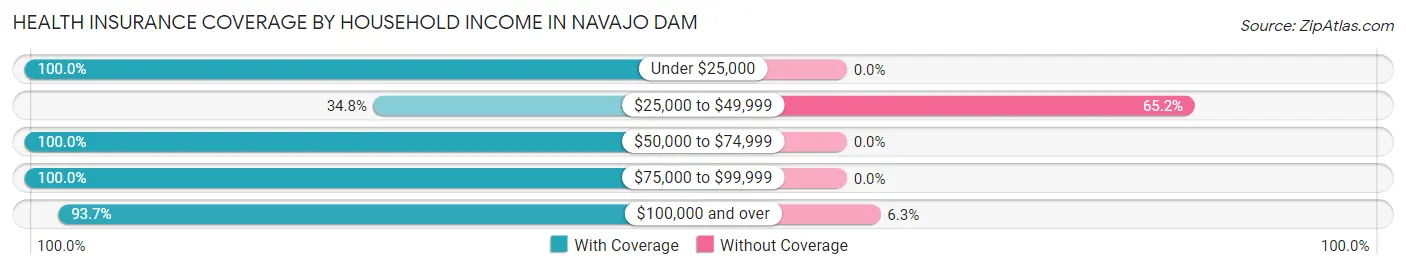
| Household Income | With Coverage | Without Coverage |
| Under $25,000 | 25 (100.0%) | 0 (0.0%) |
| $25,000 to $49,999 | 16 (34.8%) | 30 (65.2%) |
| $50,000 to $74,999 | 82 (100.0%) | 0 (0.0%) |
| $75,000 to $99,999 | 46 (100.0%) | 0 (0.0%) |
| $100,000 and over | 119 (93.7%) | 8 (6.3%) |
Public vs Private Health Insurance Coverage by Age in Navajo Dam
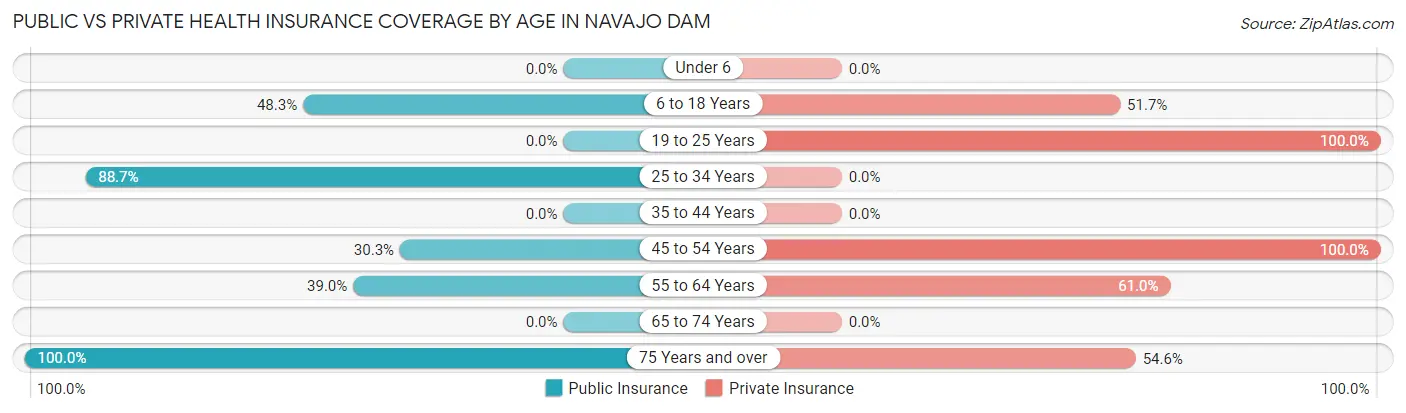
| Age Bracket | Public Insurance | Private Insurance |
| Under 6 | 0 (0.0%) | 0 (0.0%) |
| 6 to 18 Years | 29 (48.3%) | 31 (51.7%) |
| 19 to 25 Years | 0 (0.0%) | 17 (100.0%) |
| 25 to 34 Years | 63 (88.7%) | 0 (0.0%) |
| 35 to 44 Years | 0 (0.0%) | 0 (0.0%) |
| 45 to 54 Years | 27 (30.3%) | 89 (100.0%) |
| 55 to 64 Years | 16 (39.0%) | 25 (61.0%) |
| 65 to 74 Years | 0 (0.0%) | 0 (0.0%) |
| 75 Years and over | 22 (100.0%) | 12 (54.5%) |
| Total | 157 (47.6%) | 174 (52.7%) |
Disability Status by Sex by Age in Navajo Dam
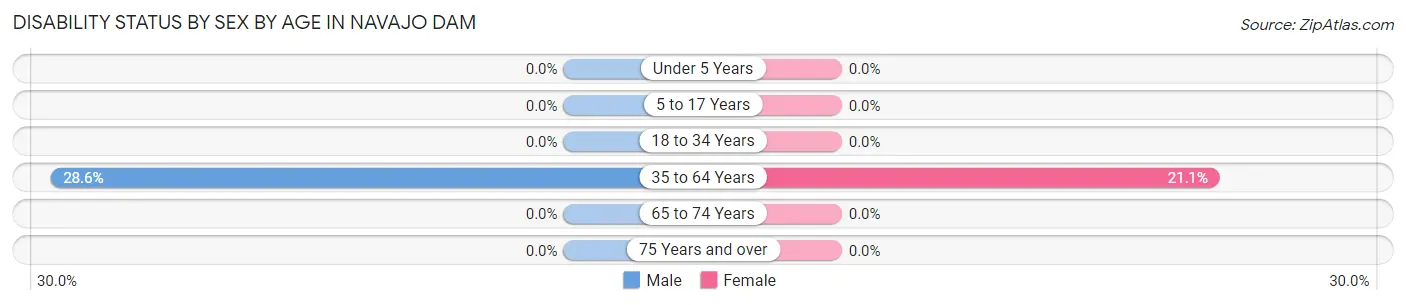
| Age Bracket | Male | Female |
| Under 5 Years | 0 (0.0%) | 0 (0.0%) |
| 5 to 17 Years | 0 (0.0%) | 0 (0.0%) |
| 18 to 34 Years | 0 (0.0%) | 0 (0.0%) |
| 35 to 64 Years | 24 (28.6%) | 16 (21.0%) |
| 65 to 74 Years | 0 (0.0%) | 0 (0.0%) |
| 75 Years and over | 0 (0.0%) | 0 (0.0%) |
Disability Class by Sex by Age in Navajo Dam
Disability Class: Hearing Difficulty
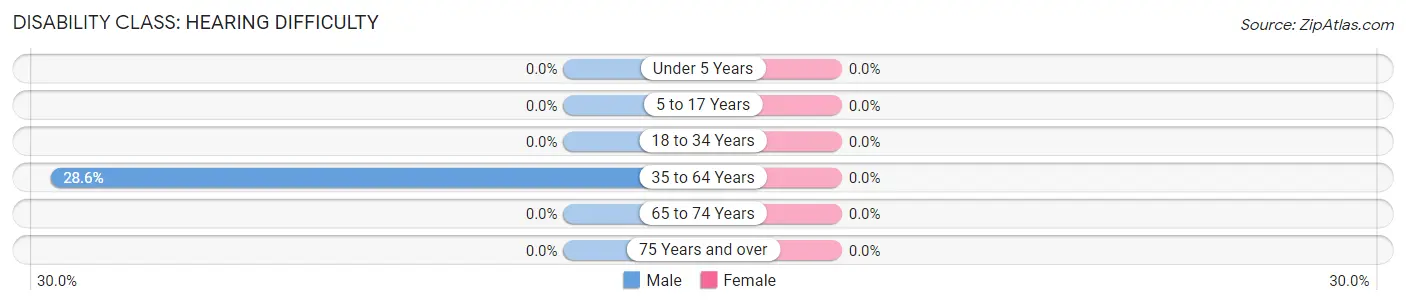
| Age Bracket | Male | Female |
| Under 5 Years | 0 (0.0%) | 0 (0.0%) |
| 5 to 17 Years | 0 (0.0%) | 0 (0.0%) |
| 18 to 34 Years | 0 (0.0%) | 0 (0.0%) |
| 35 to 64 Years | 24 (28.6%) | 0 (0.0%) |
| 65 to 74 Years | 0 (0.0%) | 0 (0.0%) |
| 75 Years and over | 0 (0.0%) | 0 (0.0%) |
Disability Class: Vision Difficulty
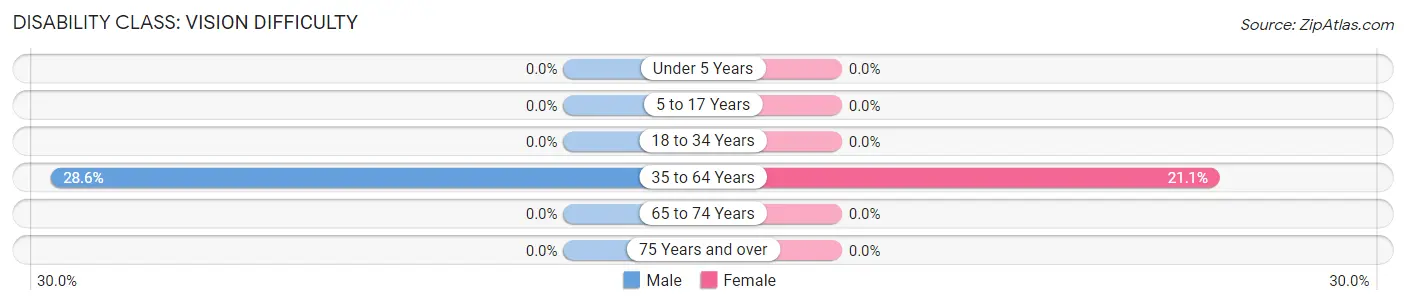
| Age Bracket | Male | Female |
| Under 5 Years | 0 (0.0%) | 0 (0.0%) |
| 5 to 17 Years | 0 (0.0%) | 0 (0.0%) |
| 18 to 34 Years | 0 (0.0%) | 0 (0.0%) |
| 35 to 64 Years | 24 (28.6%) | 16 (21.0%) |
| 65 to 74 Years | 0 (0.0%) | 0 (0.0%) |
| 75 Years and over | 0 (0.0%) | 0 (0.0%) |
Disability Class: Cognitive Difficulty
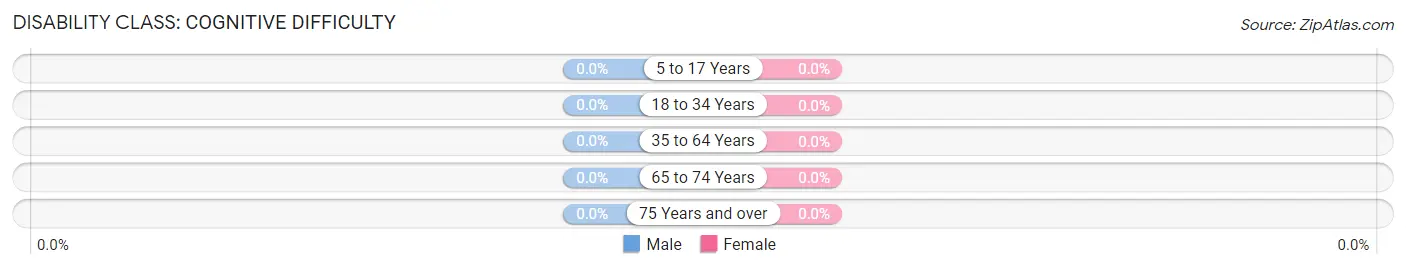
| Age Bracket | Male | Female |
| 5 to 17 Years | 0 (0.0%) | 0 (0.0%) |
| 18 to 34 Years | 0 (0.0%) | 0 (0.0%) |
| 35 to 64 Years | 0 (0.0%) | 0 (0.0%) |
| 65 to 74 Years | 0 (0.0%) | 0 (0.0%) |
| 75 Years and over | 0 (0.0%) | 0 (0.0%) |
Disability Class: Ambulatory Difficulty
| Age Bracket | Male | Female |
| 5 to 17 Years | 0 (0.0%) | 0 (0.0%) |
| 18 to 34 Years | 0 (0.0%) | 0 (0.0%) |
| 35 to 64 Years | 0 (0.0%) | 0 (0.0%) |
| 65 to 74 Years | 0 (0.0%) | 0 (0.0%) |
| 75 Years and over | 0 (0.0%) | 0 (0.0%) |
Disability Class: Self-Care Difficulty
| Age Bracket | Male | Female |
| 5 to 17 Years | 0 (0.0%) | 0 (0.0%) |
| 18 to 34 Years | 0 (0.0%) | 0 (0.0%) |
| 35 to 64 Years | 0 (0.0%) | 0 (0.0%) |
| 65 to 74 Years | 0 (0.0%) | 0 (0.0%) |
| 75 Years and over | 0 (0.0%) | 0 (0.0%) |
Technology Access in Navajo Dam
Computing Device Access in Navajo Dam
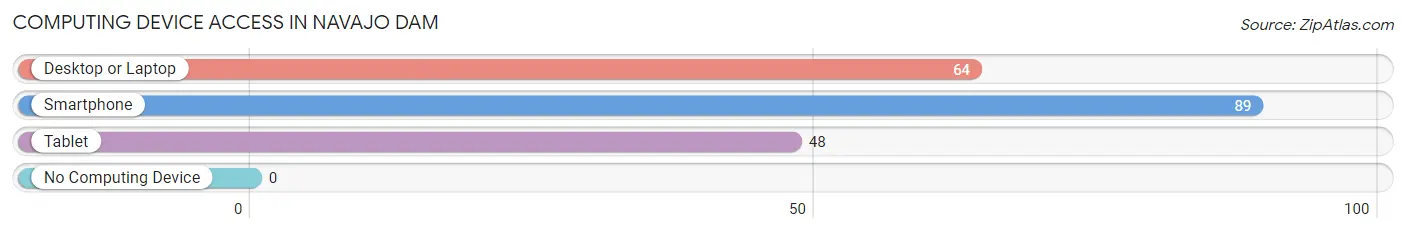
| Device Type | # Households | % Households |
| Desktop or Laptop | 64 | 71.9% |
| Smartphone | 89 | 100.0% |
| Tablet | 48 | 53.9% |
| No Computing Device | 0 | 0.0% |
| Total | 89 | 100.0% |
Internet Access in Navajo Dam
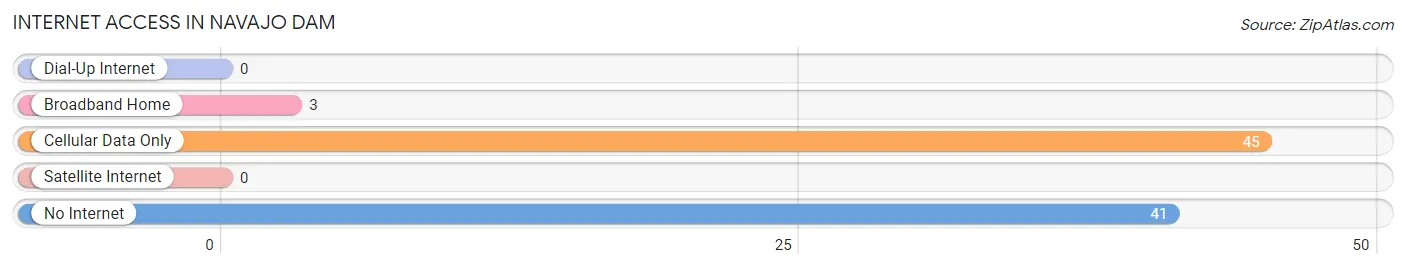
| Internet Type | # Households | % Households |
| Dial-Up Internet | 0 | 0.0% |
| Broadband Home | 3 | 3.4% |
| Cellular Data Only | 45 | 50.6% |
| Satellite Internet | 0 | 0.0% |
| No Internet | 41 | 46.1% |
| Total | 89 | 100.0% |
Navajo Dam Summary
Navajo Dam is a small unincorporated community located in San Juan County, New Mexico. It is situated on the San Juan River, approximately 20 miles north of Farmington, New Mexico. The community is located within the Navajo Nation, and is home to a population of approximately 1,000 people.
History
Navajo Dam was established in the early 1950s as part of the Navajo Indian Irrigation Project. The project was initiated by the Bureau of Indian Affairs in order to provide irrigation water to the Navajo Nation. The dam was constructed in 1954 and was completed in 1957. The dam was built to provide water for the Navajo Nation, as well as to generate hydroelectric power.
The dam was initially operated by the Bureau of Indian Affairs, but in 1964, the Navajo Nation took over the operation of the dam. The dam is now operated by the Navajo Tribal Utility Authority.
Geography
Navajo Dam is located in the Four Corners region of the United States, where the states of Arizona, Colorado, New Mexico, and Utah meet. The community is situated on the San Juan River, approximately 20 miles north of Farmington, New Mexico. The area is characterized by high desert terrain, with elevations ranging from 5,000 to 8,000 feet.
The climate in the area is semi-arid, with hot summers and cold winters. The average annual precipitation is approximately 8 inches.
Economy
The economy of Navajo Dam is largely based on tourism and agriculture. The area is home to a number of tourist attractions, including the Navajo Dam State Park, the Navajo Dam Marina, and the Navajo Dam Golf Course.
Agriculture is also an important part of the local economy. The area is home to a number of farms and ranches, which produce a variety of crops, including alfalfa, corn, hay, and wheat.
Demographics
As of the 2010 census, the population of Navajo Dam was 1,000. The racial makeup of the community was 95.2% Native American, 2.2% White, 0.2% African American, 0.2% Asian, and 2.2% from other races.
The median household income in the community was $25,000, and the median family income was $30,000. The per capita income was $14,000. Approximately 25% of the population was below the poverty line.
Conclusion
Navajo Dam is a small unincorporated community located in San Juan County, New Mexico. It is situated on the San Juan River, approximately 20 miles north of Farmington, New Mexico. The community is located within the Navajo Nation, and is home to a population of approximately 1,000 people. The economy of Navajo Dam is largely based on tourism and agriculture, and the area is home to a number of tourist attractions and farms and ranches. The racial makeup of the community is 95.2% Native American, 2.2% White, 0.2% African American, 0.2% Asian, and 2.2% from other races. The median household income in the community was $25,000, and the median family income was $30,000. Approximately 25% of the population was below the poverty line.
Common Questions
What is Per Capita Income in Navajo Dam?
Per Capita income in Navajo Dam is $31,930.
What is the Median Family Income in Navajo Dam?
Median Family Income in Navajo Dam is $70,625.
What is the Median Household income in Navajo Dam?
Median Household Income in Navajo Dam is $63,375.
What is Inequality or Gini Index in Navajo Dam?
Inequality or Gini Index in Navajo Dam is 0.38.
What is the Total Population of Navajo Dam?
Total Population of Navajo Dam is 330.
What is the Total Male Population of Navajo Dam?
Total Male Population of Navajo Dam is 173.
What is the Total Female Population of Navajo Dam?
Total Female Population of Navajo Dam is 157.
What is the Ratio of Males per 100 Females in Navajo Dam?
There are 110.19 Males per 100 Females in Navajo Dam.
What is the Ratio of Females per 100 Males in Navajo Dam?
There are 90.75 Females per 100 Males in Navajo Dam.
What is the Median Population Age in Navajo Dam?
Median Population Age in Navajo Dam is 36.6 Years.
What is the Average Family Size in Navajo Dam
Average Family Size in Navajo Dam is 4.7 People.
What is the Average Household Size in Navajo Dam
Average Household Size in Navajo Dam is 3.7 People.
How Large is the Labor Force in Navajo Dam?
There are 221 People in the Labor Forcein in Navajo Dam.
What is the Percentage of People in the Labor Force in Navajo Dam?
76.5% of People are in the Labor Force in Navajo Dam.
What is the Unemployment Rate in Navajo Dam?
Unemployment Rate in Navajo Dam is 28.5%.