Zip Codes with the Highest Percentage of Population Employed in Food Preparation & Serving in Gallup, NM
RELATED REPORTS & OPTIONS
Food Preparation & Serving
Gallup
Compare Zip Codes
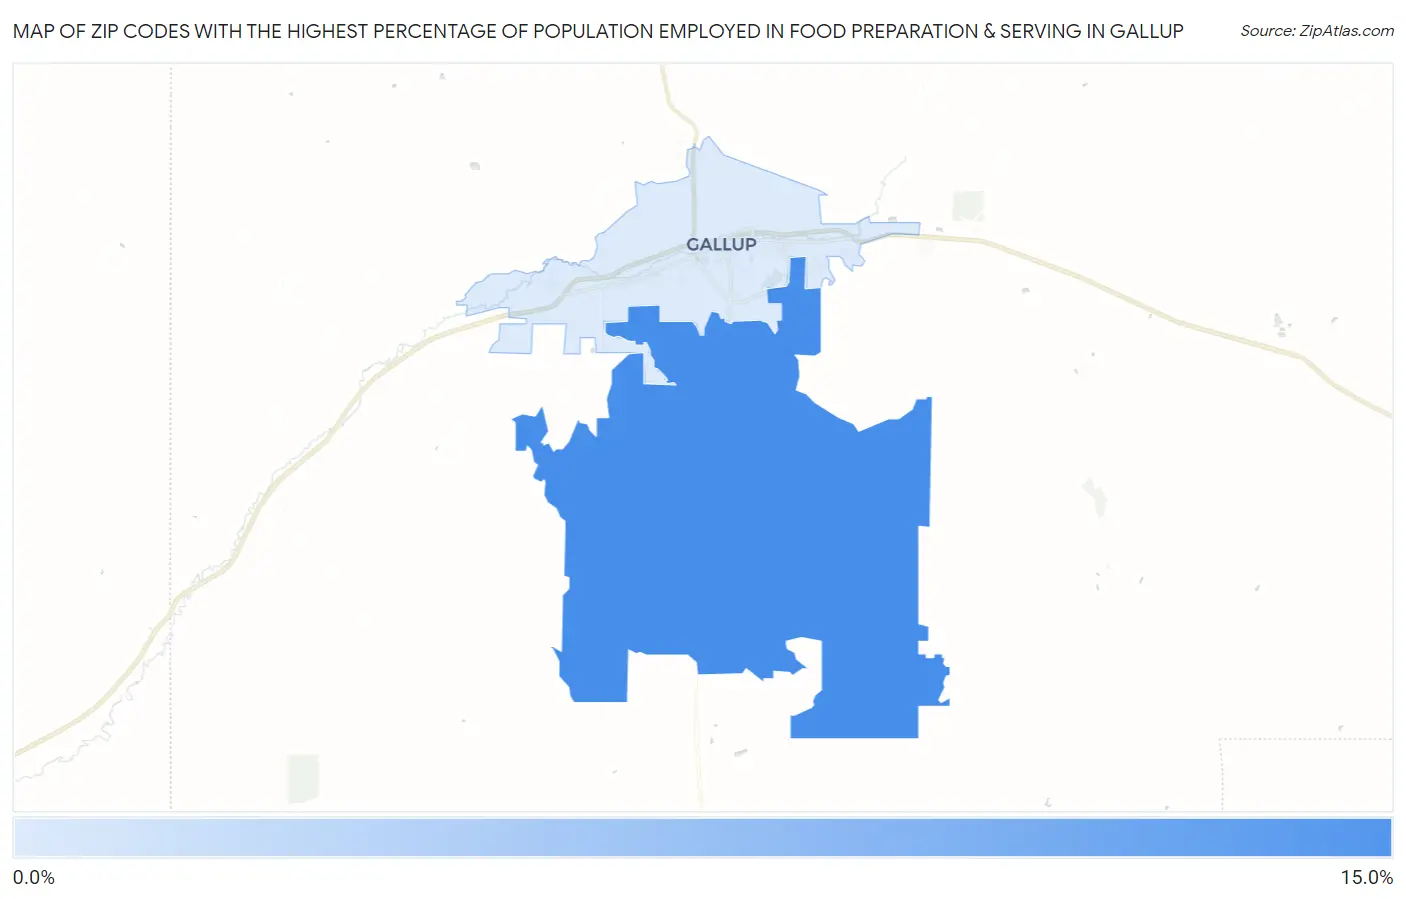
Map of Zip Codes with the Highest Percentage of Population Employed in Food Preparation & Serving in Gallup
5.0%
14.6%
Zip Codes with the Highest Percentage of Population Employed in Food Preparation & Serving in Gallup, NM
| Zip Code | % Employed | vs State | vs National | |
| 1. | 87305 | 14.6% | 5.8%(+8.80)#19 | 5.3%(+9.27)#1,049 |
| 2. | 87301 | 5.0% | 5.8%(-0.777)#136 | 5.3%(-0.307)#13,030 |
1
Common Questions
What are the Top Zip Codes with the Highest Percentage of Population Employed in Food Preparation & Serving in Gallup, NM?
Top Zip Codes with the Highest Percentage of Population Employed in Food Preparation & Serving in Gallup, NM are:
What zip code has the Highest Percentage of Population Employed in Food Preparation & Serving in Gallup, NM?
87305 has the Highest Percentage of Population Employed in Food Preparation & Serving in Gallup, NM with 14.6%.
What is the Percentage of Population Employed in Food Preparation & Serving in Gallup, NM?
Percentage of Population Employed in Food Preparation & Serving in Gallup is 5.1%.
What is the Percentage of Population Employed in Food Preparation & Serving in New Mexico?
Percentage of Population Employed in Food Preparation & Serving in New Mexico is 5.8%.
What is the Percentage of Population Employed in Food Preparation & Serving in the United States?
Percentage of Population Employed in Food Preparation & Serving in the United States is 5.3%.