Church Rock, NM Map & Demographics
Church Rock Map
Church Rock Overview
$13,218
PER CAPITA INCOME
$41,563
AVG FAMILY INCOME
$31,875
AVG HOUSEHOLD INCOME
14.4%
WAGE / INCOME GAP [ % ]
85.6¢/ $1
WAGE / INCOME GAP [ $ ]
$18,382
FAMILY INCOME DEFICIT
0.48
INEQUALITY / GINI INDEX
1,395
TOTAL POPULATION
578
MALE POPULATION
817
FEMALE POPULATION
70.75
MALES / 100 FEMALES
141.35
FEMALES / 100 MALES
30.1
MEDIAN AGE
4.7
AVG FAMILY SIZE
3.8
AVG HOUSEHOLD SIZE
477
LABOR FORCE [ PEOPLE ]
48.1%
PERCENT IN LABOR FORCE
7.3%
UNEMPLOYMENT RATE
Church Rock Zip Codes
Church Rock Area Codes
Income in Church Rock
Income Overview in Church Rock
Per Capita Income in Church Rock is $13,218, while median incomes of families and households are $41,563 and $31,875 respectively.
| Characteristic | Number | Measure |
| Per Capita Income | 1,395 | $13,218 |
| Median Family Income | 261 | $41,563 |
| Mean Family Income | 261 | $46,995 |
| Median Household Income | 369 | $31,875 |
| Mean Household Income | 369 | $43,221 |
| Income Deficit | 261 | $18,382 |
| Wage / Income Gap (%) | 1,395 | 14.37% |
| Wage / Income Gap ($) | 1,395 | 85.63¢ per $1 |
| Gini / Inequality Index | 1,395 | 0.48 |
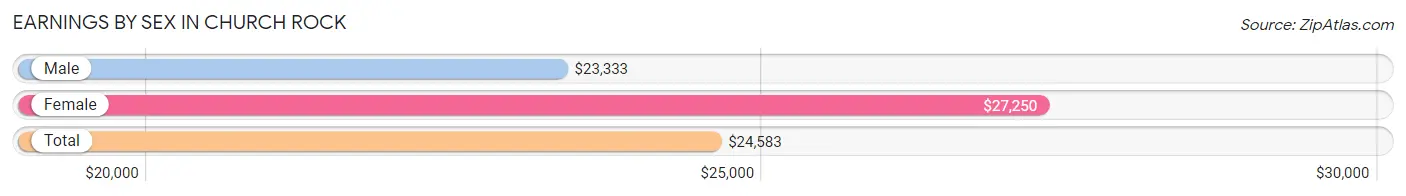
Earnings by Sex in Church Rock
Average Earnings in Church Rock are $24,583, $23,333 for men and $27,250 for women, a difference of 14.4%.
| Sex | Number | Average Earnings |
| Male | 234 (48.0%) | $23,333 |
| Female | 253 (51.9%) | $27,250 |
| Total | 487 (100.0%) | $24,583 |
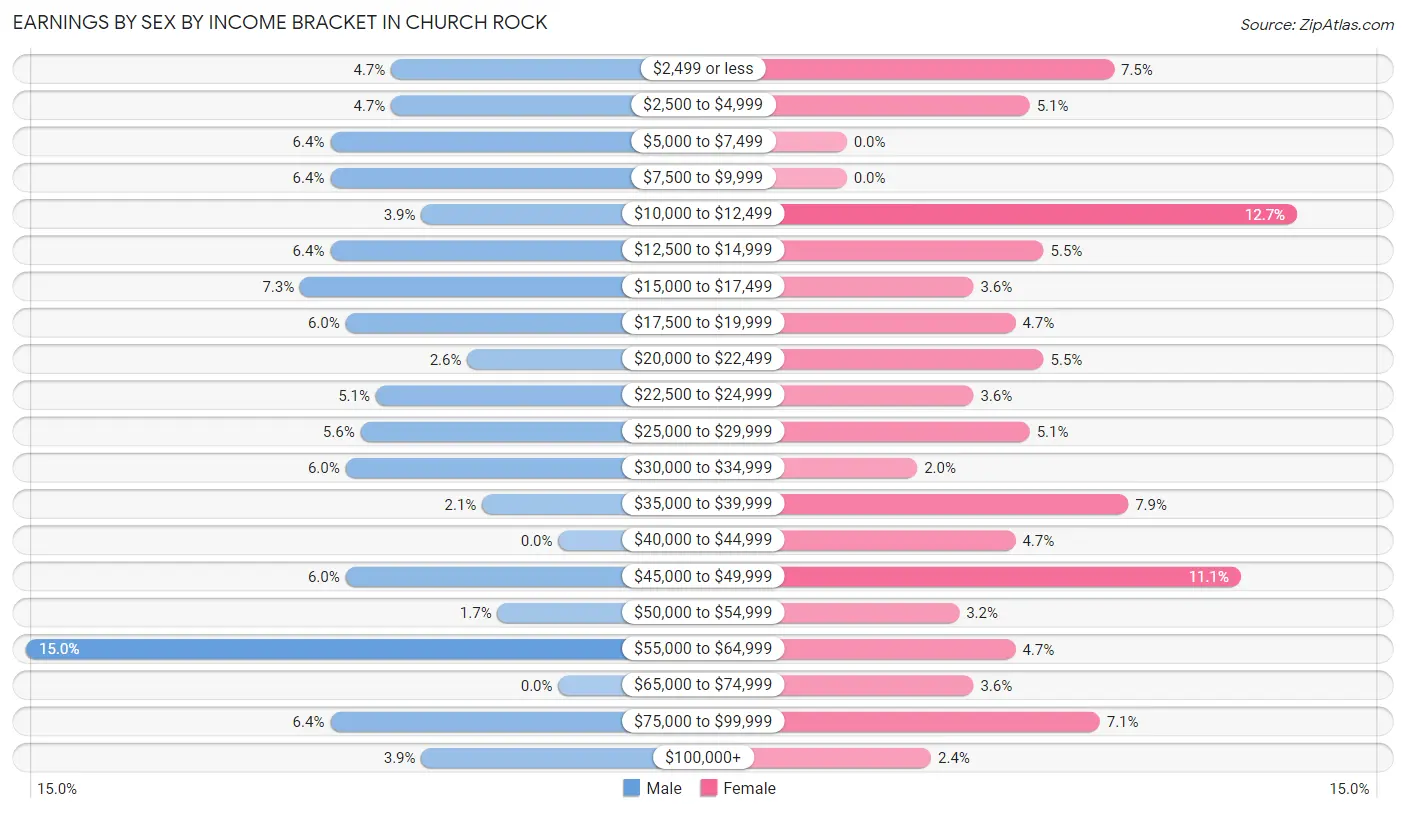
Earnings by Sex by Income Bracket in Church Rock
The most common earnings brackets in Church Rock are $55,000 to $64,999 for men (35 | 15.0%) and $10,000 to $12,499 for women (32 | 12.7%).
| Income | Male | Female |
| $2,499 or less | 11 (4.7%) | 19 (7.5%) |
| $2,500 to $4,999 | 11 (4.7%) | 13 (5.1%) |
| $5,000 to $7,499 | 15 (6.4%) | 0 (0.0%) |
| $7,500 to $9,999 | 15 (6.4%) | 0 (0.0%) |
| $10,000 to $12,499 | 9 (3.8%) | 32 (12.7%) |
| $12,500 to $14,999 | 15 (6.4%) | 14 (5.5%) |
| $15,000 to $17,499 | 17 (7.3%) | 9 (3.6%) |
| $17,500 to $19,999 | 14 (6.0%) | 12 (4.7%) |
| $20,000 to $22,499 | 6 (2.6%) | 14 (5.5%) |
| $22,500 to $24,999 | 12 (5.1%) | 9 (3.6%) |
| $25,000 to $29,999 | 13 (5.6%) | 13 (5.1%) |
| $30,000 to $34,999 | 14 (6.0%) | 5 (2.0%) |
| $35,000 to $39,999 | 5 (2.1%) | 20 (7.9%) |
| $40,000 to $44,999 | 0 (0.0%) | 12 (4.7%) |
| $45,000 to $49,999 | 14 (6.0%) | 28 (11.1%) |
| $50,000 to $54,999 | 4 (1.7%) | 8 (3.2%) |
| $55,000 to $64,999 | 35 (15.0%) | 12 (4.7%) |
| $65,000 to $74,999 | 0 (0.0%) | 9 (3.6%) |
| $75,000 to $99,999 | 15 (6.4%) | 18 (7.1%) |
| $100,000+ | 9 (3.8%) | 6 (2.4%) |
| Total | 234 (100.0%) | 253 (100.0%) |
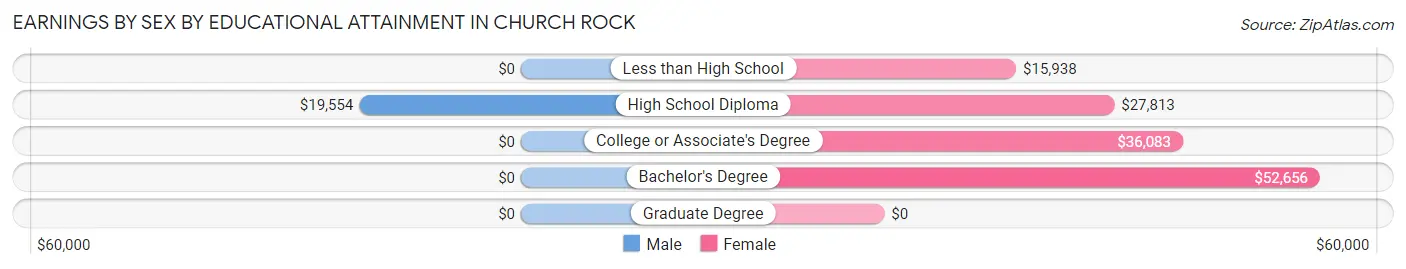
Earnings by Sex by Educational Attainment in Church Rock
Average earnings in Church Rock are $25,865 for men and $31,250 for women, a difference of 17.2%. Men with an educational attainment of high school diploma enjoy the highest average annual earnings of $19,554, while those with high school diploma education earn the least with $19,554. Women with an educational attainment of bachelor's degree earn the most with the average annual earnings of $52,656, while those with less than high school education have the smallest earnings of $15,938.
| Educational Attainment | Male Income | Female Income |
| Less than High School | - | - |
| High School Diploma | $19,554 | $27,813 |
| College or Associate's Degree | - | - |
| Bachelor's Degree | - | - |
| Graduate Degree | - | - |
| Total | $25,865 | $31,250 |
Family Income in Church Rock
Family Income Brackets in Church Rock
According to the Church Rock family income data, there are 54 families falling into the $50,000 to $74,999 income range, which is the most common income bracket and makes up 20.7% of all families.
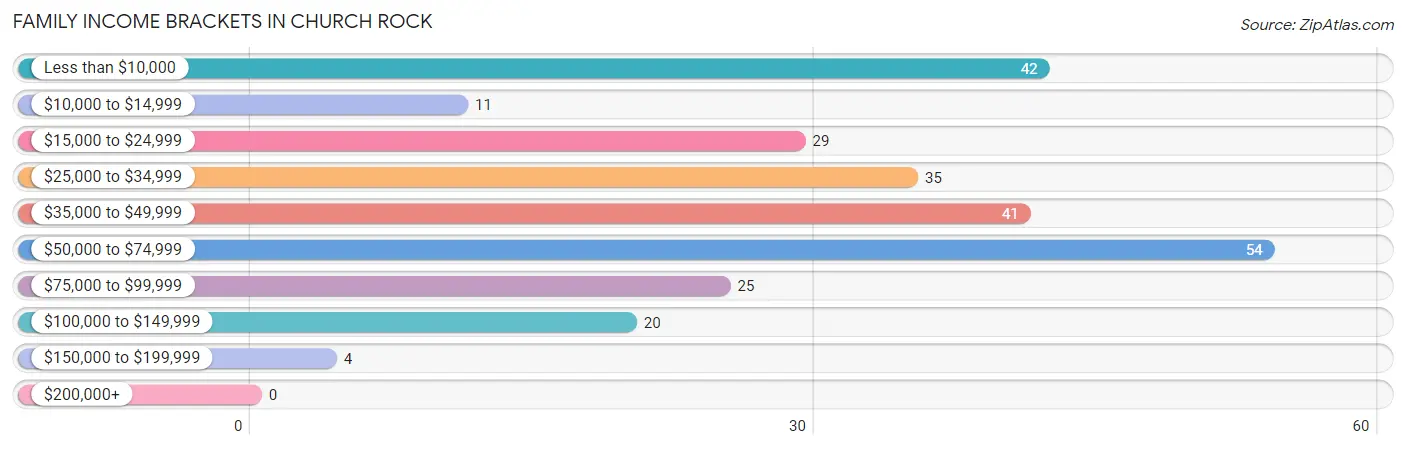
| Income Bracket | # Families | % Families |
| Less than $10,000 | 42 | 16.1% |
| $10,000 to $14,999 | 11 | 4.2% |
| $15,000 to $24,999 | 29 | 11.1% |
| $25,000 to $34,999 | 35 | 13.4% |
| $35,000 to $49,999 | 41 | 15.7% |
| $50,000 to $74,999 | 54 | 20.7% |
| $75,000 to $99,999 | 25 | 9.6% |
| $100,000 to $149,999 | 20 | 7.7% |
| $150,000 to $199,999 | 4 | 1.5% |
| $200,000+ | 0 | 0.0% |
Family Income by Famaliy Size in Church Rock
5-person families (54 | 20.7%) account for the highest median family income in Church Rock with $55,978 per family, while 3-person families (42 | 16.1%) have the highest median income of $13,750 per family member.
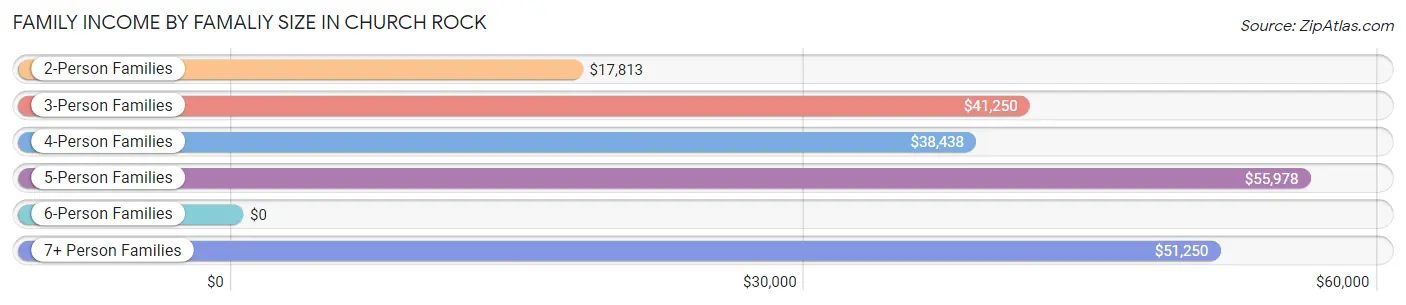
| Income Bracket | # Families | Median Income |
| 2-Person Families | 55 (21.1%) | $17,813 |
| 3-Person Families | 42 (16.1%) | $41,250 |
| 4-Person Families | 55 (21.1%) | $38,438 |
| 5-Person Families | 54 (20.7%) | $55,978 |
| 6-Person Families | 14 (5.4%) | $0 |
| 7+ Person Families | 41 (15.7%) | $51,250 |
| Total | 261 (100.0%) | $41,563 |
Family Income by Number of Earners in Church Rock
The median family income in Church Rock is $41,563, with families comprising 3+ earners (26) having the highest median family income of $81,250, while families with no earners (51) have the lowest median family income of $14,107, accounting for 10.0% and 19.5% of families, respectively.
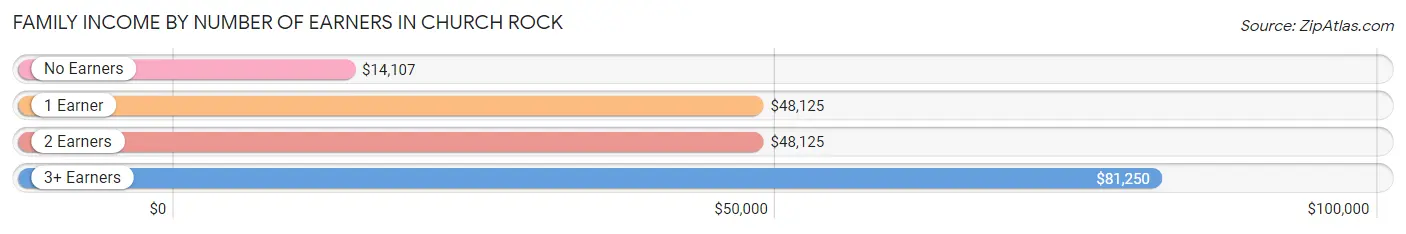
| Number of Earners | # Families | Median Income |
| No Earners | 51 (19.5%) | $14,107 |
| 1 Earner | 130 (49.8%) | $48,125 |
| 2 Earners | 54 (20.7%) | $48,125 |
| 3+ Earners | 26 (10.0%) | $81,250 |
| Total | 261 (100.0%) | $41,563 |
Household Income in Church Rock
Household Income Brackets in Church Rock
With 72 households falling in the category, the less than $10,000 income range is the most frequent in Church Rock, accounting for 19.5% of all households. In contrast, only 4 households (1.1%) fall into the $150,000 to $199,999 income bracket, making it the least populous group.
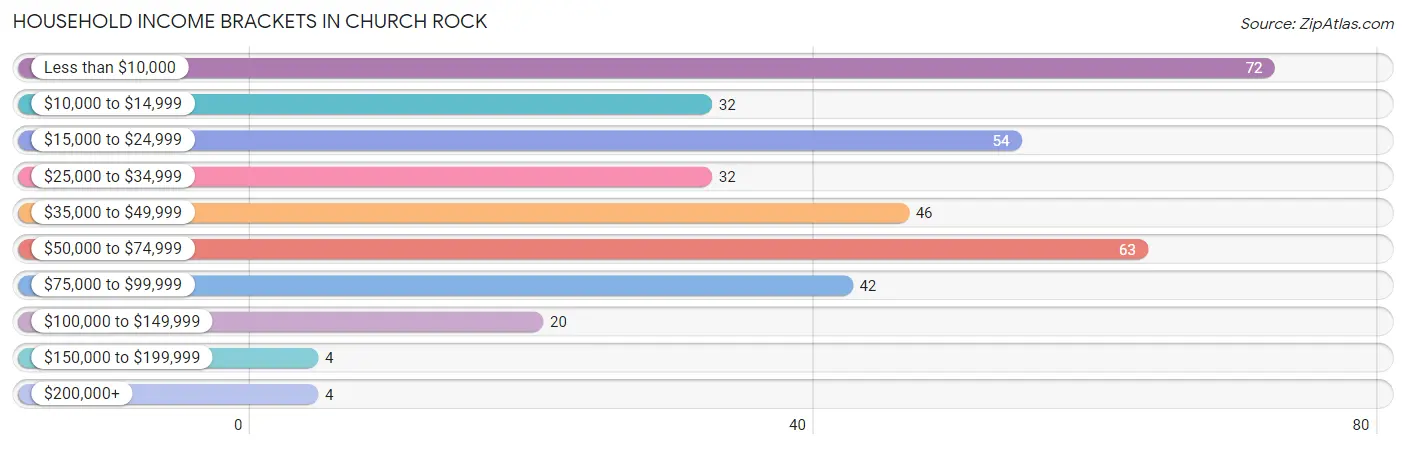
| Income Bracket | # Households | % Households |
| Less than $10,000 | 72 | 19.5% |
| $10,000 to $14,999 | 32 | 8.7% |
| $15,000 to $24,999 | 54 | 14.6% |
| $25,000 to $34,999 | 32 | 8.7% |
| $35,000 to $49,999 | 46 | 12.5% |
| $50,000 to $74,999 | 63 | 17.1% |
| $75,000 to $99,999 | 42 | 11.4% |
| $100,000 to $149,999 | 20 | 5.4% |
| $150,000 to $199,999 | 4 | 1.1% |
| $200,000+ | 4 | 1.1% |
Household Income by Householder Age in Church Rock
The median household income in Church Rock is $31,875, with the highest median household income of $51,250 found in the 25 to 44 years age bracket for the primary householder. A total of 128 households (34.7%) fall into this category.
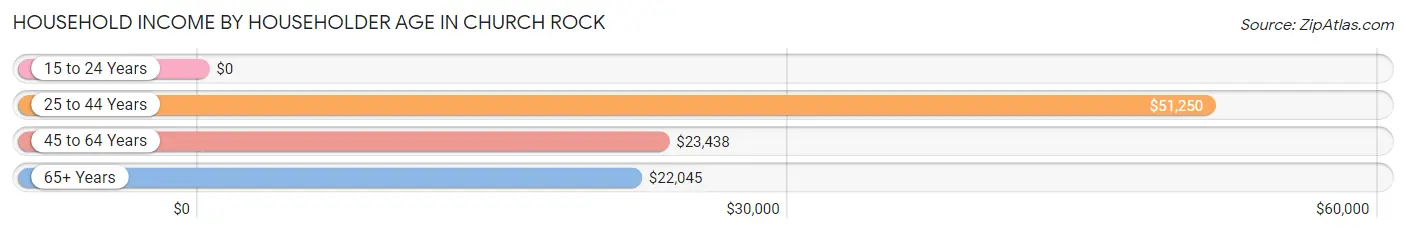
| Income Bracket | # Households | Median Income |
| 15 to 24 Years | 0 (0.0%) | $0 |
| 25 to 44 Years | 128 (34.7%) | $51,250 |
| 45 to 64 Years | 163 (44.2%) | $23,438 |
| 65+ Years | 78 (21.1%) | $22,045 |
| Total | 369 (100.0%) | $31,875 |
Poverty in Church Rock
Income Below Poverty by Sex and Age in Church Rock
With 32.5% poverty level for males and 33.5% for females among the residents of Church Rock, 12 to 14 year old males and 5 year old females are the most vulnerable to poverty, with 13 males (59.1%) and 28 females (59.6%) in their respective age groups living below the poverty level.
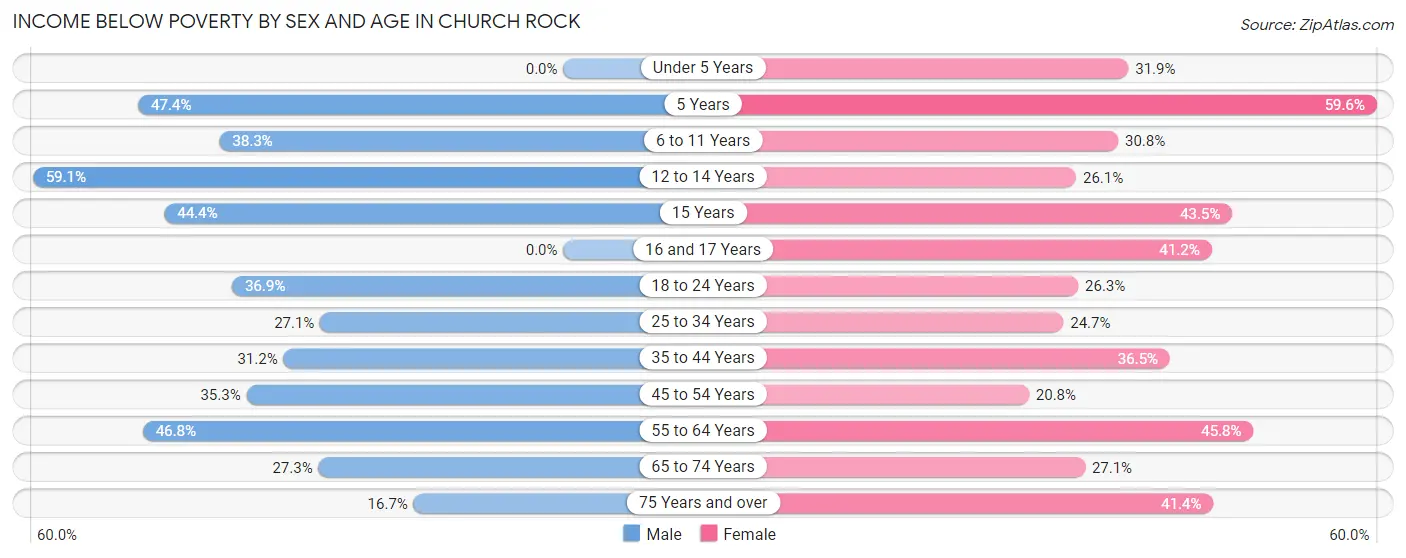
| Age Bracket | Male | Female |
| Under 5 Years | 0 (0.0%) | 15 (31.9%) |
| 5 Years | 9 (47.4%) | 28 (59.6%) |
| 6 to 11 Years | 18 (38.3%) | 20 (30.8%) |
| 12 to 14 Years | 13 (59.1%) | 18 (26.1%) |
| 15 Years | 4 (44.4%) | 10 (43.5%) |
| 16 and 17 Years | 0 (0.0%) | 14 (41.2%) |
| 18 to 24 Years | 31 (36.9%) | 15 (26.3%) |
| 25 to 34 Years | 26 (27.1%) | 37 (24.7%) |
| 35 to 44 Years | 24 (31.2%) | 38 (36.5%) |
| 45 to 54 Years | 12 (35.3%) | 10 (20.8%) |
| 55 to 64 Years | 37 (46.8%) | 44 (45.8%) |
| 65 to 74 Years | 9 (27.3%) | 13 (27.1%) |
| 75 Years and over | 3 (16.7%) | 12 (41.4%) |
| Total | 186 (32.5%) | 274 (33.5%) |
Income Above Poverty by Sex and Age in Church Rock
According to the poverty statistics in Church Rock, males aged under 5 years and females aged 45 to 54 years are the age groups that are most secure financially, with 100.0% of males and 79.2% of females in these age groups living above the poverty line.
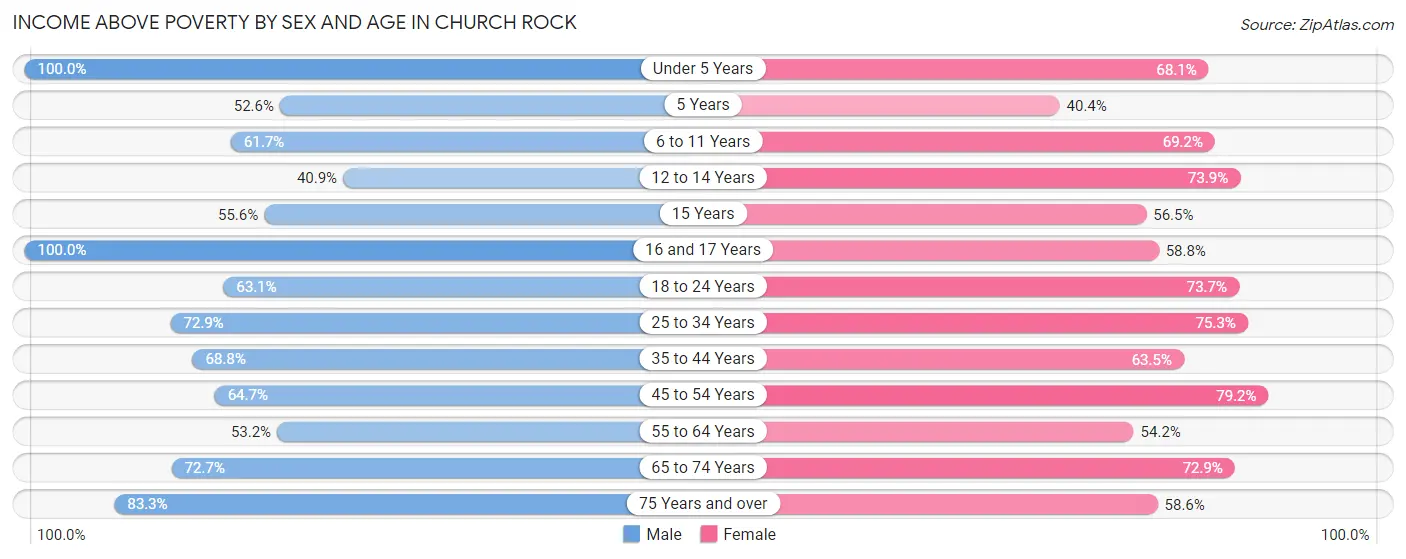
| Age Bracket | Male | Female |
| Under 5 Years | 50 (100.0%) | 32 (68.1%) |
| 5 Years | 10 (52.6%) | 19 (40.4%) |
| 6 to 11 Years | 29 (61.7%) | 45 (69.2%) |
| 12 to 14 Years | 9 (40.9%) | 51 (73.9%) |
| 15 Years | 5 (55.6%) | 13 (56.5%) |
| 16 and 17 Years | 5 (100.0%) | 20 (58.8%) |
| 18 to 24 Years | 53 (63.1%) | 42 (73.7%) |
| 25 to 34 Years | 70 (72.9%) | 113 (75.3%) |
| 35 to 44 Years | 53 (68.8%) | 66 (63.5%) |
| 45 to 54 Years | 22 (64.7%) | 38 (79.2%) |
| 55 to 64 Years | 42 (53.2%) | 52 (54.2%) |
| 65 to 74 Years | 24 (72.7%) | 35 (72.9%) |
| 75 Years and over | 15 (83.3%) | 17 (58.6%) |
| Total | 387 (67.5%) | 543 (66.5%) |
Income Below Poverty Among Married-Couple Families in Church Rock
The poverty statistics for married-couple families in Church Rock show that 24.7% or 23 of the total 93 families live below the poverty line. Families with 1 or 2 children have the highest poverty rate of 47.8%, comprising of 11 families. On the other hand, families with no children have the lowest poverty rate of 15.2%, which includes 7 families.
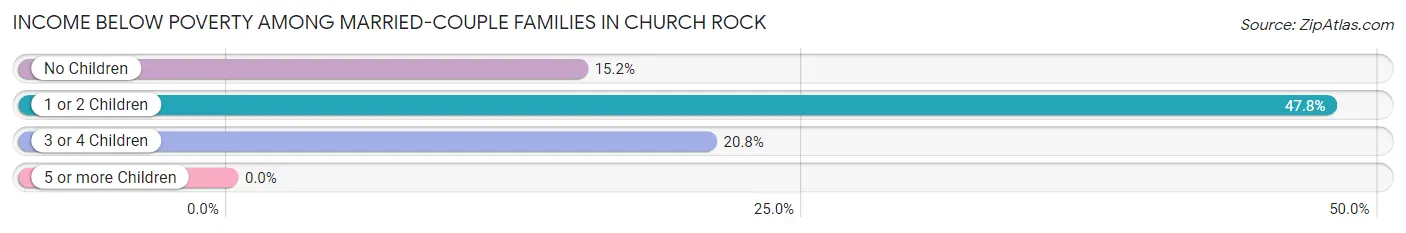
| Children | Above Poverty | Below Poverty |
| No Children | 39 (84.8%) | 7 (15.2%) |
| 1 or 2 Children | 12 (52.2%) | 11 (47.8%) |
| 3 or 4 Children | 19 (79.2%) | 5 (20.8%) |
| 5 or more Children | 0 (0.0%) | 0 (0.0%) |
| Total | 70 (75.3%) | 23 (24.7%) |
Income Below Poverty Among Single-Parent Households in Church Rock
According to the poverty data in Church Rock, 40.0% or 28 single-father households and 33.7% or 33 single-mother households are living below the poverty line. Among single-father households, those with no children have the highest poverty rate, with 12 households (75.0%) experiencing poverty. Likewise, among single-mother households, those with 3 or 4 children have the highest poverty rate, with 13 households (39.4%) falling below the poverty line.
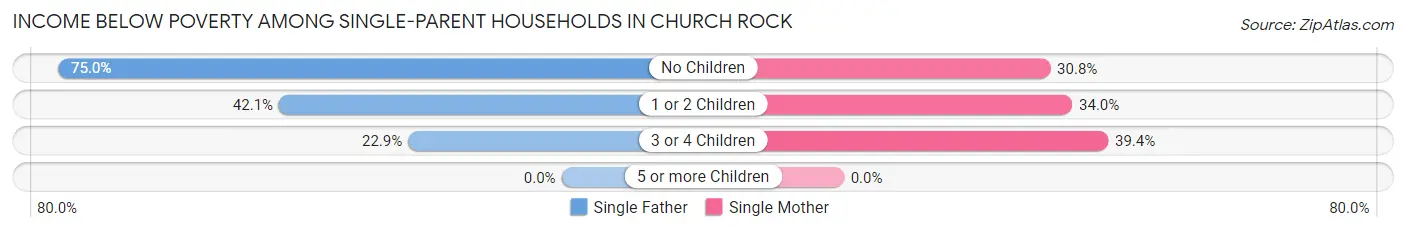
| Children | Single Father | Single Mother |
| No Children | 12 (75.0%) | 4 (30.8%) |
| 1 or 2 Children | 8 (42.1%) | 16 (34.0%) |
| 3 or 4 Children | 8 (22.9%) | 13 (39.4%) |
| 5 or more Children | 0 (0.0%) | 0 (0.0%) |
| Total | 28 (40.0%) | 33 (33.7%) |
Income Below Poverty Among Married-Couple vs Single-Parent Households in Church Rock
The poverty data for Church Rock shows that 23 of the married-couple family households (24.7%) and 61 of the single-parent households (36.3%) are living below the poverty level. Within the married-couple family households, those with 1 or 2 children have the highest poverty rate, with 11 households (47.8%) falling below the poverty line. Among the single-parent households, those with no children have the highest poverty rate, with 16 household (55.2%) living below poverty.
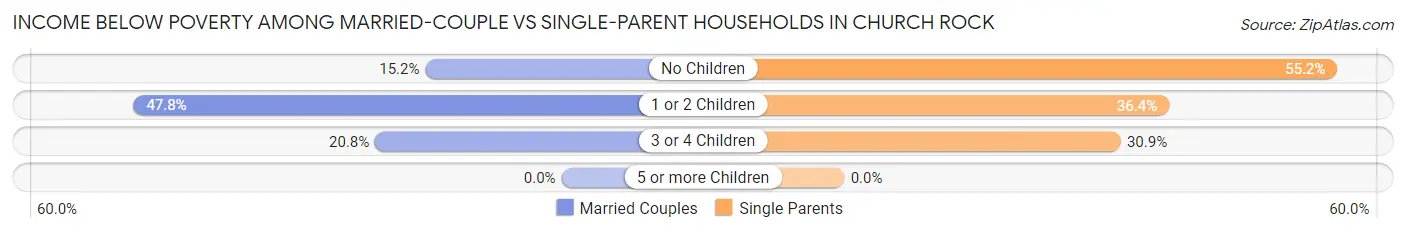
| Children | Married-Couple Families | Single-Parent Households |
| No Children | 7 (15.2%) | 16 (55.2%) |
| 1 or 2 Children | 11 (47.8%) | 24 (36.4%) |
| 3 or 4 Children | 5 (20.8%) | 21 (30.9%) |
| 5 or more Children | 0 (0.0%) | 0 (0.0%) |
| Total | 23 (24.7%) | 61 (36.3%) |
Race in Church Rock
The most populous races in Church Rock are Native / Alaskan (1,363 | 97.7%), Hispanic or Latino (44 | 3.2%), and Two or more Races (26 | 1.9%).
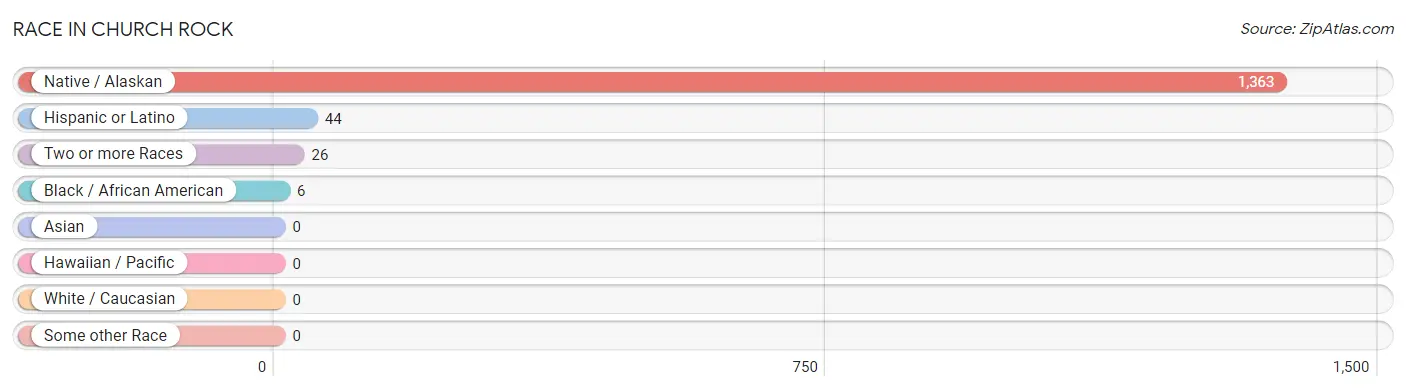
| Race | # Population | % Population |
| Asian | 0 | 0.0% |
| Black / African American | 6 | 0.4% |
| Hawaiian / Pacific | 0 | 0.0% |
| Hispanic or Latino | 44 | 3.2% |
| Native / Alaskan | 1,363 | 97.7% |
| White / Caucasian | 0 | 0.0% |
| Two or more Races | 26 | 1.9% |
| Some other Race | 0 | 0.0% |
| Total | 1,395 | 100.0% |
Ancestry in Church Rock
The most populous ancestries reported in Church Rock are Navajo (1,370 | 98.2%), Pima (46 | 3.3%), Hopi (40 | 2.9%), Italian (16 | 1.1%), and Pueblo (16 | 1.1%), together accounting for 106.7% of all Church Rock residents.
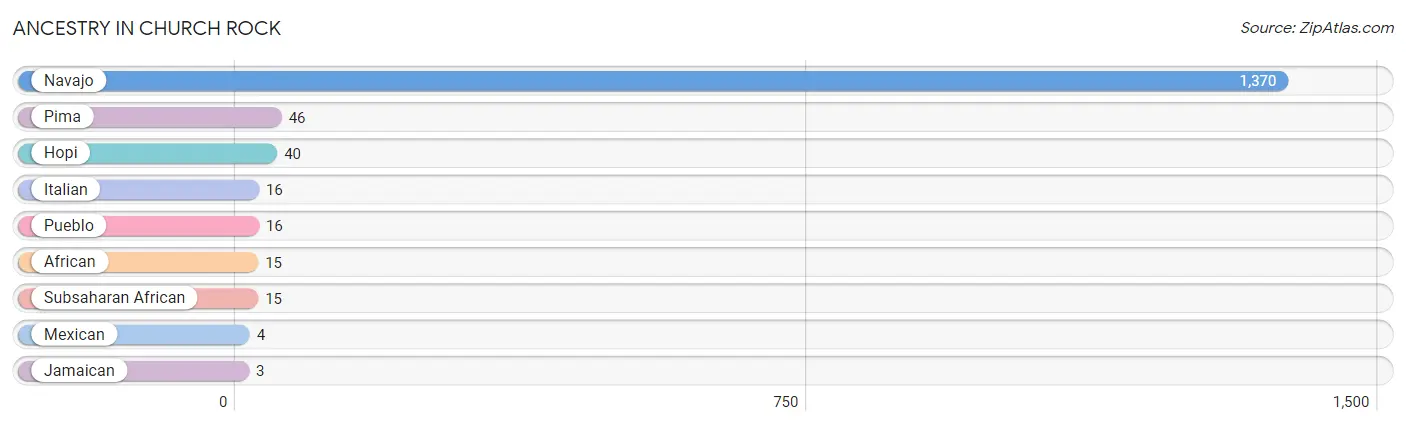
| Ancestry | # Population | % Population |
| African | 15 | 1.1% |
| Hopi | 40 | 2.9% |
| Italian | 16 | 1.1% |
| Jamaican | 3 | 0.2% |
| Mexican | 4 | 0.3% |
| Navajo | 1,370 | 98.2% |
| Pima | 46 | 3.3% |
| Pueblo | 16 | 1.1% |
| Subsaharan African | 15 | 1.1% | View All 9 Rows |
Immigrants in Church Rock
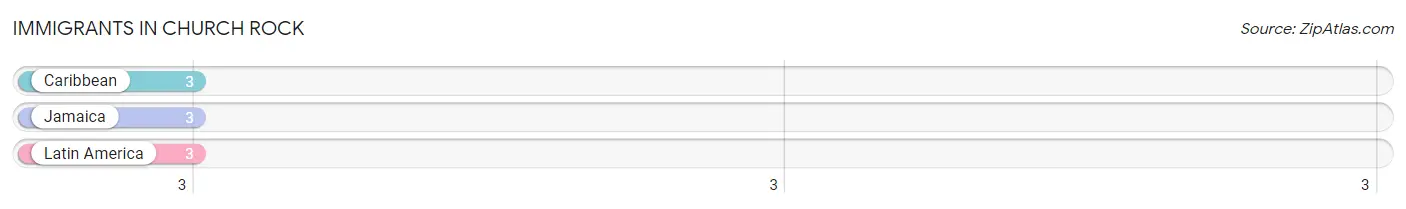
The most numerous immigrant groups reported in Church Rock came from Caribbean (3 | 0.2%), Jamaica (3 | 0.2%), and Latin America (3 | 0.2%), together accounting for 0.7% of all Church Rock residents.
| Immigration Origin | # Population | % Population |
| Caribbean | 3 | 0.2% |
| Jamaica | 3 | 0.2% |
| Latin America | 3 | 0.2% | View All 3 Rows |
Sex and Age in Church Rock
Sex and Age in Church Rock
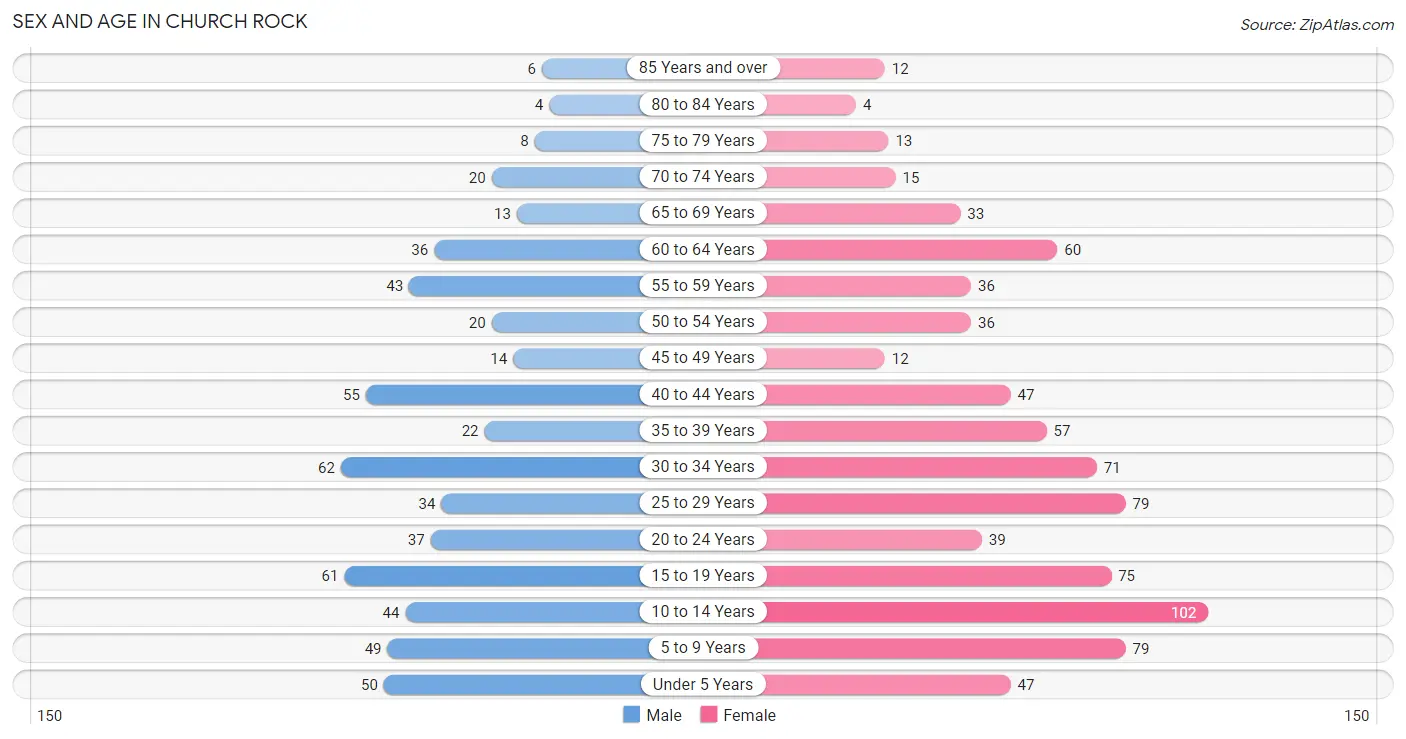
The most populous age groups in Church Rock are 30 to 34 Years (62 | 10.7%) for men and 10 to 14 Years (102 | 12.5%) for women.
| Age Bracket | Male | Female |
| Under 5 Years | 50 (8.6%) | 47 (5.8%) |
| 5 to 9 Years | 49 (8.5%) | 79 (9.7%) |
| 10 to 14 Years | 44 (7.6%) | 102 (12.5%) |
| 15 to 19 Years | 61 (10.5%) | 75 (9.2%) |
| 20 to 24 Years | 37 (6.4%) | 39 (4.8%) |
| 25 to 29 Years | 34 (5.9%) | 79 (9.7%) |
| 30 to 34 Years | 62 (10.7%) | 71 (8.7%) |
| 35 to 39 Years | 22 (3.8%) | 57 (7.0%) |
| 40 to 44 Years | 55 (9.5%) | 47 (5.8%) |
| 45 to 49 Years | 14 (2.4%) | 12 (1.5%) |
| 50 to 54 Years | 20 (3.5%) | 36 (4.4%) |
| 55 to 59 Years | 43 (7.4%) | 36 (4.4%) |
| 60 to 64 Years | 36 (6.2%) | 60 (7.3%) |
| 65 to 69 Years | 13 (2.2%) | 33 (4.0%) |
| 70 to 74 Years | 20 (3.5%) | 15 (1.8%) |
| 75 to 79 Years | 8 (1.4%) | 13 (1.6%) |
| 80 to 84 Years | 4 (0.7%) | 4 (0.5%) |
| 85 Years and over | 6 (1.0%) | 12 (1.5%) |
| Total | 578 (100.0%) | 817 (100.0%) |
Families and Households in Church Rock
Median Family Size in Church Rock
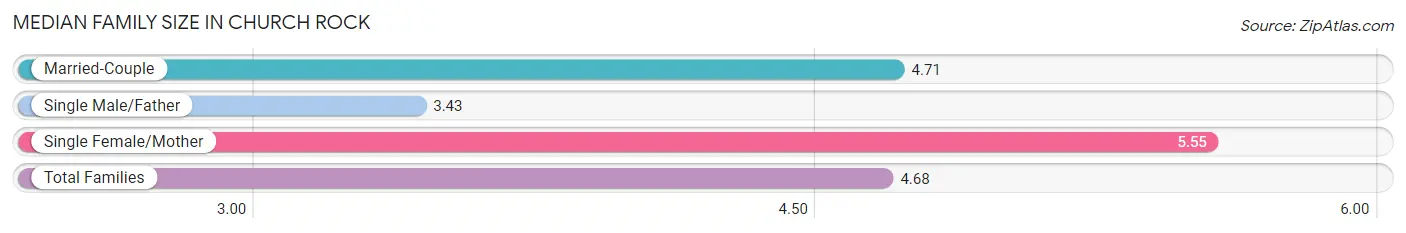
The median family size in Church Rock is 4.68 persons per family, with single female/mother families (98 | 37.6%) accounting for the largest median family size of 5.55 persons per family. On the other hand, single male/father families (70 | 26.8%) represent the smallest median family size with 3.43 persons per family.
| Family Type | # Families | Family Size |
| Married-Couple | 93 (35.6%) | 4.71 |
| Single Male/Father | 70 (26.8%) | 3.43 |
| Single Female/Mother | 98 (37.6%) | 5.55 |
| Total Families | 261 (100.0%) | 4.68 |
Median Household Size in Church Rock
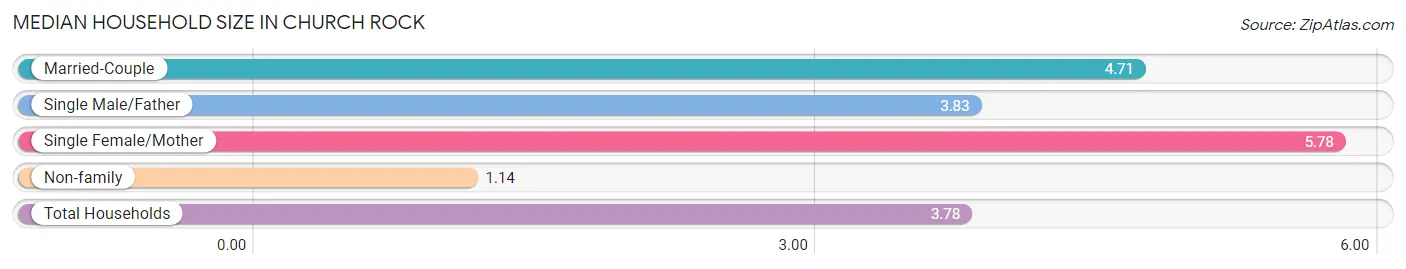
The median household size in Church Rock is 3.78 persons per household, with single female/mother households (98 | 26.6%) accounting for the largest median household size of 5.78 persons per household. non-family households (108 | 29.3%) represent the smallest median household size with 1.14 persons per household.
| Household Type | # Households | Household Size |
| Married-Couple | 93 (25.2%) | 4.71 |
| Single Male/Father | 70 (19.0%) | 3.83 |
| Single Female/Mother | 98 (26.6%) | 5.78 |
| Non-family | 108 (29.3%) | 1.14 |
| Total Households | 369 (100.0%) | 3.78 |
Household Size by Marriage Status in Church Rock
Out of a total of 369 households in Church Rock, 261 (70.7%) are family households, while 108 (29.3%) are nonfamily households. The most numerous type of family households are 5-person households, comprising 55, and the most common type of nonfamily households are 1-person households, comprising 98.
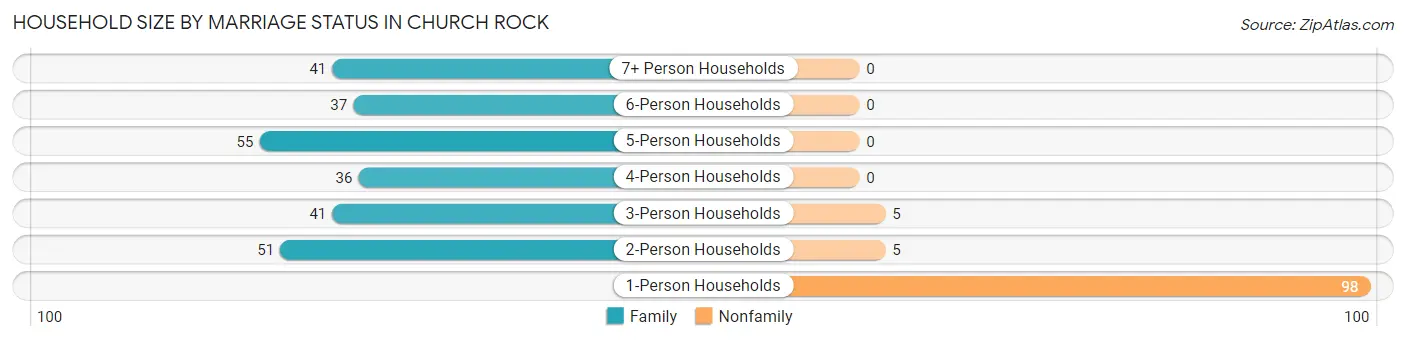
| Household Size | Family Households | Nonfamily Households |
| 1-Person Households | - | 98 (26.6%) |
| 2-Person Households | 51 (13.8%) | 5 (1.4%) |
| 3-Person Households | 41 (11.1%) | 5 (1.4%) |
| 4-Person Households | 36 (9.8%) | 0 (0.0%) |
| 5-Person Households | 55 (14.9%) | 0 (0.0%) |
| 6-Person Households | 37 (10.0%) | 0 (0.0%) |
| 7+ Person Households | 41 (11.1%) | 0 (0.0%) |
| Total | 261 (70.7%) | 108 (29.3%) |
Female Fertility in Church Rock
Fertility by Age in Church Rock
Average fertility rate in Church Rock is 92.0 births per 1,000 women. Women in the age bracket of 20 to 34 years have the highest fertility rate with 196.0 births per 1,000 women. Women in the age bracket of 20 to 34 years acount for 100.0% of all women with births.
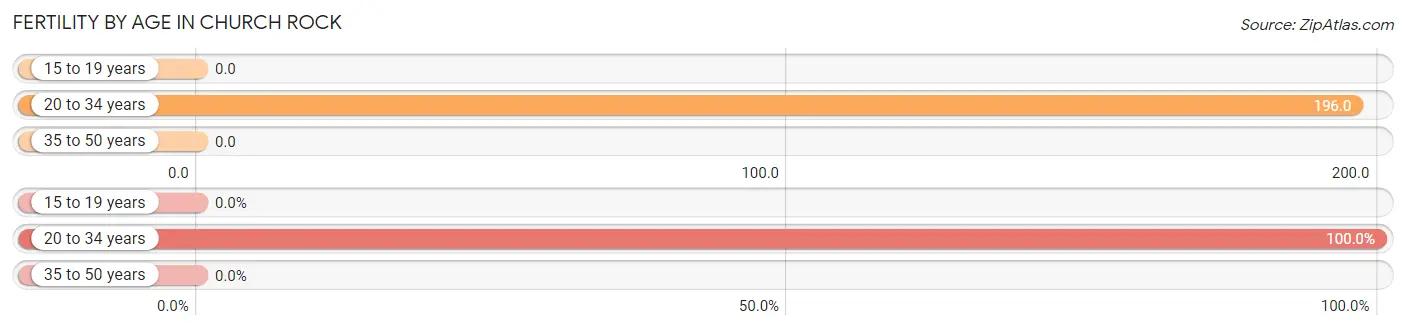
| Age Bracket | Women with Births | Births / 1,000 Women |
| 15 to 19 years | 0 (0.0%) | 0.0 |
| 20 to 34 years | 37 (100.0%) | 196.0 |
| 35 to 50 years | 0 (0.0%) | 0.0 |
| Total | 37 (100.0%) | 92.0 |
Fertility by Age by Marriage Status in Church Rock
29.7% of women with births (37) in Church Rock are married. The highest percentage of unmarried women with births falls into 20 to 34 years age bracket with 70.3% of them unmarried at the time of birth, while the lowest percentage of unmarried women with births belong to 20 to 34 years age bracket with 70.3% of them unmarried.
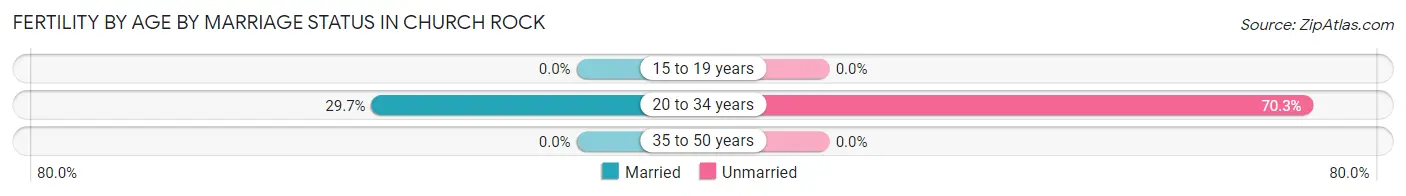
| Age Bracket | Married | Unmarried |
| 15 to 19 years | 0 (0.0%) | 0 (0.0%) |
| 20 to 34 years | 11 (29.7%) | 26 (70.3%) |
| 35 to 50 years | 0 (0.0%) | 0 (0.0%) |
| Total | 11 (29.7%) | 26 (70.3%) |
Fertility by Education in Church Rock
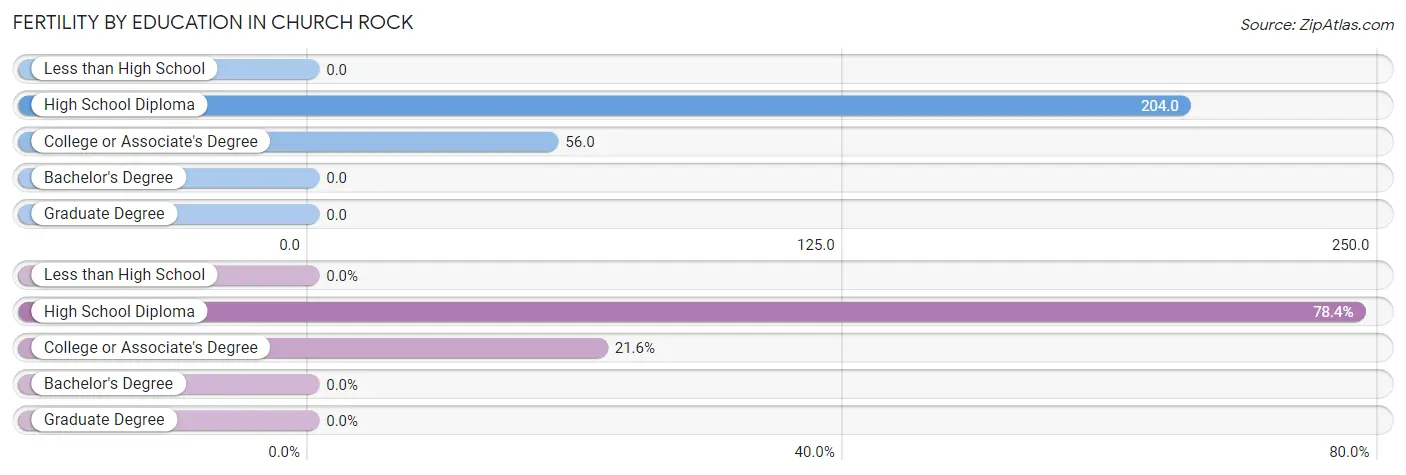
| Educational Attainment | Women with Births | Births / 1,000 Women |
| Less than High School | 0 (0.0%) | 0.0 |
| High School Diploma | 29 (78.4%) | 204.0 |
| College or Associate's Degree | 8 (21.6%) | 56.0 |
| Bachelor's Degree | 0 (0.0%) | 0.0 |
| Graduate Degree | 0 (0.0%) | 0.0 |
| Total | 37 (100.0%) | 92.0 |
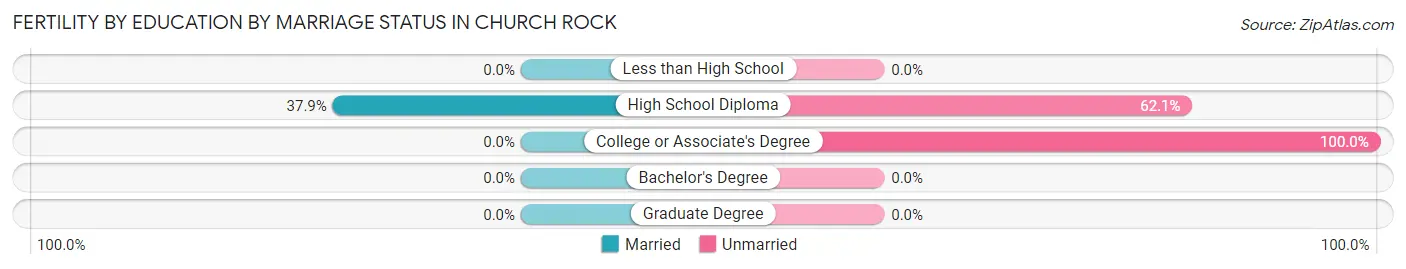
Fertility by Education by Marriage Status in Church Rock
70.3% of women with births in Church Rock are unmarried. Women with the educational attainment of high school diploma are most likely to be married with 37.9% of them married at childbirth, while women with the educational attainment of college or associate's degree are least likely to be married with 100.0% of them unmarried at childbirth.
| Educational Attainment | Married | Unmarried |
| Less than High School | 0 (0.0%) | 0 (0.0%) |
| High School Diploma | 11 (37.9%) | 18 (62.1%) |
| College or Associate's Degree | 0 (0.0%) | 8 (100.0%) |
| Bachelor's Degree | 0 (0.0%) | 0 (0.0%) |
| Graduate Degree | 0 (0.0%) | 0 (0.0%) |
| Total | 11 (29.7%) | 26 (70.3%) |
Employment Characteristics in Church Rock
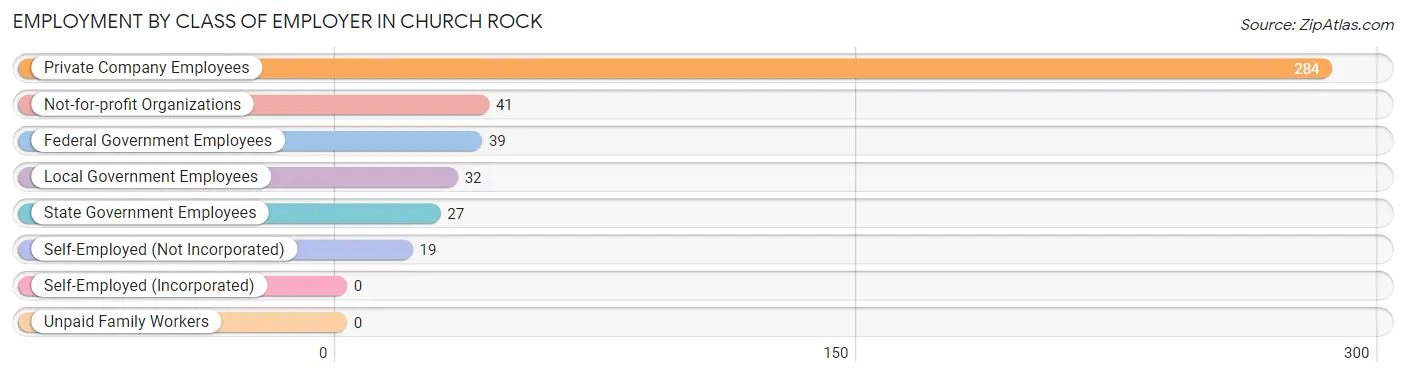
Employment by Class of Employer in Church Rock
Among the 442 employed individuals in Church Rock, private company employees (284 | 64.2%), not-for-profit organizations (41 | 9.3%), and federal government employees (39 | 8.8%) make up the most common classes of employment.
| Employer Class | # Employees | % Employees |
| Private Company Employees | 284 | 64.2% |
| Self-Employed (Incorporated) | 0 | 0.0% |
| Self-Employed (Not Incorporated) | 19 | 4.3% |
| Not-for-profit Organizations | 41 | 9.3% |
| Local Government Employees | 32 | 7.2% |
| State Government Employees | 27 | 6.1% |
| Federal Government Employees | 39 | 8.8% |
| Unpaid Family Workers | 0 | 0.0% |
| Total | 442 | 100.0% |
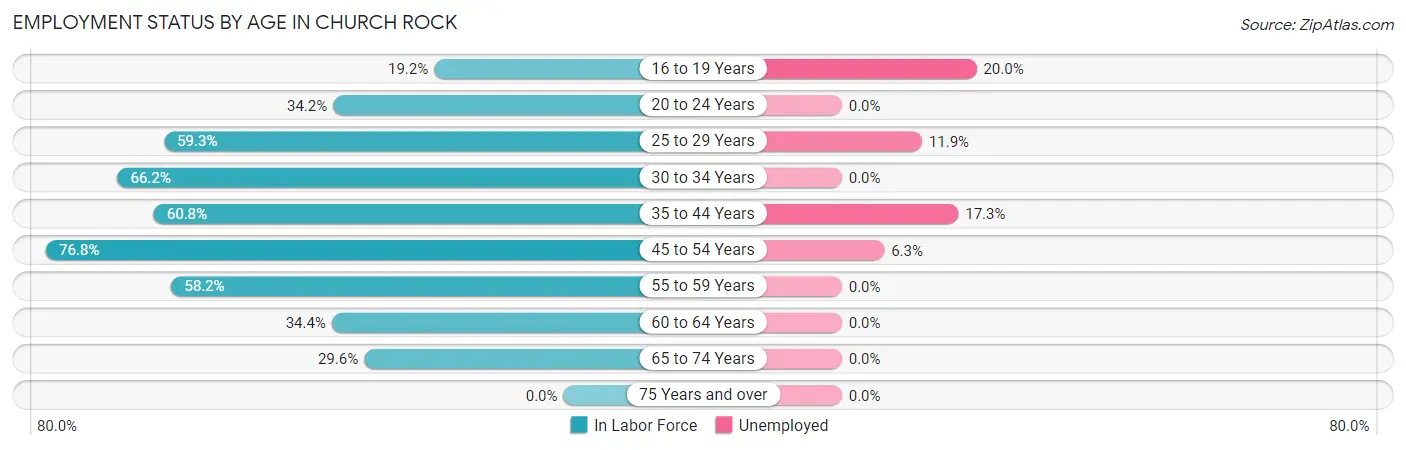
Employment Status by Age in Church Rock
According to the labor force statistics for Church Rock, out of the total population over 16 years of age (992), 48.1% or 477 individuals are in the labor force, with 7.3% or 35 of them unemployed. The age group with the highest labor force participation rate is 45 to 54 years, with 76.8% or 63 individuals in the labor force. Within the labor force, the 16 to 19 years age range has the highest percentage of unemployed individuals, with 20.0% or 4 of them being unemployed.
| Age Bracket | In Labor Force | Unemployed |
| 16 to 19 Years | 20 (19.2%) | 4 (20.0%) |
| 20 to 24 Years | 26 (34.2%) | 0 (0.0%) |
| 25 to 29 Years | 67 (59.3%) | 8 (11.9%) |
| 30 to 34 Years | 88 (66.2%) | 0 (0.0%) |
| 35 to 44 Years | 110 (60.8%) | 19 (17.3%) |
| 45 to 54 Years | 63 (76.8%) | 4 (6.3%) |
| 55 to 59 Years | 46 (58.2%) | 0 (0.0%) |
| 60 to 64 Years | 33 (34.4%) | 0 (0.0%) |
| 65 to 74 Years | 24 (29.6%) | 0 (0.0%) |
| 75 Years and over | 0 (0.0%) | 0 (0.0%) |
| Total | 477 (48.1%) | 35 (7.3%) |
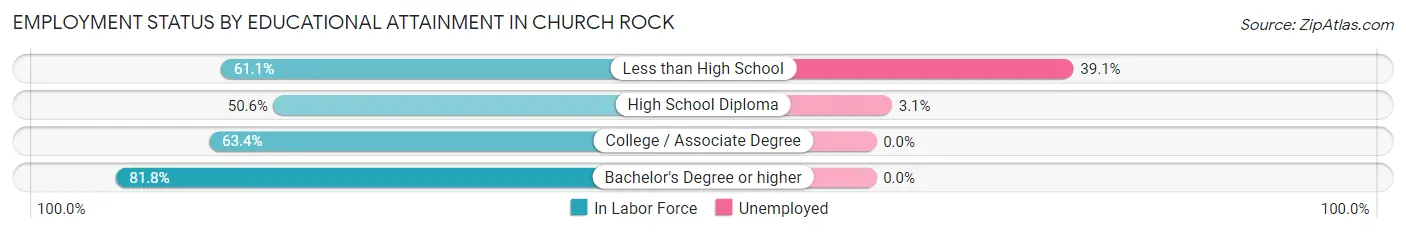
Employment Status by Educational Attainment in Church Rock
According to labor force statistics for Church Rock, 59.5% of individuals (407) out of the total population between 25 and 64 years of age (684) are in the labor force, with 7.6% or 31 of them being unemployed. The group with the highest labor force participation rate are those with the educational attainment of bachelor's degree or higher, with 81.8% or 36 individuals in the labor force. Within the labor force, individuals with less than high school education have the highest percentage of unemployment, with 39.1% or 27 of them being unemployed.
| Educational Attainment | In Labor Force | Unemployed |
| Less than High School | 69 (61.1%) | 44 (39.1%) |
| High School Diploma | 127 (50.6%) | 8 (3.1%) |
| College / Associate Degree | 175 (63.4%) | 0 (0.0%) |
| Bachelor's Degree or higher | 36 (81.8%) | 0 (0.0%) |
| Total | 407 (59.5%) | 52 (7.6%) |
Employment Occupations by Sex in Church Rock
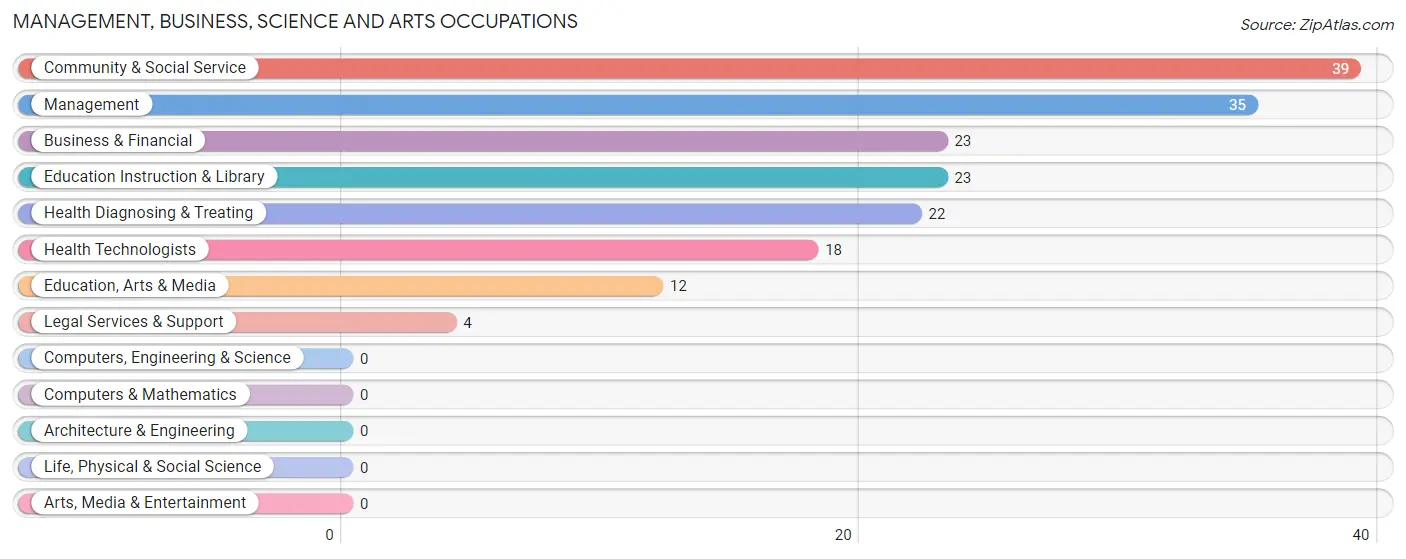
Management, Business, Science and Arts Occupations
The most common Management, Business, Science and Arts occupations in Church Rock are Community & Social Service (39 | 8.8%), Management (35 | 7.9%), Business & Financial (23 | 5.2%), Education Instruction & Library (23 | 5.2%), and Health Diagnosing & Treating (22 | 5.0%).
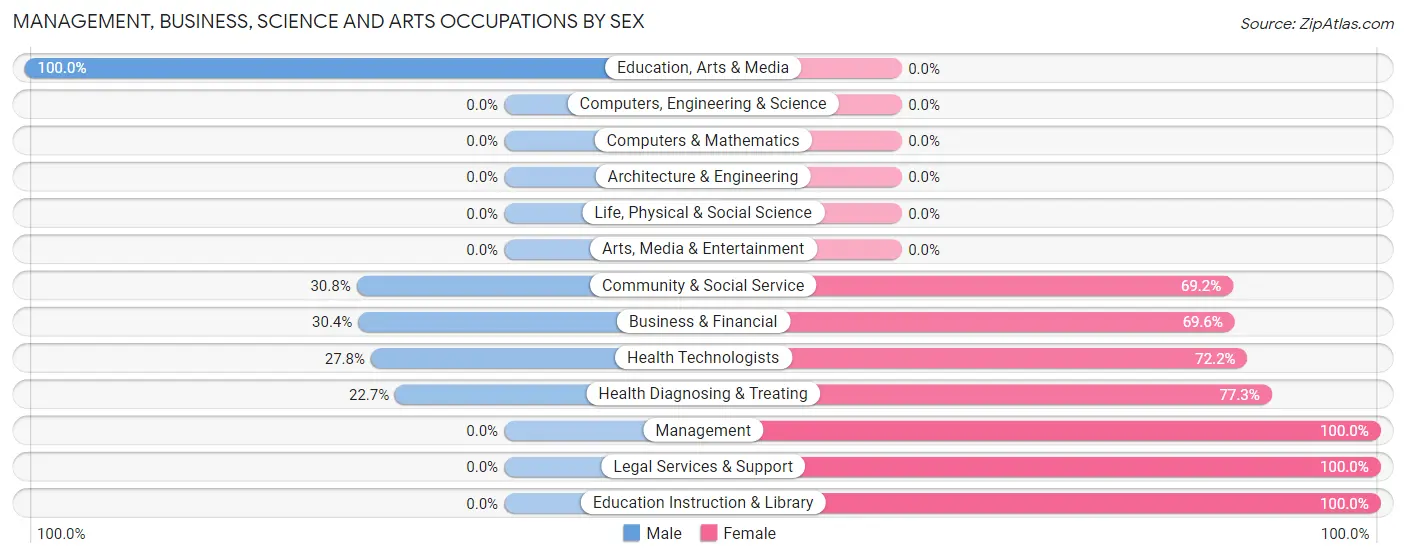
Management, Business, Science and Arts Occupations by Sex
Within the Management, Business, Science and Arts occupations in Church Rock, the most male-oriented occupations are Education, Arts & Media (100.0%), Community & Social Service (30.8%), and Business & Financial (30.4%), while the most female-oriented occupations are Management (100.0%), Legal Services & Support (100.0%), and Education Instruction & Library (100.0%).
| Occupation | Male | Female |
| Management | 0 (0.0%) | 35 (100.0%) |
| Business & Financial | 7 (30.4%) | 16 (69.6%) |
| Computers, Engineering & Science | 0 (0.0%) | 0 (0.0%) |
| Computers & Mathematics | 0 (0.0%) | 0 (0.0%) |
| Architecture & Engineering | 0 (0.0%) | 0 (0.0%) |
| Life, Physical & Social Science | 0 (0.0%) | 0 (0.0%) |
| Community & Social Service | 12 (30.8%) | 27 (69.2%) |
| Education, Arts & Media | 12 (100.0%) | 0 (0.0%) |
| Legal Services & Support | 0 (0.0%) | 4 (100.0%) |
| Education Instruction & Library | 0 (0.0%) | 23 (100.0%) |
| Arts, Media & Entertainment | 0 (0.0%) | 0 (0.0%) |
| Health Diagnosing & Treating | 5 (22.7%) | 17 (77.3%) |
| Health Technologists | 5 (27.8%) | 13 (72.2%) |
| Total (Category) | 24 (20.2%) | 95 (79.8%) |
| Total (Overall) | 197 (44.6%) | 245 (55.4%) |
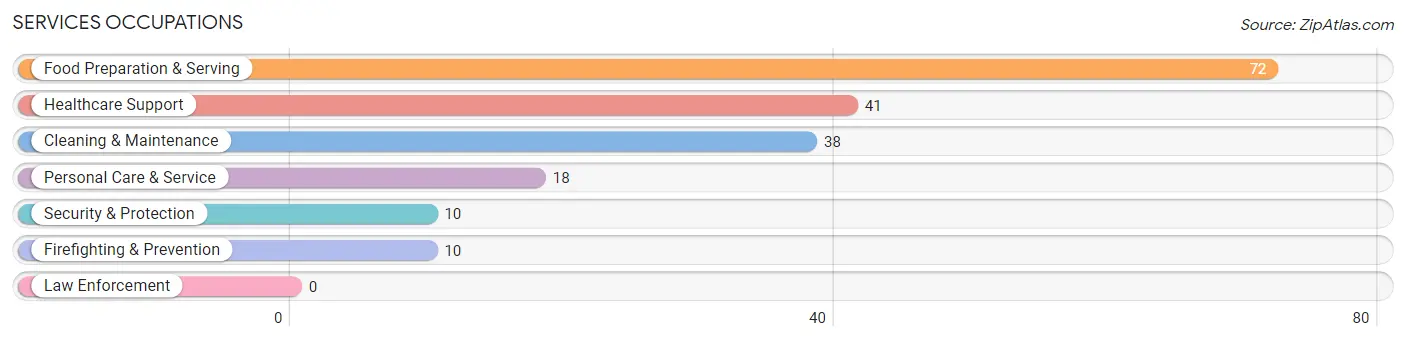
Services Occupations
The most common Services occupations in Church Rock are Food Preparation & Serving (72 | 16.3%), Healthcare Support (41 | 9.3%), Cleaning & Maintenance (38 | 8.6%), Personal Care & Service (18 | 4.1%), and Security & Protection (10 | 2.3%).
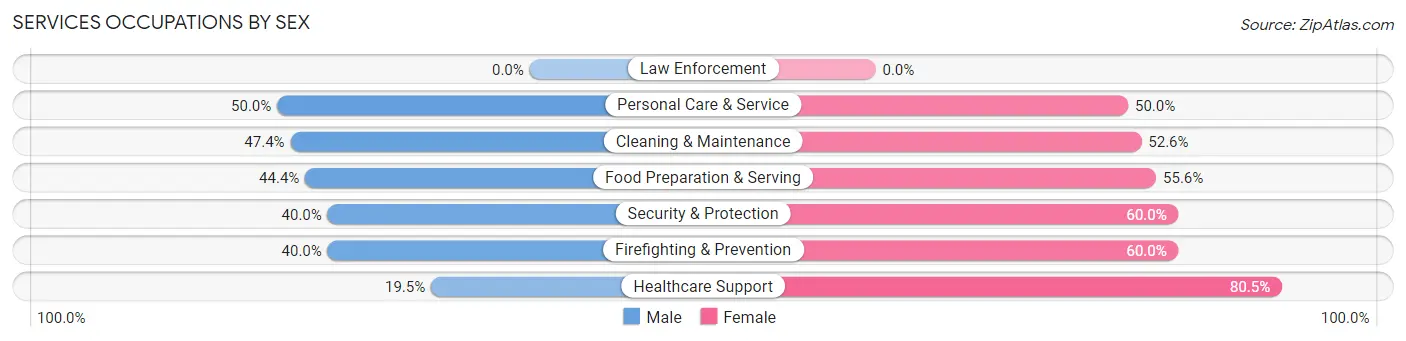
Services Occupations by Sex
Within the Services occupations in Church Rock, the most male-oriented occupations are Personal Care & Service (50.0%), Cleaning & Maintenance (47.4%), and Food Preparation & Serving (44.4%), while the most female-oriented occupations are Healthcare Support (80.5%), Security & Protection (60.0%), and Firefighting & Prevention (60.0%).
| Occupation | Male | Female |
| Healthcare Support | 8 (19.5%) | 33 (80.5%) |
| Security & Protection | 4 (40.0%) | 6 (60.0%) |
| Firefighting & Prevention | 4 (40.0%) | 6 (60.0%) |
| Law Enforcement | 0 (0.0%) | 0 (0.0%) |
| Food Preparation & Serving | 32 (44.4%) | 40 (55.6%) |
| Cleaning & Maintenance | 18 (47.4%) | 20 (52.6%) |
| Personal Care & Service | 9 (50.0%) | 9 (50.0%) |
| Total (Category) | 71 (39.7%) | 108 (60.3%) |
| Total (Overall) | 197 (44.6%) | 245 (55.4%) |
Sales and Office Occupations
The most common Sales and Office occupations in Church Rock are , and Sales & Related (43 | 9.7%).
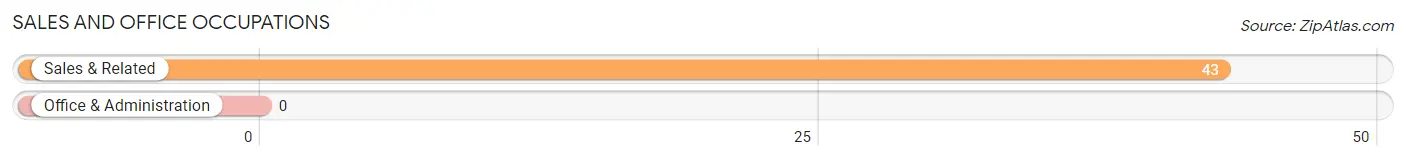
Sales and Office Occupations by Sex
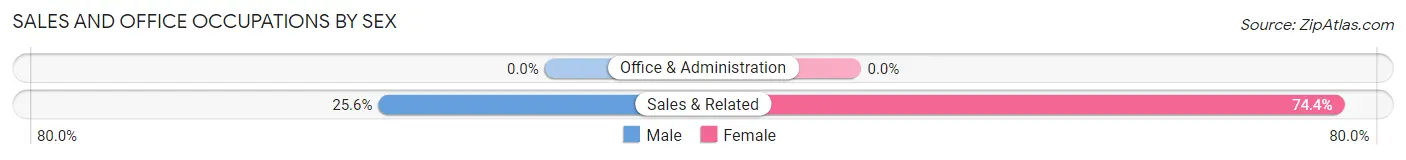
| Occupation | Male | Female |
| Sales & Related | 11 (25.6%) | 32 (74.4%) |
| Office & Administration | 0 (0.0%) | 0 (0.0%) |
| Total (Category) | 11 (25.6%) | 32 (74.4%) |
| Total (Overall) | 197 (44.6%) | 245 (55.4%) |
Natural Resources, Construction and Maintenance Occupations
The most common Natural Resources, Construction and Maintenance occupations in Church Rock are Installation, Maintenance & Repair (44 | 10.0%), and Construction & Extraction (17 | 3.8%).
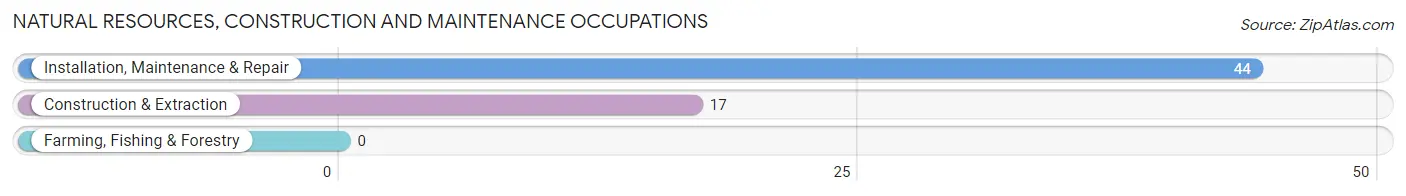
Natural Resources, Construction and Maintenance Occupations by Sex
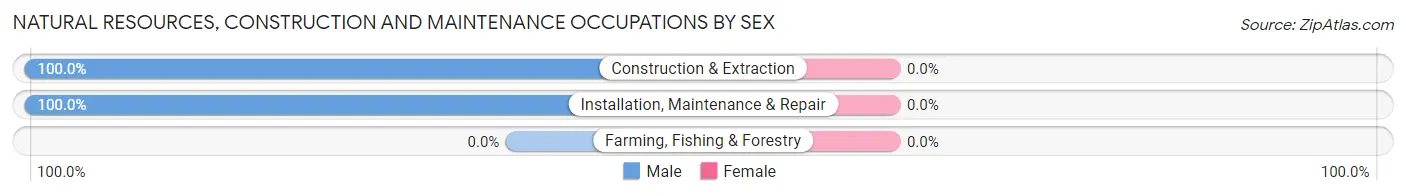
| Occupation | Male | Female |
| Farming, Fishing & Forestry | 0 (0.0%) | 0 (0.0%) |
| Construction & Extraction | 17 (100.0%) | 0 (0.0%) |
| Installation, Maintenance & Repair | 44 (100.0%) | 0 (0.0%) |
| Total (Category) | 61 (100.0%) | 0 (0.0%) |
| Total (Overall) | 197 (44.6%) | 245 (55.4%) |
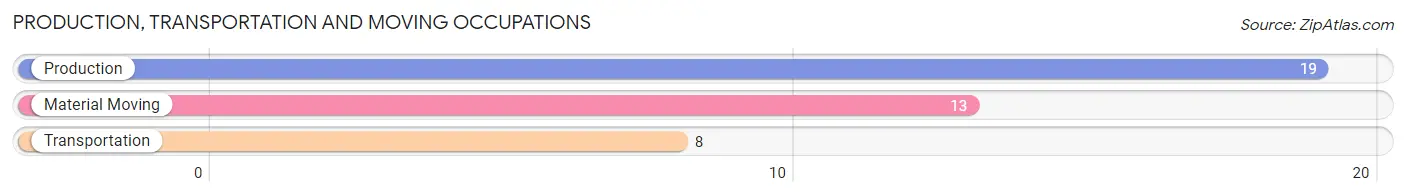
Production, Transportation and Moving Occupations
The most common Production, Transportation and Moving occupations in Church Rock are Production (19 | 4.3%), Material Moving (13 | 2.9%), and Transportation (8 | 1.8%).
Production, Transportation and Moving Occupations by Sex
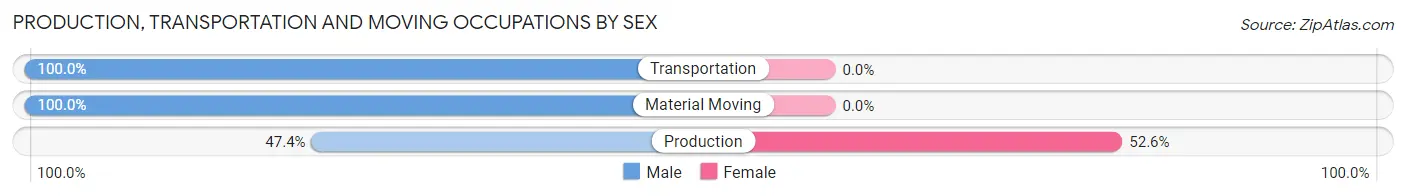
| Occupation | Male | Female |
| Production | 9 (47.4%) | 10 (52.6%) |
| Transportation | 8 (100.0%) | 0 (0.0%) |
| Material Moving | 13 (100.0%) | 0 (0.0%) |
| Total (Category) | 30 (75.0%) | 10 (25.0%) |
| Total (Overall) | 197 (44.6%) | 245 (55.4%) |
Employment Industries by Sex in Church Rock
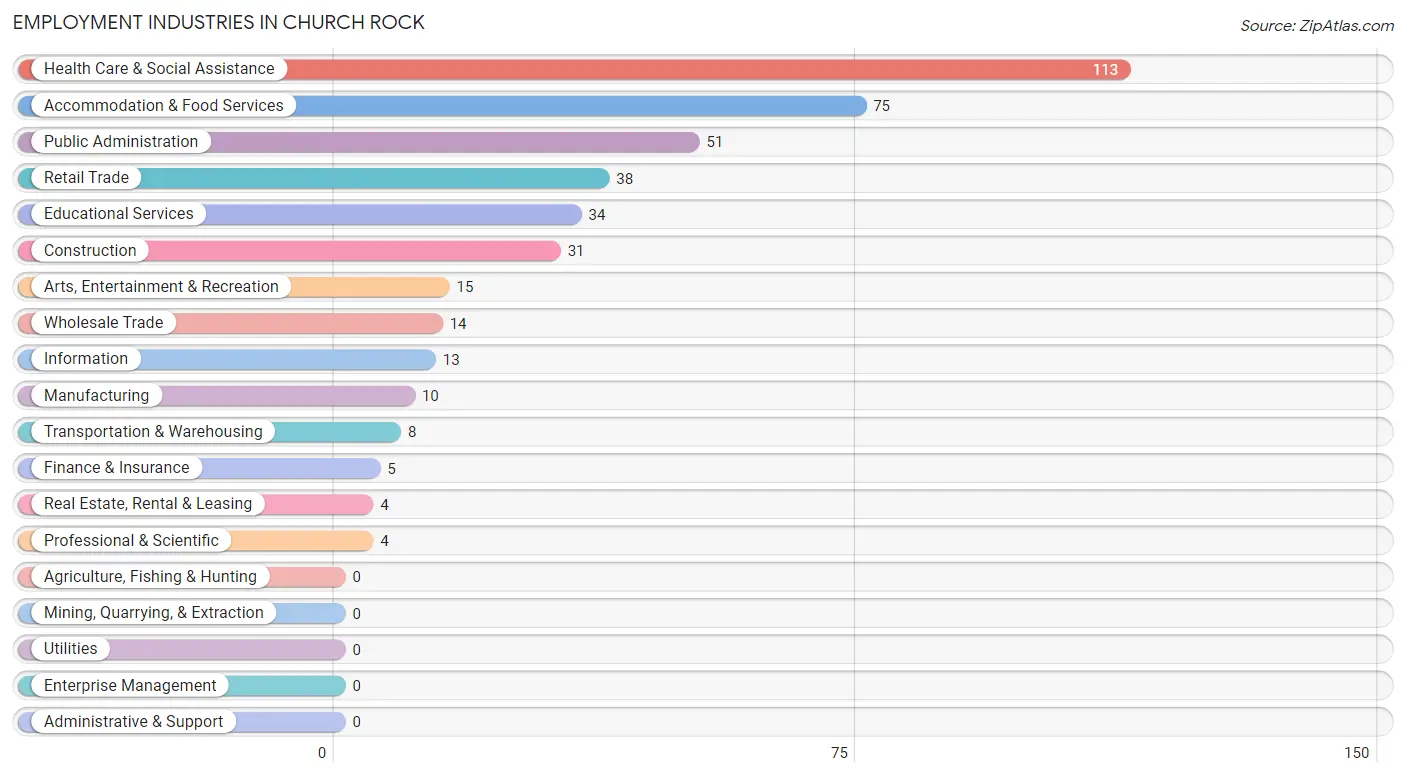
Employment Industries in Church Rock
The major employment industries in Church Rock include Health Care & Social Assistance (113 | 25.6%), Accommodation & Food Services (75 | 17.0%), Public Administration (51 | 11.5%), Retail Trade (38 | 8.6%), and Educational Services (34 | 7.7%).
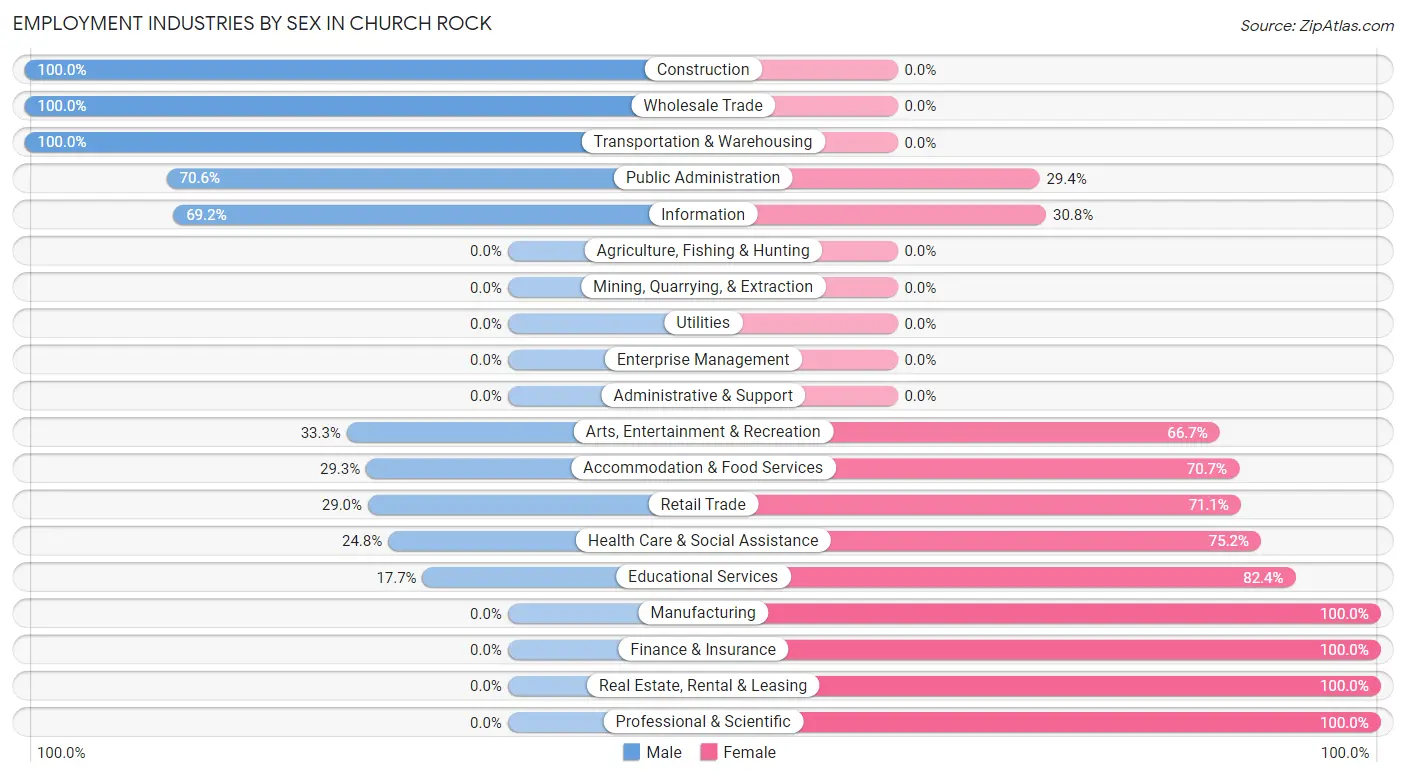
Employment Industries by Sex in Church Rock
The Church Rock industries that see more men than women are Construction (100.0%), Wholesale Trade (100.0%), and Transportation & Warehousing (100.0%), whereas the industries that tend to have a higher number of women are Manufacturing (100.0%), Finance & Insurance (100.0%), and Real Estate, Rental & Leasing (100.0%).
| Industry | Male | Female |
| Agriculture, Fishing & Hunting | 0 (0.0%) | 0 (0.0%) |
| Mining, Quarrying, & Extraction | 0 (0.0%) | 0 (0.0%) |
| Construction | 31 (100.0%) | 0 (0.0%) |
| Manufacturing | 0 (0.0%) | 10 (100.0%) |
| Wholesale Trade | 14 (100.0%) | 0 (0.0%) |
| Retail Trade | 11 (28.9%) | 27 (71.1%) |
| Transportation & Warehousing | 8 (100.0%) | 0 (0.0%) |
| Utilities | 0 (0.0%) | 0 (0.0%) |
| Information | 9 (69.2%) | 4 (30.8%) |
| Finance & Insurance | 0 (0.0%) | 5 (100.0%) |
| Real Estate, Rental & Leasing | 0 (0.0%) | 4 (100.0%) |
| Professional & Scientific | 0 (0.0%) | 4 (100.0%) |
| Enterprise Management | 0 (0.0%) | 0 (0.0%) |
| Administrative & Support | 0 (0.0%) | 0 (0.0%) |
| Educational Services | 6 (17.6%) | 28 (82.4%) |
| Health Care & Social Assistance | 28 (24.8%) | 85 (75.2%) |
| Arts, Entertainment & Recreation | 5 (33.3%) | 10 (66.7%) |
| Accommodation & Food Services | 22 (29.3%) | 53 (70.7%) |
| Public Administration | 36 (70.6%) | 15 (29.4%) |
| Total | 197 (44.6%) | 245 (55.4%) |
Education in Church Rock
School Enrollment in Church Rock
The most common levels of schooling among the 442 students in Church Rock are middle school (110 | 24.9%), high school (104 | 23.5%), and elementary school (75 | 17.0%).
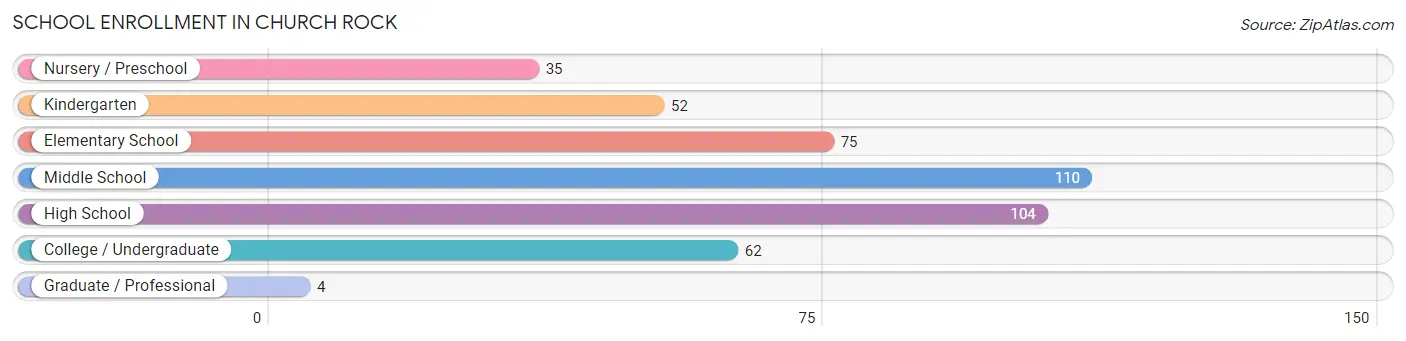
| School Level | # Students | % Students |
| Nursery / Preschool | 35 | 7.9% |
| Kindergarten | 52 | 11.8% |
| Elementary School | 75 | 17.0% |
| Middle School | 110 | 24.9% |
| High School | 104 | 23.5% |
| College / Undergraduate | 62 | 14.0% |
| Graduate / Professional | 4 | 0.9% |
| Total | 442 | 100.0% |
School Enrollment by Age by Funding Source in Church Rock
Out of a total of 442 students who are enrolled in schools in Church Rock, 33 (7.5%) attend a private institution, while the remaining 409 (92.5%) are enrolled in public schools. The age group of 25 to 34 year olds has the highest likelihood of being enrolled in private schools, with 21 (100.0% in the age bracket) enrolled. Conversely, the age group of 3 to 4 year olds has the lowest likelihood of being enrolled in a private school, with 26 (100.0% in the age bracket) attending a public institution.
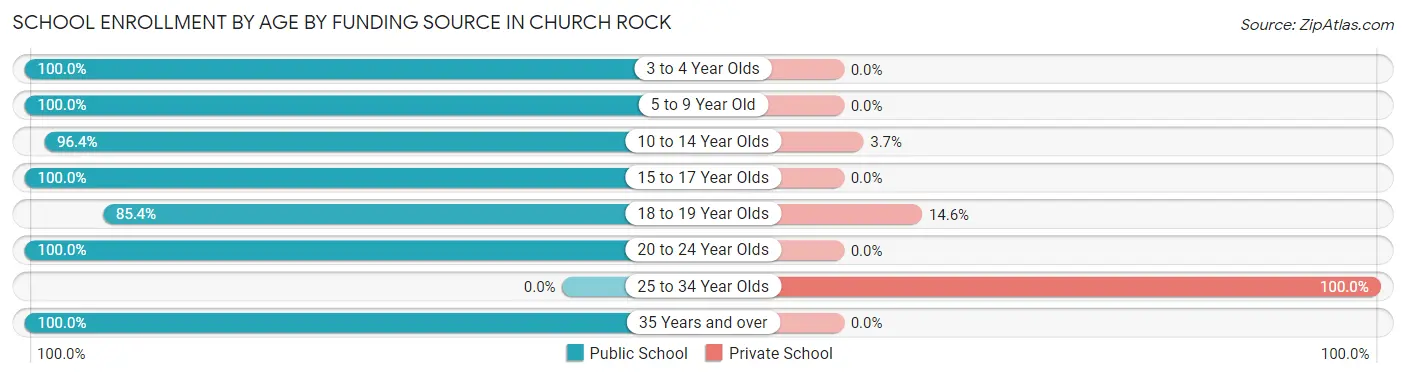
| Age Bracket | Public School | Private School |
| 3 to 4 Year Olds | 26 (100.0%) | 0 (0.0%) |
| 5 to 9 Year Old | 119 (100.0%) | 0 (0.0%) |
| 10 to 14 Year Olds | 132 (96.4%) | 5 (3.6%) |
| 15 to 17 Year Olds | 71 (100.0%) | 0 (0.0%) |
| 18 to 19 Year Olds | 41 (85.4%) | 7 (14.6%) |
| 20 to 24 Year Olds | 7 (100.0%) | 0 (0.0%) |
| 25 to 34 Year Olds | 0 (0.0%) | 21 (100.0%) |
| 35 Years and over | 13 (100.0%) | 0 (0.0%) |
| Total | 409 (92.5%) | 33 (7.5%) |
Educational Attainment by Field of Study in Church Rock
Science & technology (17 | 38.6%), education (11 | 25.0%), business (8 | 18.2%), psychology (4 | 9.1%), and arts & humanities (4 | 9.1%) are the most common fields of study among 44 individuals in Church Rock who have obtained a bachelor's degree or higher.
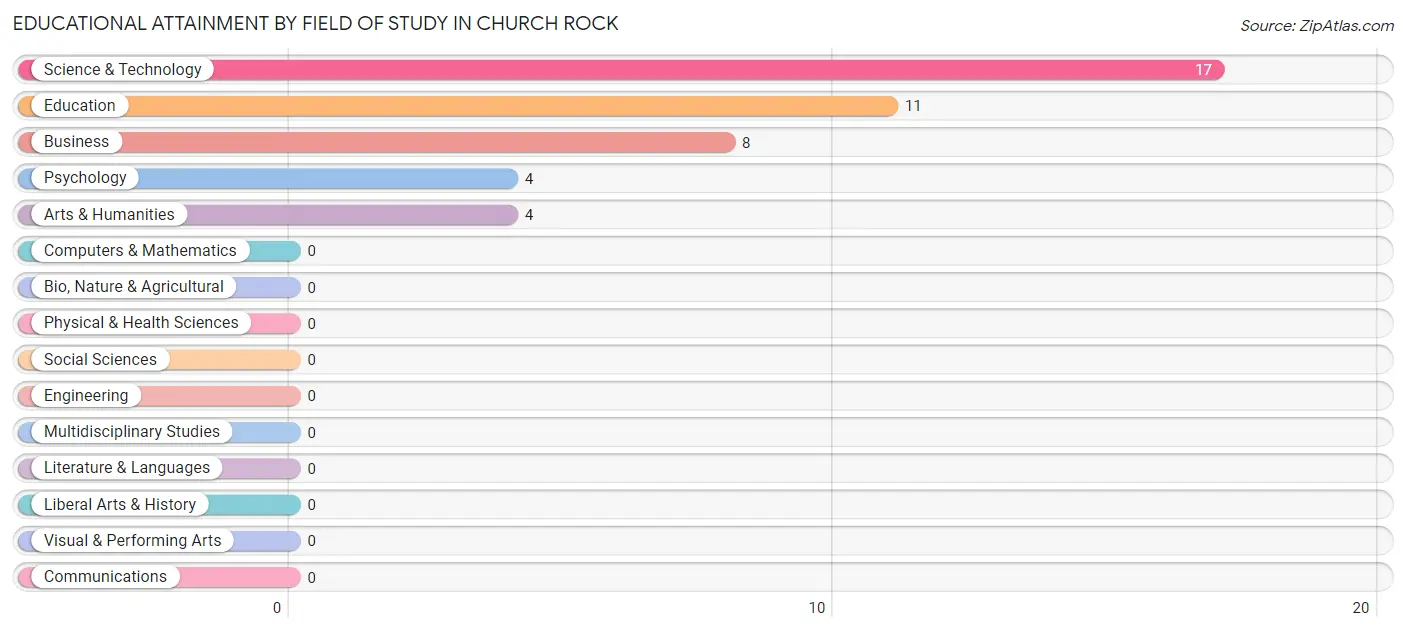
| Field of Study | # Graduates | % Graduates |
| Computers & Mathematics | 0 | 0.0% |
| Bio, Nature & Agricultural | 0 | 0.0% |
| Physical & Health Sciences | 0 | 0.0% |
| Psychology | 4 | 9.1% |
| Social Sciences | 0 | 0.0% |
| Engineering | 0 | 0.0% |
| Multidisciplinary Studies | 0 | 0.0% |
| Science & Technology | 17 | 38.6% |
| Business | 8 | 18.2% |
| Education | 11 | 25.0% |
| Literature & Languages | 0 | 0.0% |
| Liberal Arts & History | 0 | 0.0% |
| Visual & Performing Arts | 0 | 0.0% |
| Communications | 0 | 0.0% |
| Arts & Humanities | 4 | 9.1% |
| Total | 44 | 100.0% |
Transportation & Commute in Church Rock
Vehicle Availability by Sex in Church Rock
The most prevalent vehicle ownership categories in Church Rock are males with 3 vehicles (67, accounting for 34.0%) and females with 3 vehicles (71, making up 27.4%).
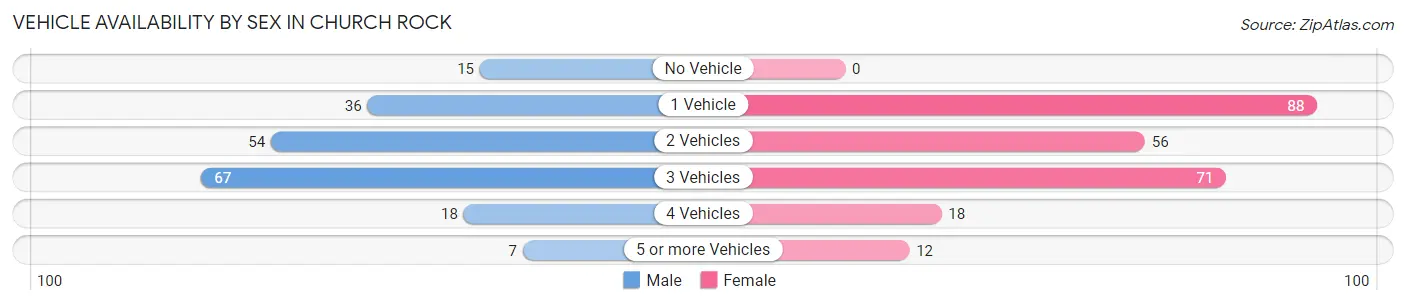
| Vehicles Available | Male | Female |
| No Vehicle | 15 (7.6%) | 0 (0.0%) |
| 1 Vehicle | 36 (18.3%) | 88 (35.9%) |
| 2 Vehicles | 54 (27.4%) | 56 (22.9%) |
| 3 Vehicles | 67 (34.0%) | 71 (29.0%) |
| 4 Vehicles | 18 (9.1%) | 18 (7.3%) |
| 5 or more Vehicles | 7 (3.5%) | 12 (4.9%) |
| Total | 197 (100.0%) | 245 (100.0%) |
Commute Time in Church Rock
The most frequently occuring commute durations in Church Rock are 30 to 34 minutes (101 commuters, 24.3%), 10 to 14 minutes (72 commuters, 17.3%), and 20 to 24 minutes (68 commuters, 16.4%).
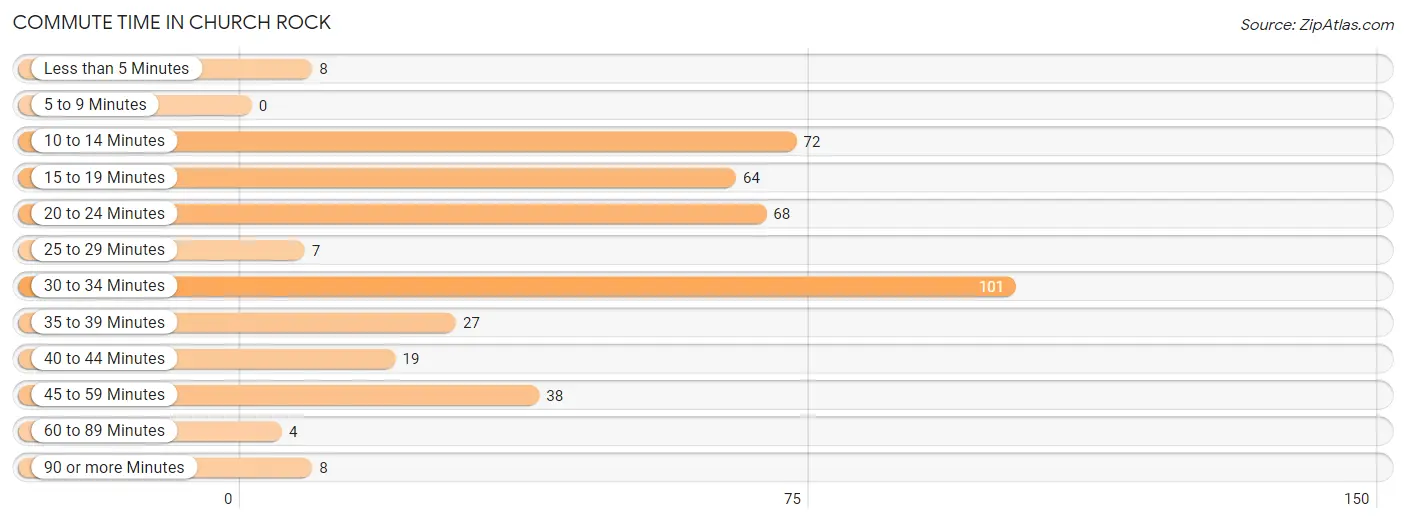
| Commute Time | # Commuters | % Commuters |
| Less than 5 Minutes | 8 | 1.9% |
| 5 to 9 Minutes | 0 | 0.0% |
| 10 to 14 Minutes | 72 | 17.3% |
| 15 to 19 Minutes | 64 | 15.4% |
| 20 to 24 Minutes | 68 | 16.4% |
| 25 to 29 Minutes | 7 | 1.7% |
| 30 to 34 Minutes | 101 | 24.3% |
| 35 to 39 Minutes | 27 | 6.5% |
| 40 to 44 Minutes | 19 | 4.6% |
| 45 to 59 Minutes | 38 | 9.1% |
| 60 to 89 Minutes | 4 | 1.0% |
| 90 or more Minutes | 8 | 1.9% |
Commute Time by Sex in Church Rock
The most common commute times in Church Rock are 10 to 14 minutes (57 commuters, 31.3%) for males and 30 to 34 minutes (66 commuters, 28.2%) for females.
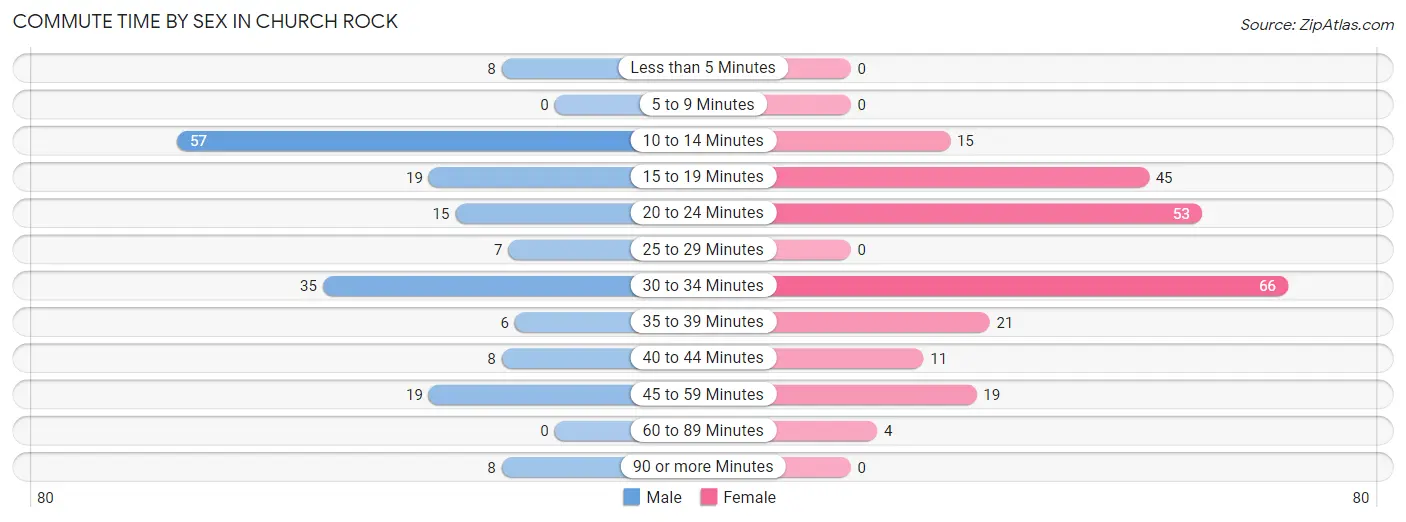
| Commute Time | Male | Female |
| Less than 5 Minutes | 8 (4.4%) | 0 (0.0%) |
| 5 to 9 Minutes | 0 (0.0%) | 0 (0.0%) |
| 10 to 14 Minutes | 57 (31.3%) | 15 (6.4%) |
| 15 to 19 Minutes | 19 (10.4%) | 45 (19.2%) |
| 20 to 24 Minutes | 15 (8.2%) | 53 (22.7%) |
| 25 to 29 Minutes | 7 (3.8%) | 0 (0.0%) |
| 30 to 34 Minutes | 35 (19.2%) | 66 (28.2%) |
| 35 to 39 Minutes | 6 (3.3%) | 21 (9.0%) |
| 40 to 44 Minutes | 8 (4.4%) | 11 (4.7%) |
| 45 to 59 Minutes | 19 (10.4%) | 19 (8.1%) |
| 60 to 89 Minutes | 0 (0.0%) | 4 (1.7%) |
| 90 or more Minutes | 8 (4.4%) | 0 (0.0%) |
Time of Departure to Work by Sex in Church Rock
The most frequent times of departure to work in Church Rock are 7:00 AM to 7:29 AM (73, 40.1%) for males and 7:00 AM to 7:29 AM (34, 14.5%) for females.
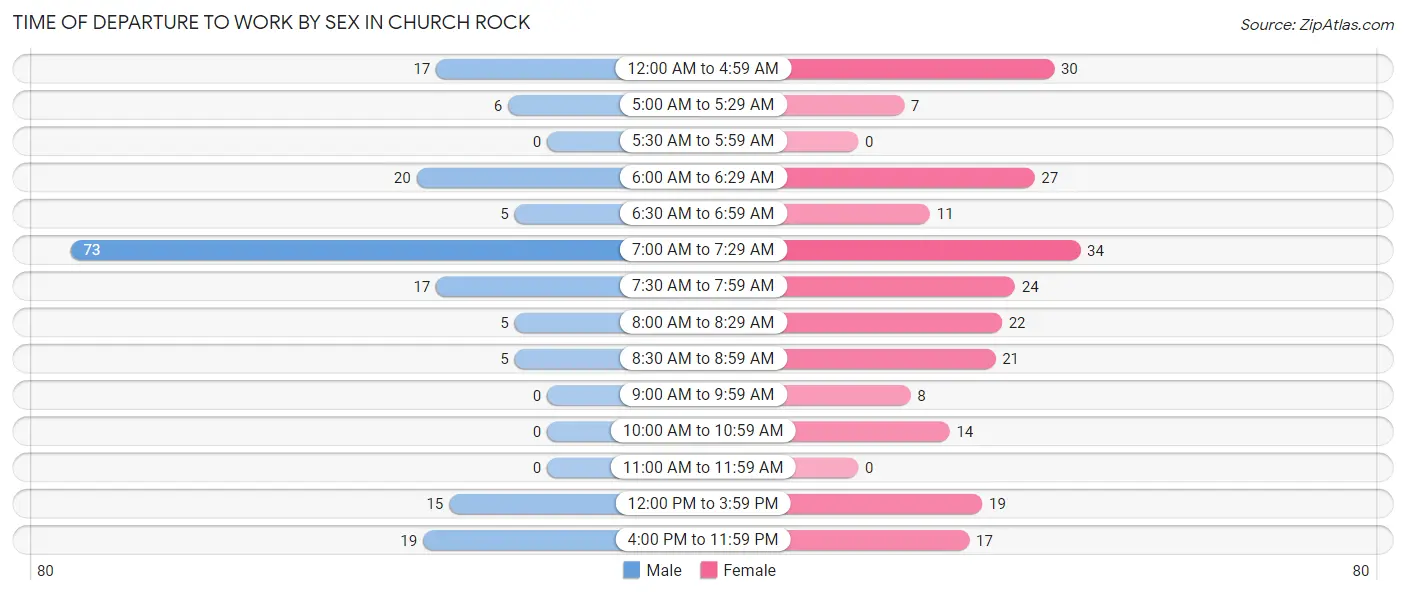
| Time of Departure | Male | Female |
| 12:00 AM to 4:59 AM | 17 (9.3%) | 30 (12.8%) |
| 5:00 AM to 5:29 AM | 6 (3.3%) | 7 (3.0%) |
| 5:30 AM to 5:59 AM | 0 (0.0%) | 0 (0.0%) |
| 6:00 AM to 6:29 AM | 20 (11.0%) | 27 (11.5%) |
| 6:30 AM to 6:59 AM | 5 (2.8%) | 11 (4.7%) |
| 7:00 AM to 7:29 AM | 73 (40.1%) | 34 (14.5%) |
| 7:30 AM to 7:59 AM | 17 (9.3%) | 24 (10.3%) |
| 8:00 AM to 8:29 AM | 5 (2.8%) | 22 (9.4%) |
| 8:30 AM to 8:59 AM | 5 (2.8%) | 21 (9.0%) |
| 9:00 AM to 9:59 AM | 0 (0.0%) | 8 (3.4%) |
| 10:00 AM to 10:59 AM | 0 (0.0%) | 14 (6.0%) |
| 11:00 AM to 11:59 AM | 0 (0.0%) | 0 (0.0%) |
| 12:00 PM to 3:59 PM | 15 (8.2%) | 19 (8.1%) |
| 4:00 PM to 11:59 PM | 19 (10.4%) | 17 (7.3%) |
| Total | 182 (100.0%) | 234 (100.0%) |
Housing Occupancy in Church Rock
Occupancy by Ownership in Church Rock
Of the total 369 dwellings in Church Rock, owner-occupied units account for 232 (62.9%), while renter-occupied units make up 137 (37.1%).
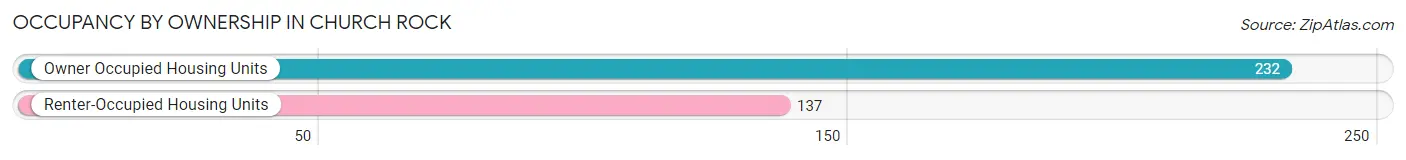
| Occupancy | # Housing Units | % Housing Units |
| Owner Occupied Housing Units | 232 | 62.9% |
| Renter-Occupied Housing Units | 137 | 37.1% |
| Total Occupied Housing Units | 369 | 100.0% |
Occupancy by Household Size in Church Rock
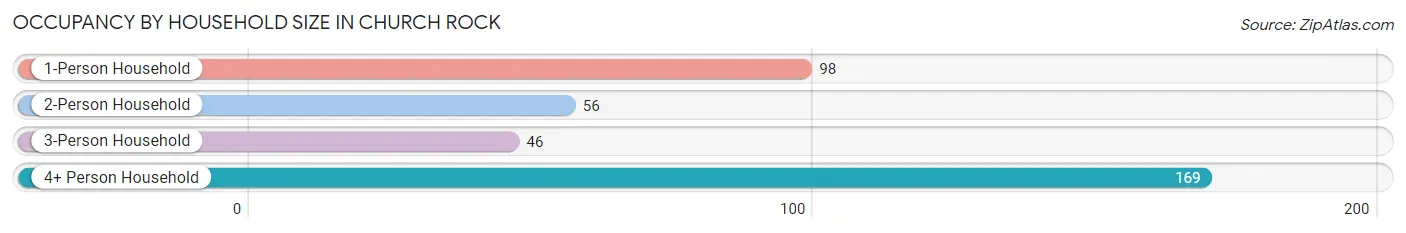
| Household Size | # Housing Units | % Housing Units |
| 1-Person Household | 98 | 26.6% |
| 2-Person Household | 56 | 15.2% |
| 3-Person Household | 46 | 12.5% |
| 4+ Person Household | 169 | 45.8% |
| Total Housing Units | 369 | 100.0% |
Occupancy by Ownership by Household Size in Church Rock
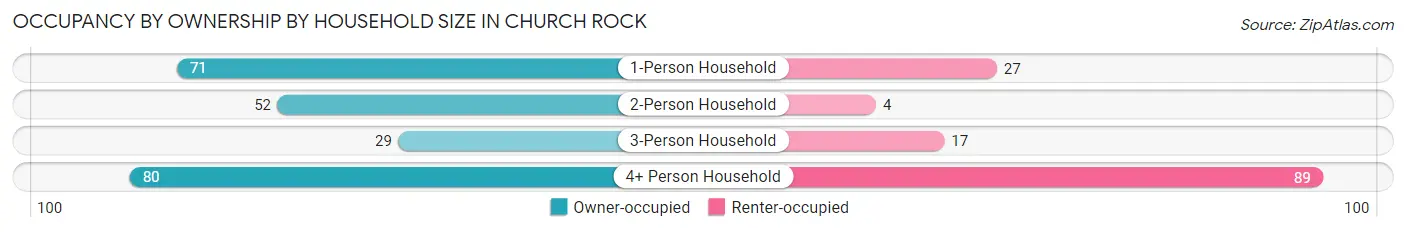
| Household Size | Owner-occupied | Renter-occupied |
| 1-Person Household | 71 (72.5%) | 27 (27.6%) |
| 2-Person Household | 52 (92.9%) | 4 (7.1%) |
| 3-Person Household | 29 (63.0%) | 17 (37.0%) |
| 4+ Person Household | 80 (47.3%) | 89 (52.7%) |
| Total Housing Units | 232 (62.9%) | 137 (37.1%) |
Occupancy by Educational Attainment in Church Rock
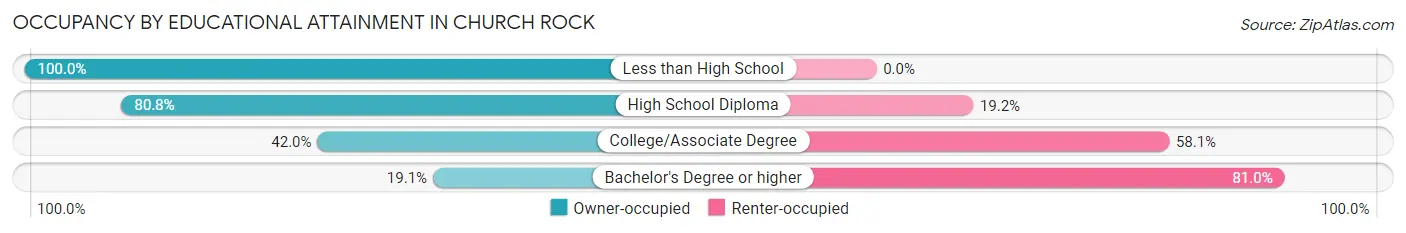
| Household Size | Owner-occupied | Renter-occupied |
| Less than High School | 75 (100.0%) | 0 (0.0%) |
| High School Diploma | 80 (80.8%) | 19 (19.2%) |
| College/Associate Degree | 73 (41.9%) | 101 (58.1%) |
| Bachelor's Degree or higher | 4 (19.1%) | 17 (80.9%) |
Occupancy by Age of Householder in Church Rock
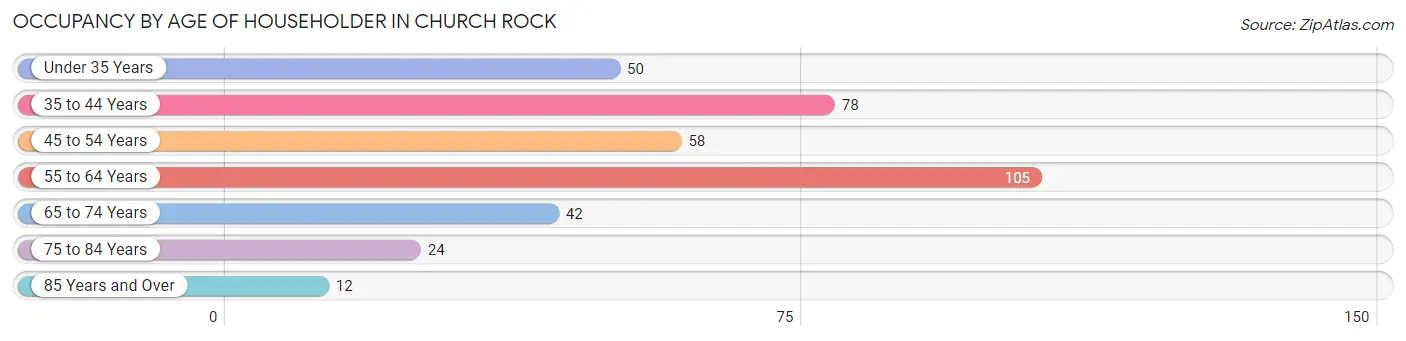
| Age Bracket | # Households | % Households |
| Under 35 Years | 50 | 13.6% |
| 35 to 44 Years | 78 | 21.1% |
| 45 to 54 Years | 58 | 15.7% |
| 55 to 64 Years | 105 | 28.5% |
| 65 to 74 Years | 42 | 11.4% |
| 75 to 84 Years | 24 | 6.5% |
| 85 Years and Over | 12 | 3.3% |
| Total | 369 | 100.0% |
Housing Finances in Church Rock
Median Income by Occupancy in Church Rock
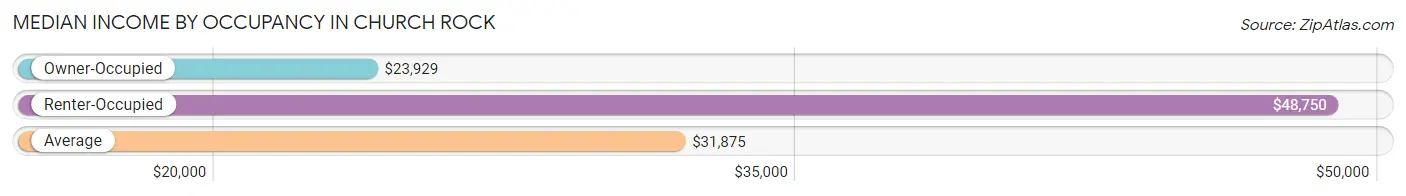
| Occupancy Type | # Households | Median Income |
| Owner-Occupied | 232 (62.9%) | $23,929 |
| Renter-Occupied | 137 (37.1%) | $48,750 |
| Average | 369 (100.0%) | $31,875 |
Occupancy by Householder Income Bracket in Church Rock
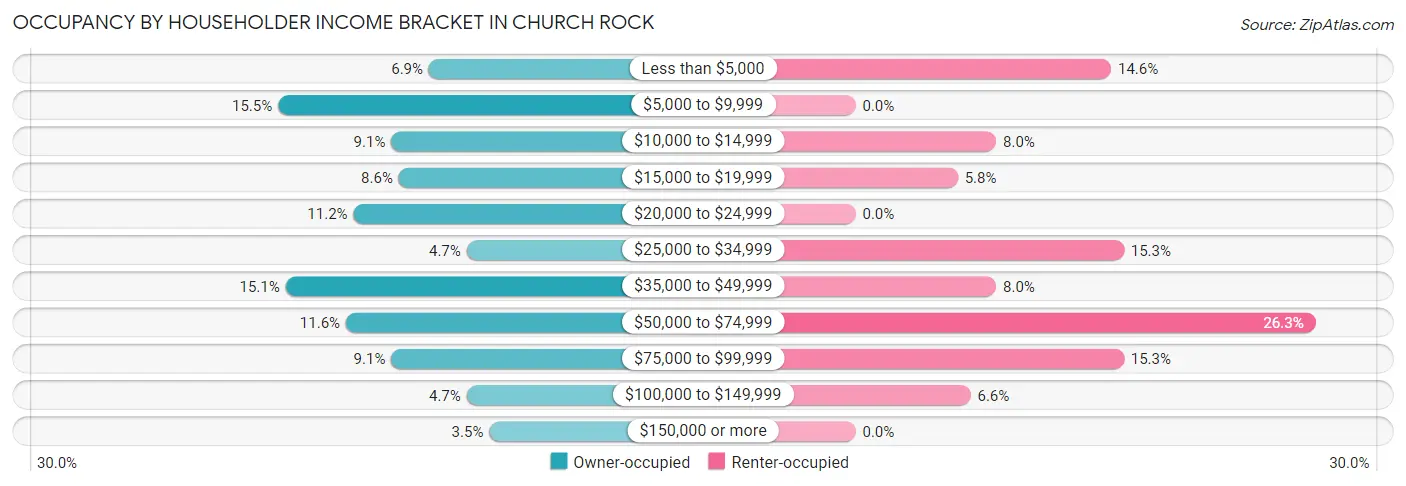
| Income Bracket | Owner-occupied | Renter-occupied |
| Less than $5,000 | 16 (6.9%) | 20 (14.6%) |
| $5,000 to $9,999 | 36 (15.5%) | 0 (0.0%) |
| $10,000 to $14,999 | 21 (9.0%) | 11 (8.0%) |
| $15,000 to $19,999 | 20 (8.6%) | 8 (5.8%) |
| $20,000 to $24,999 | 26 (11.2%) | 0 (0.0%) |
| $25,000 to $34,999 | 11 (4.7%) | 21 (15.3%) |
| $35,000 to $49,999 | 35 (15.1%) | 11 (8.0%) |
| $50,000 to $74,999 | 27 (11.6%) | 36 (26.3%) |
| $75,000 to $99,999 | 21 (9.0%) | 21 (15.3%) |
| $100,000 to $149,999 | 11 (4.7%) | 9 (6.6%) |
| $150,000 or more | 8 (3.5%) | 0 (0.0%) |
| Total | 232 (100.0%) | 137 (100.0%) |
Monthly Housing Cost Tiers in Church Rock
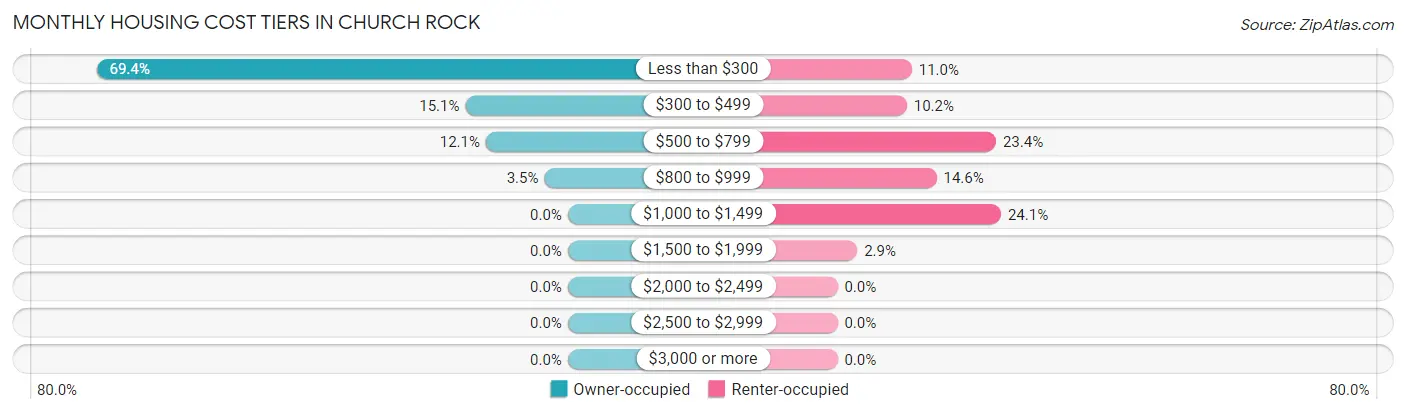
| Monthly Cost | Owner-occupied | Renter-occupied |
| Less than $300 | 161 (69.4%) | 15 (11.0%) |
| $300 to $499 | 35 (15.1%) | 14 (10.2%) |
| $500 to $799 | 28 (12.1%) | 32 (23.4%) |
| $800 to $999 | 8 (3.5%) | 20 (14.6%) |
| $1,000 to $1,499 | 0 (0.0%) | 33 (24.1%) |
| $1,500 to $1,999 | 0 (0.0%) | 4 (2.9%) |
| $2,000 to $2,499 | 0 (0.0%) | 0 (0.0%) |
| $2,500 to $2,999 | 0 (0.0%) | 0 (0.0%) |
| $3,000 or more | 0 (0.0%) | 0 (0.0%) |
| Total | 232 (100.0%) | 137 (100.0%) |
Physical Housing Characteristics in Church Rock
Housing Structures in Church Rock
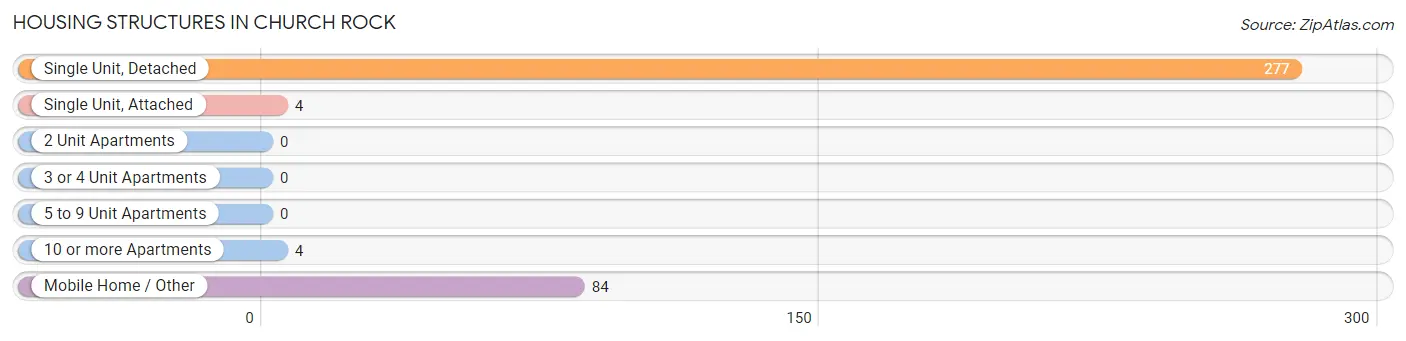
| Structure Type | # Housing Units | % Housing Units |
| Single Unit, Detached | 277 | 75.1% |
| Single Unit, Attached | 4 | 1.1% |
| 2 Unit Apartments | 0 | 0.0% |
| 3 or 4 Unit Apartments | 0 | 0.0% |
| 5 to 9 Unit Apartments | 0 | 0.0% |
| 10 or more Apartments | 4 | 1.1% |
| Mobile Home / Other | 84 | 22.8% |
| Total | 369 | 100.0% |
Housing Structures by Occupancy in Church Rock
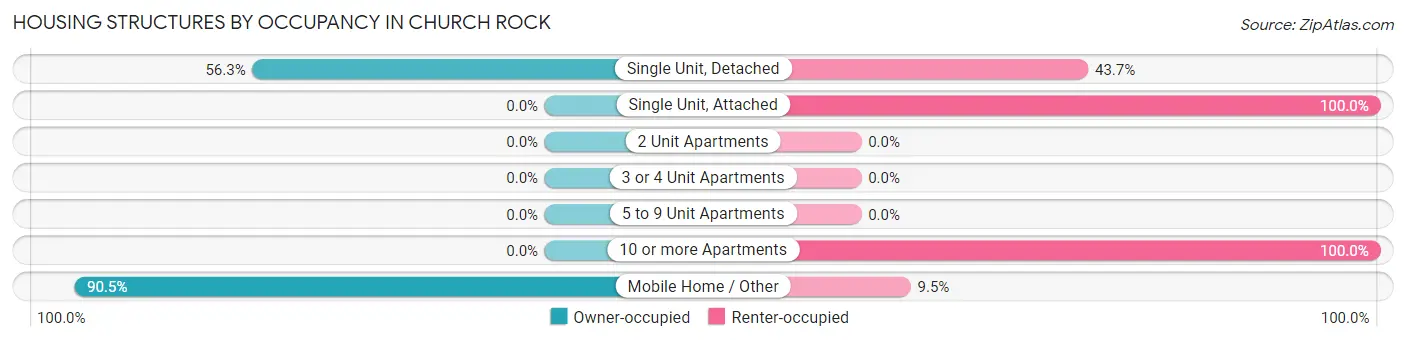
| Structure Type | Owner-occupied | Renter-occupied |
| Single Unit, Detached | 156 (56.3%) | 121 (43.7%) |
| Single Unit, Attached | 0 (0.0%) | 4 (100.0%) |
| 2 Unit Apartments | 0 (0.0%) | 0 (0.0%) |
| 3 or 4 Unit Apartments | 0 (0.0%) | 0 (0.0%) |
| 5 to 9 Unit Apartments | 0 (0.0%) | 0 (0.0%) |
| 10 or more Apartments | 0 (0.0%) | 4 (100.0%) |
| Mobile Home / Other | 76 (90.5%) | 8 (9.5%) |
| Total | 232 (62.9%) | 137 (37.1%) |
Housing Structures by Number of Rooms in Church Rock
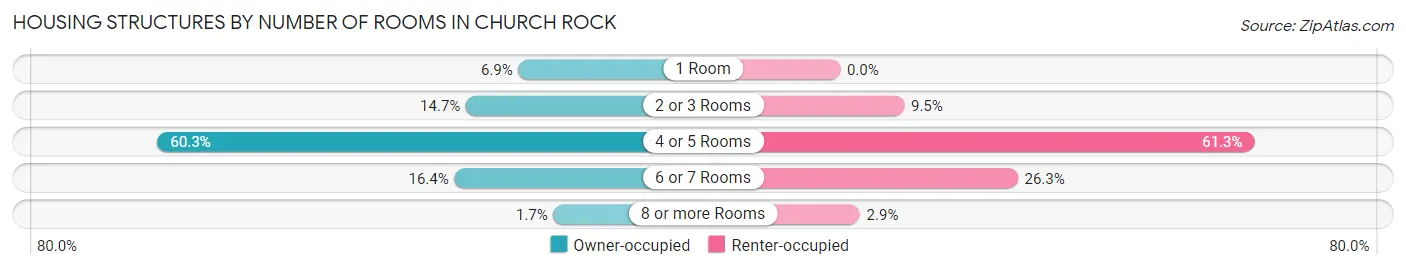
| Number of Rooms | Owner-occupied | Renter-occupied |
| 1 Room | 16 (6.9%) | 0 (0.0%) |
| 2 or 3 Rooms | 34 (14.7%) | 13 (9.5%) |
| 4 or 5 Rooms | 140 (60.3%) | 84 (61.3%) |
| 6 or 7 Rooms | 38 (16.4%) | 36 (26.3%) |
| 8 or more Rooms | 4 (1.7%) | 4 (2.9%) |
| Total | 232 (100.0%) | 137 (100.0%) |
Housing Structure by Heating Type in Church Rock
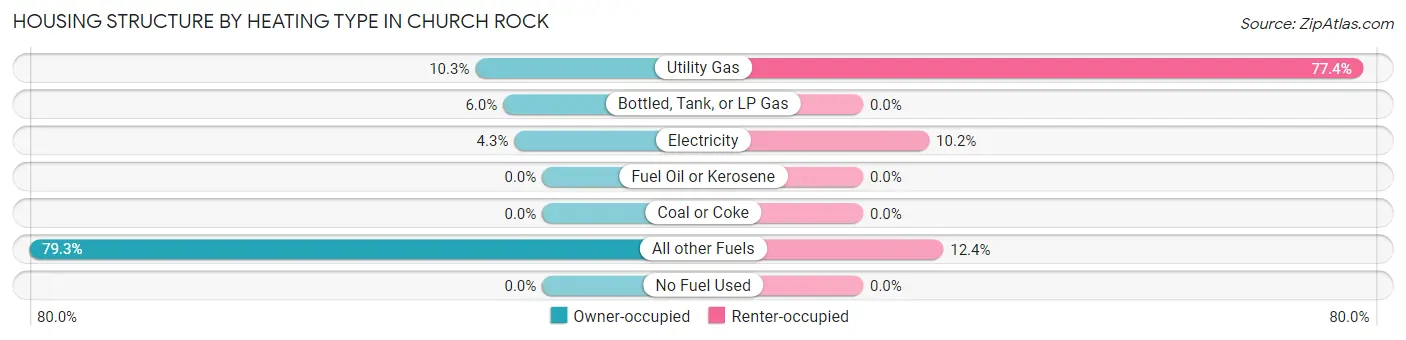
| Heating Type | Owner-occupied | Renter-occupied |
| Utility Gas | 24 (10.3%) | 106 (77.4%) |
| Bottled, Tank, or LP Gas | 14 (6.0%) | 0 (0.0%) |
| Electricity | 10 (4.3%) | 14 (10.2%) |
| Fuel Oil or Kerosene | 0 (0.0%) | 0 (0.0%) |
| Coal or Coke | 0 (0.0%) | 0 (0.0%) |
| All other Fuels | 184 (79.3%) | 17 (12.4%) |
| No Fuel Used | 0 (0.0%) | 0 (0.0%) |
| Total | 232 (100.0%) | 137 (100.0%) |
Household Vehicle Usage in Church Rock
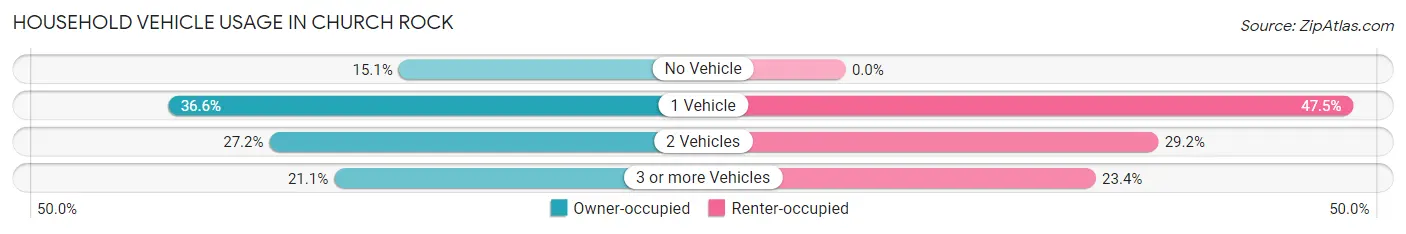
| Vehicles per Household | Owner-occupied | Renter-occupied |
| No Vehicle | 35 (15.1%) | 0 (0.0%) |
| 1 Vehicle | 85 (36.6%) | 65 (47.4%) |
| 2 Vehicles | 63 (27.2%) | 40 (29.2%) |
| 3 or more Vehicles | 49 (21.1%) | 32 (23.4%) |
| Total | 232 (100.0%) | 137 (100.0%) |
Real Estate & Mortgages in Church Rock
Real Estate and Mortgage Overview in Church Rock
| Characteristic | Without Mortgage | With Mortgage |
| Housing Units | 220 | 12 |
| Median Property Value | $33,300 | $137,500 |
| Median Household Income | $22,237 | $8 |
| Monthly Housing Costs | $193 | $0 |
| Real Estate Taxes | - | - |
Property Value by Mortgage Status in Church Rock
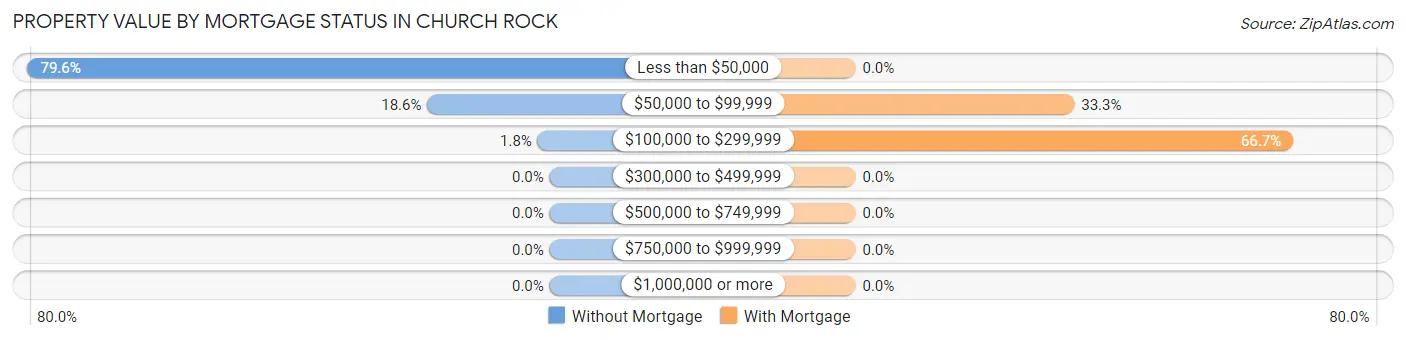
| Property Value | Without Mortgage | With Mortgage |
| Less than $50,000 | 175 (79.5%) | 0 (0.0%) |
| $50,000 to $99,999 | 41 (18.6%) | 4 (33.3%) |
| $100,000 to $299,999 | 4 (1.8%) | 8 (66.7%) |
| $300,000 to $499,999 | 0 (0.0%) | 0 (0.0%) |
| $500,000 to $749,999 | 0 (0.0%) | 0 (0.0%) |
| $750,000 to $999,999 | 0 (0.0%) | 0 (0.0%) |
| $1,000,000 or more | 0 (0.0%) | 0 (0.0%) |
| Total | 220 (100.0%) | 12 (100.0%) |
Household Income by Mortgage Status in Church Rock
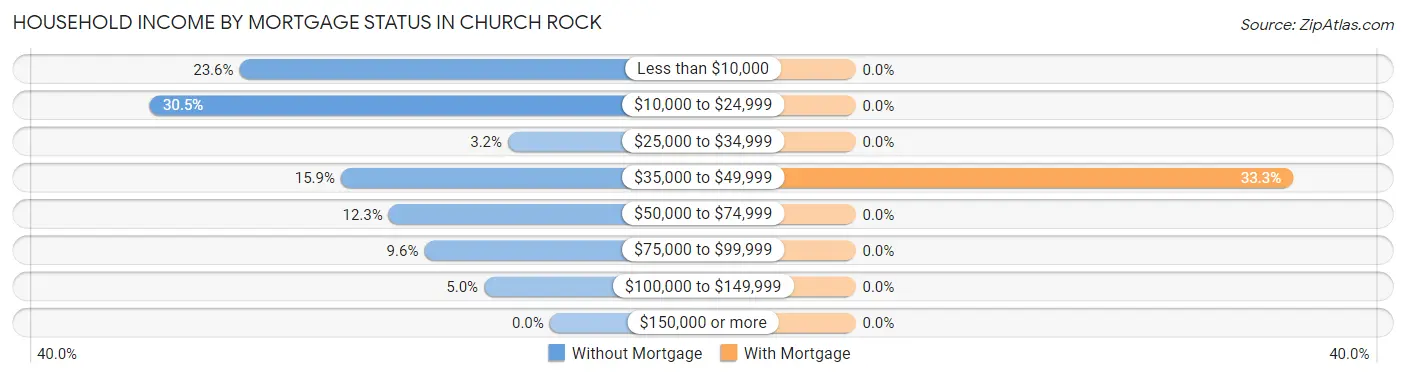
| Household Income | Without Mortgage | With Mortgage |
| Less than $10,000 | 52 (23.6%) | 0 (0.0%) |
| $10,000 to $24,999 | 67 (30.4%) | 0 (0.0%) |
| $25,000 to $34,999 | 7 (3.2%) | 0 (0.0%) |
| $35,000 to $49,999 | 35 (15.9%) | 4 (33.3%) |
| $50,000 to $74,999 | 27 (12.3%) | 0 (0.0%) |
| $75,000 to $99,999 | 21 (9.6%) | 0 (0.0%) |
| $100,000 to $149,999 | 11 (5.0%) | 0 (0.0%) |
| $150,000 or more | 0 (0.0%) | 0 (0.0%) |
| Total | 220 (100.0%) | 12 (100.0%) |
Property Value to Household Income Ratio in Church Rock
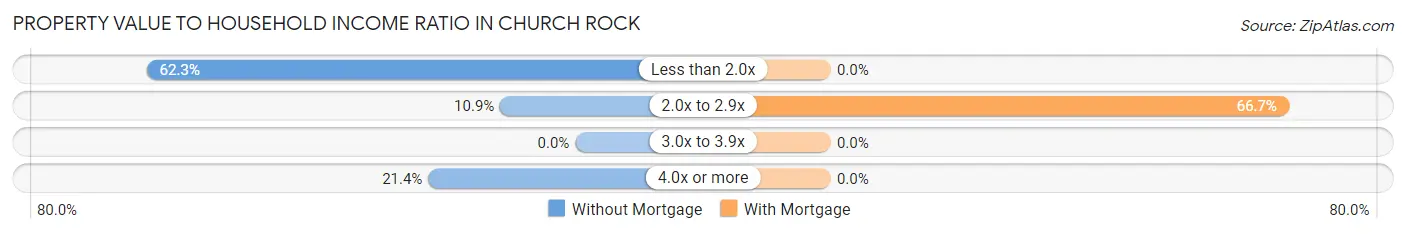
| Value-to-Income Ratio | Without Mortgage | With Mortgage |
| Less than 2.0x | 137 (62.3%) | 0 (0.0%) |
| 2.0x to 2.9x | 24 (10.9%) | 8 (66.7%) |
| 3.0x to 3.9x | 0 (0.0%) | 0 (0.0%) |
| 4.0x or more | 47 (21.4%) | 0 (0.0%) |
| Total | 220 (100.0%) | 12 (100.0%) |
Real Estate Taxes by Mortgage Status in Church Rock
| Property Taxes | Without Mortgage | With Mortgage |
| Less than $800 | 0 (0.0%) | 0 (0.0%) |
| $800 to $1,499 | 0 (0.0%) | 0 (0.0%) |
| $800 to $1,499 | 0 (0.0%) | 0 (0.0%) |
| Total | 220 (100.0%) | 12 (100.0%) |
Health & Disability in Church Rock
Health Insurance Coverage by Age in Church Rock
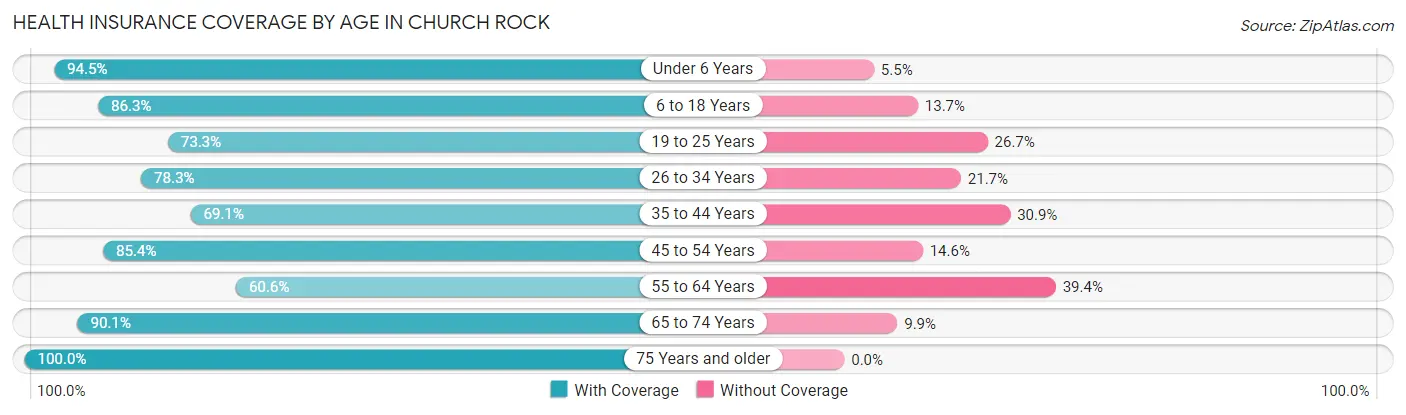
| Age Bracket | With Coverage | Without Coverage |
| Under 6 Years | 154 (94.5%) | 9 (5.5%) |
| 6 to 18 Years | 283 (86.3%) | 45 (13.7%) |
| 19 to 25 Years | 96 (73.3%) | 35 (26.7%) |
| 26 to 34 Years | 162 (78.3%) | 45 (21.7%) |
| 35 to 44 Years | 125 (69.1%) | 56 (30.9%) |
| 45 to 54 Years | 70 (85.4%) | 12 (14.6%) |
| 55 to 64 Years | 106 (60.6%) | 69 (39.4%) |
| 65 to 74 Years | 73 (90.1%) | 8 (9.9%) |
| 75 Years and older | 47 (100.0%) | 0 (0.0%) |
| Total | 1,116 (80.0%) | 279 (20.0%) |
Health Insurance Coverage by Citizenship Status in Church Rock
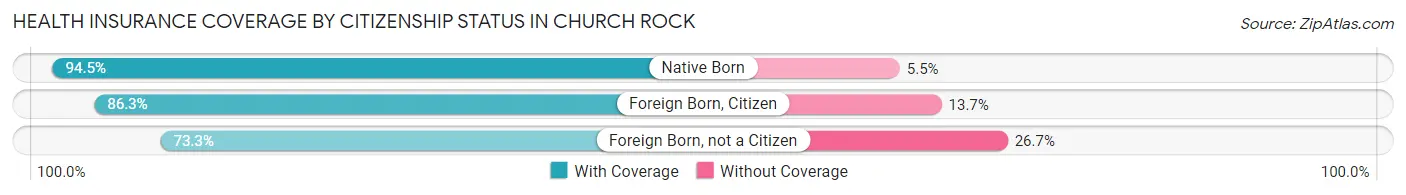
| Citizenship Status | With Coverage | Without Coverage |
| Native Born | 154 (94.5%) | 9 (5.5%) |
| Foreign Born, Citizen | 283 (86.3%) | 45 (13.7%) |
| Foreign Born, not a Citizen | 96 (73.3%) | 35 (26.7%) |
Health Insurance Coverage by Household Income in Church Rock
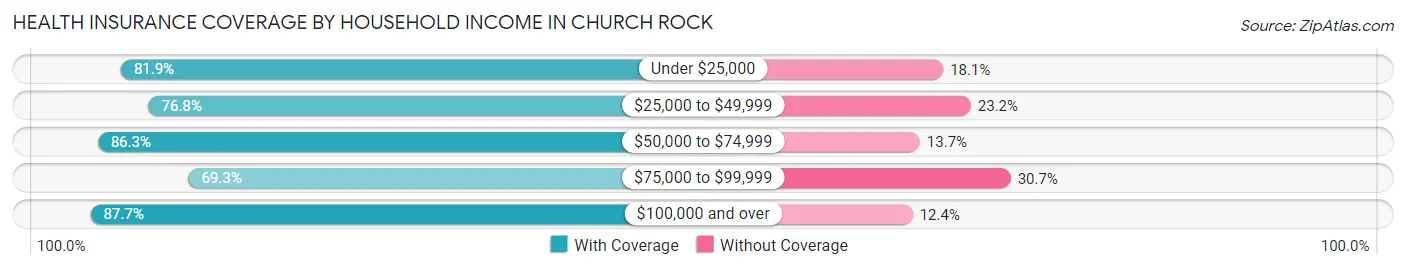
| Household Income | With Coverage | Without Coverage |
| Under $25,000 | 313 (81.9%) | 69 (18.1%) |
| $25,000 to $49,999 | 261 (76.8%) | 79 (23.2%) |
| $50,000 to $74,999 | 233 (86.3%) | 37 (13.7%) |
| $75,000 to $99,999 | 167 (69.3%) | 74 (30.7%) |
| $100,000 and over | 142 (87.6%) | 20 (12.3%) |
Public vs Private Health Insurance Coverage by Age in Church Rock
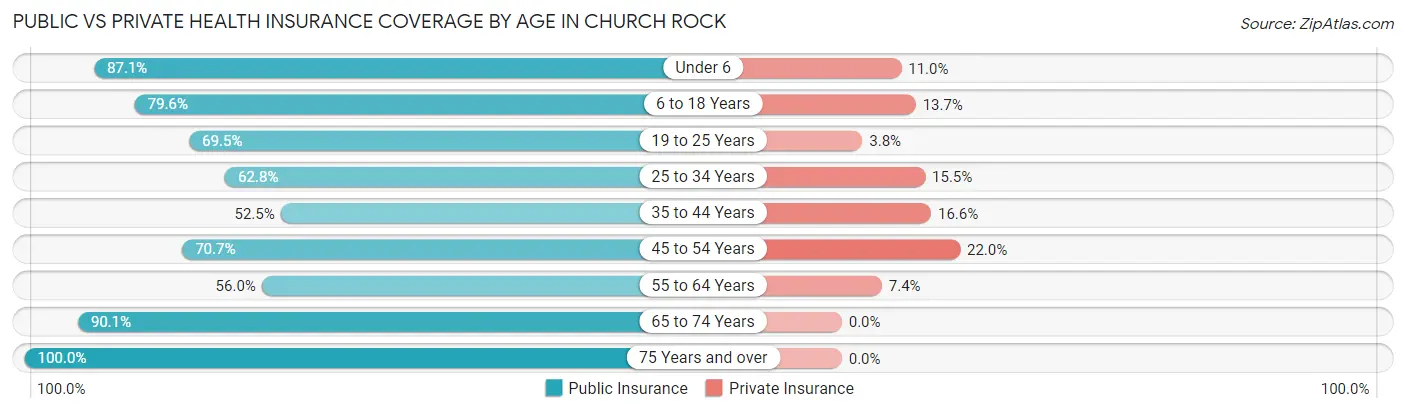
| Age Bracket | Public Insurance | Private Insurance |
| Under 6 | 142 (87.1%) | 18 (11.0%) |
| 6 to 18 Years | 261 (79.6%) | 45 (13.7%) |
| 19 to 25 Years | 91 (69.5%) | 5 (3.8%) |
| 25 to 34 Years | 130 (62.8%) | 32 (15.5%) |
| 35 to 44 Years | 95 (52.5%) | 30 (16.6%) |
| 45 to 54 Years | 58 (70.7%) | 18 (22.0%) |
| 55 to 64 Years | 98 (56.0%) | 13 (7.4%) |
| 65 to 74 Years | 73 (90.1%) | 0 (0.0%) |
| 75 Years and over | 47 (100.0%) | 0 (0.0%) |
| Total | 995 (71.3%) | 161 (11.5%) |
Disability Status by Sex by Age in Church Rock
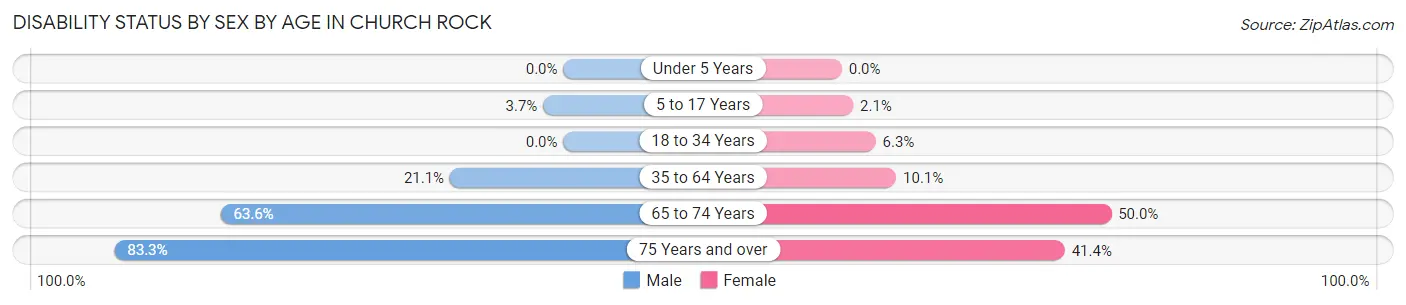
| Age Bracket | Male | Female |
| Under 5 Years | 0 (0.0%) | 0 (0.0%) |
| 5 to 17 Years | 4 (3.7%) | 5 (2.1%) |
| 18 to 34 Years | 0 (0.0%) | 13 (6.3%) |
| 35 to 64 Years | 40 (21.0%) | 25 (10.1%) |
| 65 to 74 Years | 21 (63.6%) | 24 (50.0%) |
| 75 Years and over | 15 (83.3%) | 12 (41.4%) |
Disability Class by Sex by Age in Church Rock
Disability Class: Hearing Difficulty
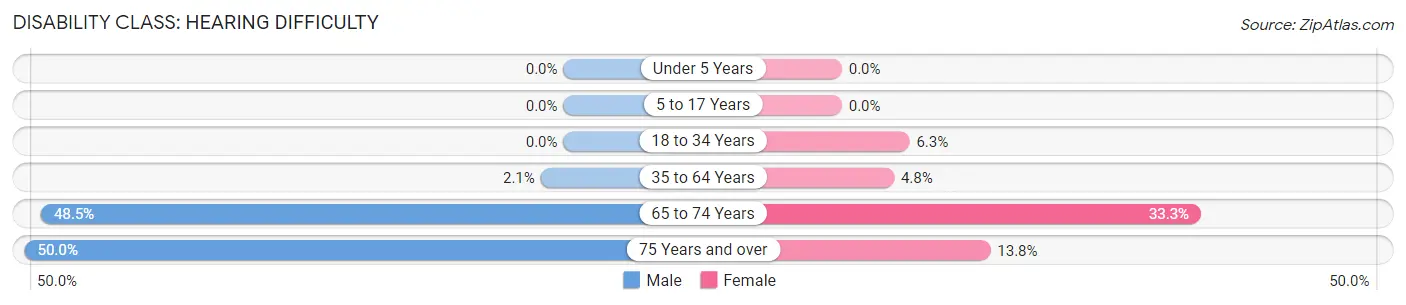
| Age Bracket | Male | Female |
| Under 5 Years | 0 (0.0%) | 0 (0.0%) |
| 5 to 17 Years | 0 (0.0%) | 0 (0.0%) |
| 18 to 34 Years | 0 (0.0%) | 13 (6.3%) |
| 35 to 64 Years | 4 (2.1%) | 12 (4.8%) |
| 65 to 74 Years | 16 (48.5%) | 16 (33.3%) |
| 75 Years and over | 9 (50.0%) | 4 (13.8%) |
Disability Class: Vision Difficulty
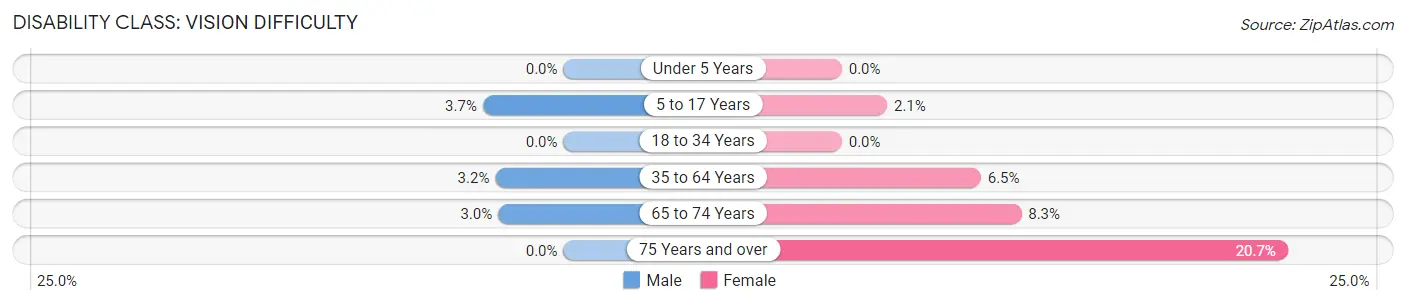
| Age Bracket | Male | Female |
| Under 5 Years | 0 (0.0%) | 0 (0.0%) |
| 5 to 17 Years | 4 (3.7%) | 5 (2.1%) |
| 18 to 34 Years | 0 (0.0%) | 0 (0.0%) |
| 35 to 64 Years | 6 (3.2%) | 16 (6.5%) |
| 65 to 74 Years | 1 (3.0%) | 4 (8.3%) |
| 75 Years and over | 0 (0.0%) | 6 (20.7%) |
Disability Class: Cognitive Difficulty
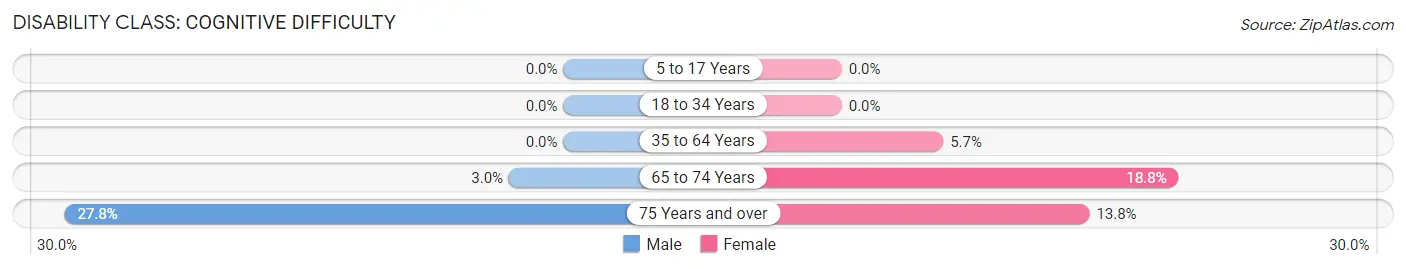
| Age Bracket | Male | Female |
| 5 to 17 Years | 0 (0.0%) | 0 (0.0%) |
| 18 to 34 Years | 0 (0.0%) | 0 (0.0%) |
| 35 to 64 Years | 0 (0.0%) | 14 (5.7%) |
| 65 to 74 Years | 1 (3.0%) | 9 (18.8%) |
| 75 Years and over | 5 (27.8%) | 4 (13.8%) |
Disability Class: Ambulatory Difficulty
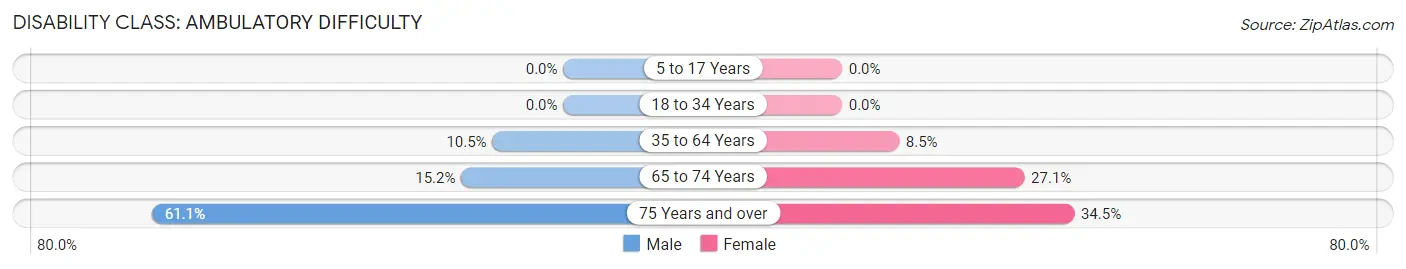
| Age Bracket | Male | Female |
| 5 to 17 Years | 0 (0.0%) | 0 (0.0%) |
| 18 to 34 Years | 0 (0.0%) | 0 (0.0%) |
| 35 to 64 Years | 20 (10.5%) | 21 (8.5%) |
| 65 to 74 Years | 5 (15.1%) | 13 (27.1%) |
| 75 Years and over | 11 (61.1%) | 10 (34.5%) |
Disability Class: Self-Care Difficulty
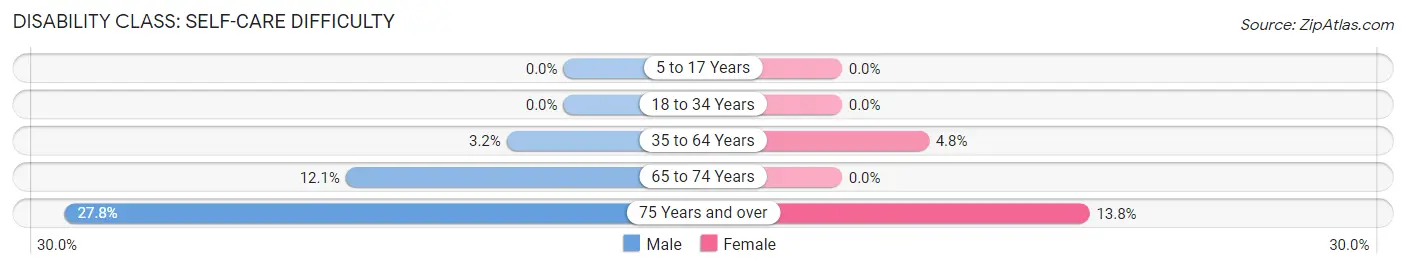
| Age Bracket | Male | Female |
| 5 to 17 Years | 0 (0.0%) | 0 (0.0%) |
| 18 to 34 Years | 0 (0.0%) | 0 (0.0%) |
| 35 to 64 Years | 6 (3.2%) | 12 (4.8%) |
| 65 to 74 Years | 4 (12.1%) | 0 (0.0%) |
| 75 Years and over | 5 (27.8%) | 4 (13.8%) |
Technology Access in Church Rock
Computing Device Access in Church Rock
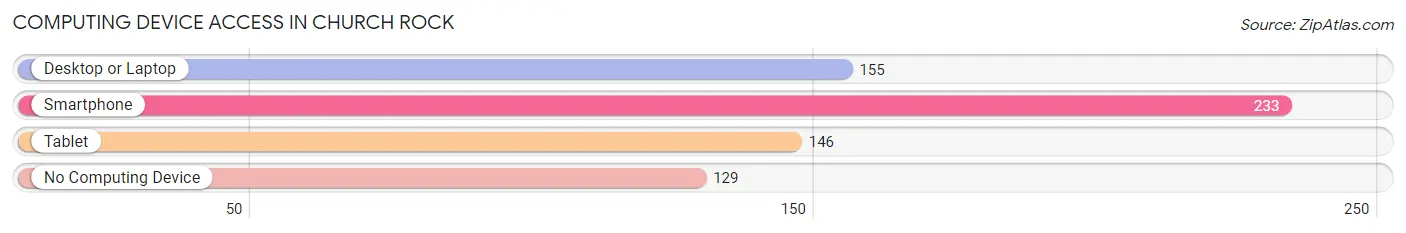
| Device Type | # Households | % Households |
| Desktop or Laptop | 155 | 42.0% |
| Smartphone | 233 | 63.1% |
| Tablet | 146 | 39.6% |
| No Computing Device | 129 | 35.0% |
| Total | 369 | 100.0% |
Internet Access in Church Rock
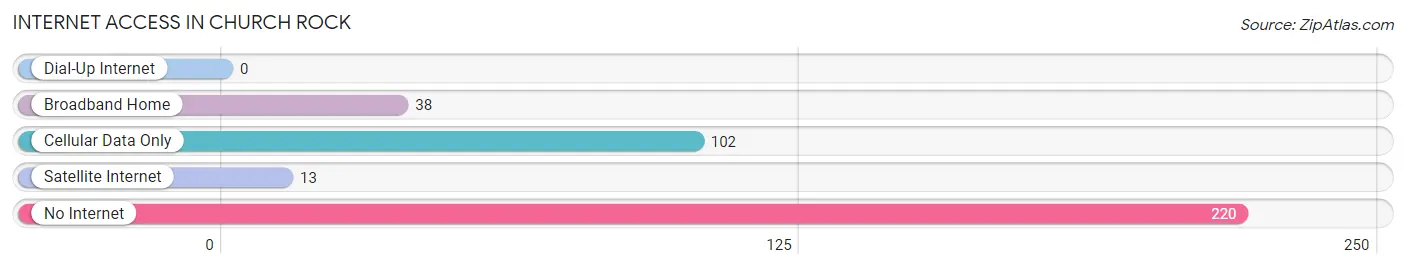
| Internet Type | # Households | % Households |
| Dial-Up Internet | 0 | 0.0% |
| Broadband Home | 38 | 10.3% |
| Cellular Data Only | 102 | 27.6% |
| Satellite Internet | 13 | 3.5% |
| No Internet | 220 | 59.6% |
| Total | 369 | 100.0% |
Church Rock Summary
Rock, New Mexico is a small unincorporated community located in the northwest corner of the state, in the county of McKinley. It is located on the Navajo Nation Reservation, and is the site of the Church Rock uranium mill spill, which occurred in 1979. The spill is considered to be one of the worst nuclear disasters in United States history.
Geography
Church Rock is located in the northwest corner of New Mexico, in the county of McKinley. It is situated on the Navajo Nation Reservation, and is located approximately 20 miles east of Gallup, New Mexico. The area is characterized by high desert terrain, with elevations ranging from 5,000 to 6,000 feet. The climate is semi-arid, with hot summers and cold winters.
Economy
The economy of Church Rock is largely based on agriculture and tourism. The area is home to a number of small farms, which produce a variety of crops, including corn, beans, squash, and melons. The area is also home to a number of tourist attractions, including the Church Rock uranium mill spill site, the Navajo Nation Museum, and the Navajo Nation Zoo.
Demographics
As of the 2010 census, the population of Church Rock was 1,788. The population is primarily Native American, with the majority of the population being Navajo. The median household income is $25,000, and the median age is 33.
History
Church Rock has a long and storied history. The area was first inhabited by the Navajo people, who settled in the area in the late 1800s. The area was also home to a number of uranium mines, which were operated by the United Nuclear Corporation. In 1979, a uranium mill spill occurred at the Church Rock site, which is considered to be one of the worst nuclear disasters in United States history. The spill contaminated the nearby Puerco River, and resulted in the displacement of many Navajo people.
In the years following the spill, the area has seen a resurgence in economic activity. The Navajo Nation has invested heavily in the area, and has opened a number of businesses, including a casino, a hotel, and a museum. The area has also seen an increase in tourism, as visitors come to learn about the history of the area and the Church Rock uranium mill spill.
Conclusion
Church Rock, New Mexico is a small unincorporated community located in the northwest corner of the state, in the county of McKinley. It is located on the Navajo Nation Reservation, and is the site of the Church Rock uranium mill spill, which occurred in 1979. The economy of Church Rock is largely based on agriculture and tourism, and the population is primarily Native American, with the majority of the population being Navajo. The area has seen a resurgence in economic activity in the years following the spill, and has become a popular tourist destination.
Common Questions
What is Per Capita Income in Church Rock?
Per Capita income in Church Rock is $13,218.
What is the Median Family Income in Church Rock?
Median Family Income in Church Rock is $41,563.
What is the Median Household income in Church Rock?
Median Household Income in Church Rock is $31,875.
What is Income or Wage Gap in Church Rock?
Income or Wage Gap in Church Rock is 14.4%.
Women in Church Rock earn 85.6 cents for every dollar earned by a man.
What is Family Income Deficit in Church Rock?
Family Income Deficit in Church Rock is $18,382.
Families that are below poverty line in Church Rock earn $18,382 less on average than the poverty threshold level.
What is Inequality or Gini Index in Church Rock?
Inequality or Gini Index in Church Rock is 0.48.
What is the Total Population of Church Rock?
Total Population of Church Rock is 1,395.
What is the Total Male Population of Church Rock?
Total Male Population of Church Rock is 578.
What is the Total Female Population of Church Rock?
Total Female Population of Church Rock is 817.
What is the Ratio of Males per 100 Females in Church Rock?
There are 70.75 Males per 100 Females in Church Rock.
What is the Ratio of Females per 100 Males in Church Rock?
There are 141.35 Females per 100 Males in Church Rock.
What is the Median Population Age in Church Rock?
Median Population Age in Church Rock is 30.1 Years.
What is the Average Family Size in Church Rock
Average Family Size in Church Rock is 4.7 People.
What is the Average Household Size in Church Rock
Average Household Size in Church Rock is 3.8 People.
How Large is the Labor Force in Church Rock?
There are 477 People in the Labor Forcein in Church Rock.
What is the Percentage of People in the Labor Force in Church Rock?
48.1% of People are in the Labor Force in Church Rock.
What is the Unemployment Rate in Church Rock?
Unemployment Rate in Church Rock is 7.3%.