La Mesa, NM Map & Demographics
La Mesa Map
La Mesa Overview
$18,975
PER CAPITA INCOME
$39,186
AVG FAMILY INCOME
$38,693
AVG HOUSEHOLD INCOME
42.9%
WAGE / INCOME GAP [ % ]
57.1¢/ $1
WAGE / INCOME GAP [ $ ]
0.35
INEQUALITY / GINI INDEX
650
TOTAL POPULATION
379
MALE POPULATION
271
FEMALE POPULATION
139.85
MALES / 100 FEMALES
71.50
FEMALES / 100 MALES
62.1
MEDIAN AGE
2.7
AVG FAMILY SIZE
2.5
AVG HOUSEHOLD SIZE
165
LABOR FORCE [ PEOPLE ]
34.6%
PERCENT IN LABOR FORCE
La Mesa Zip Codes
La Mesa Area Codes
Income in La Mesa
Income Overview in La Mesa
Per Capita Income in La Mesa is $18,975, while median incomes of families and households are $39,186 and $38,693 respectively.
| Characteristic | Number | Measure |
| Per Capita Income | 650 | $18,975 |
| Median Family Income | 229 | $39,186 |
| Mean Family Income | 229 | $47,306 |
| Median Household Income | 261 | $38,693 |
| Mean Household Income | 261 | $45,601 |
| Income Deficit | 229 | $0 |
| Wage / Income Gap (%) | 650 | 42.94% |
| Wage / Income Gap ($) | 650 | 57.06¢ per $1 |
| Gini / Inequality Index | 650 | 0.35 |
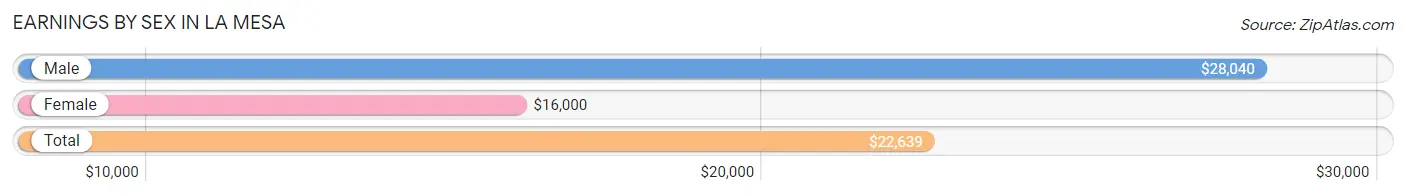
Earnings by Sex in La Mesa
Average Earnings in La Mesa are $22,639, $28,040 for men and $16,000 for women, a difference of 42.9%.
| Sex | Number | Average Earnings |
| Male | 149 (74.1%) | $28,040 |
| Female | 52 (25.9%) | $16,000 |
| Total | 201 (100.0%) | $22,639 |
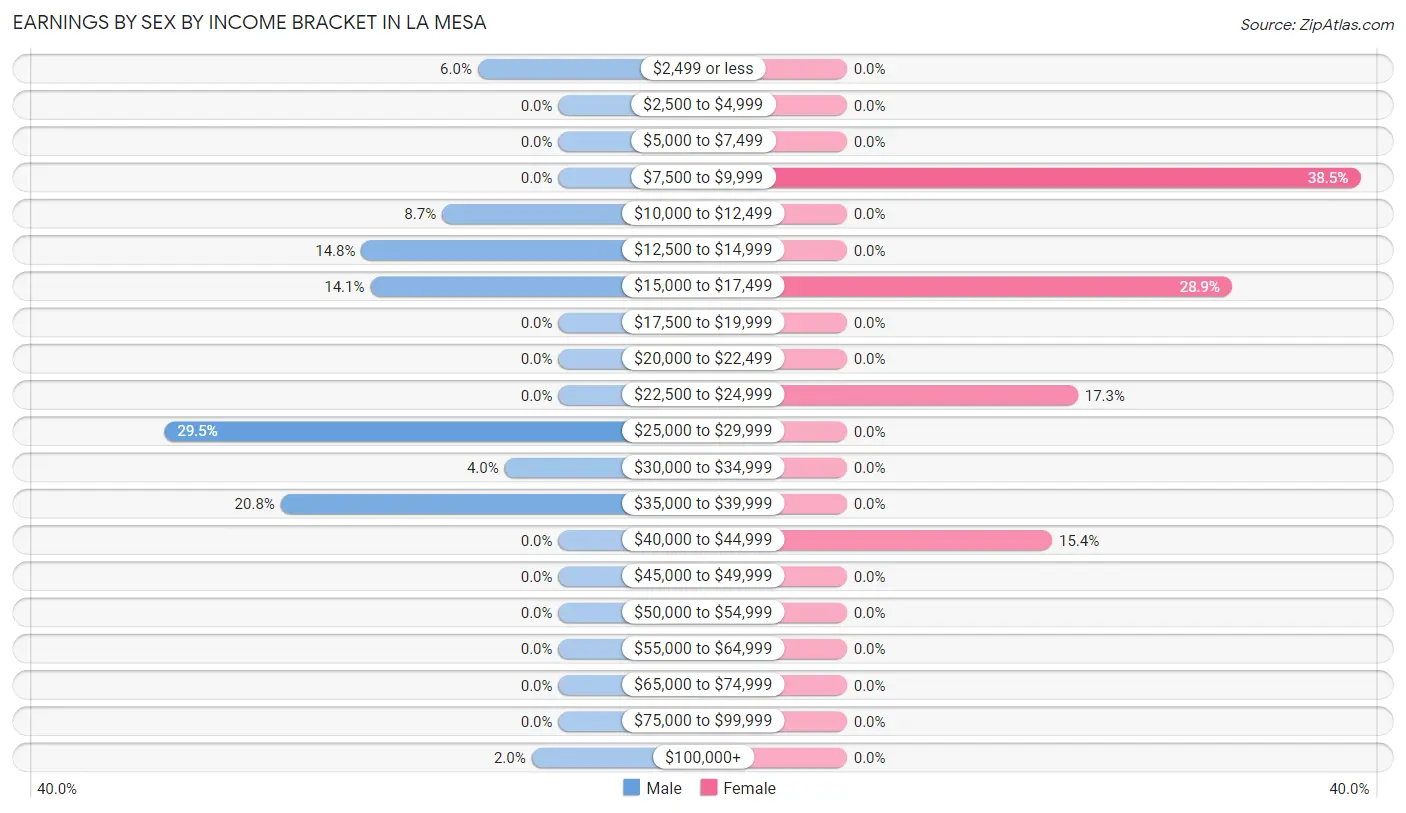
Earnings by Sex by Income Bracket in La Mesa
The most common earnings brackets in La Mesa are $25,000 to $29,999 for men (44 | 29.5%) and $7,500 to $9,999 for women (20 | 38.5%).
| Income | Male | Female |
| $2,499 or less | 9 (6.0%) | 0 (0.0%) |
| $2,500 to $4,999 | 0 (0.0%) | 0 (0.0%) |
| $5,000 to $7,499 | 0 (0.0%) | 0 (0.0%) |
| $7,500 to $9,999 | 0 (0.0%) | 20 (38.5%) |
| $10,000 to $12,499 | 13 (8.7%) | 0 (0.0%) |
| $12,500 to $14,999 | 22 (14.8%) | 0 (0.0%) |
| $15,000 to $17,499 | 21 (14.1%) | 15 (28.8%) |
| $17,500 to $19,999 | 0 (0.0%) | 0 (0.0%) |
| $20,000 to $22,499 | 0 (0.0%) | 0 (0.0%) |
| $22,500 to $24,999 | 0 (0.0%) | 9 (17.3%) |
| $25,000 to $29,999 | 44 (29.5%) | 0 (0.0%) |
| $30,000 to $34,999 | 6 (4.0%) | 0 (0.0%) |
| $35,000 to $39,999 | 31 (20.8%) | 0 (0.0%) |
| $40,000 to $44,999 | 0 (0.0%) | 8 (15.4%) |
| $45,000 to $49,999 | 0 (0.0%) | 0 (0.0%) |
| $50,000 to $54,999 | 0 (0.0%) | 0 (0.0%) |
| $55,000 to $64,999 | 0 (0.0%) | 0 (0.0%) |
| $65,000 to $74,999 | 0 (0.0%) | 0 (0.0%) |
| $75,000 to $99,999 | 0 (0.0%) | 0 (0.0%) |
| $100,000+ | 3 (2.0%) | 0 (0.0%) |
| Total | 149 (100.0%) | 52 (100.0%) |
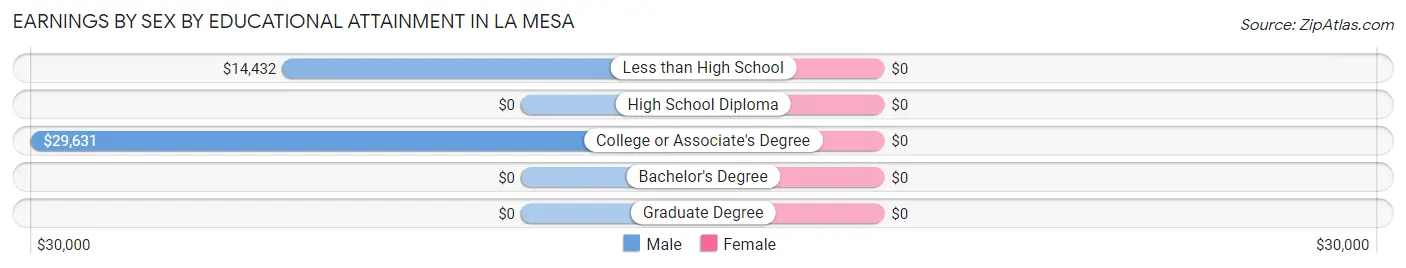
Earnings by Sex by Educational Attainment in La Mesa
| Educational Attainment | Male Income | Female Income |
| Less than High School | $14,432 | $0 |
| High School Diploma | - | - |
| College or Associate's Degree | $29,631 | $0 |
| Bachelor's Degree | - | - |
| Graduate Degree | - | - |
| Total | $28,040 | $16,000 |
Family Income in La Mesa
Family Income Brackets in La Mesa
According to the La Mesa family income data, there are 113 families falling into the $35,000 to $49,999 income range, which is the most common income bracket and makes up 49.3% of all families.
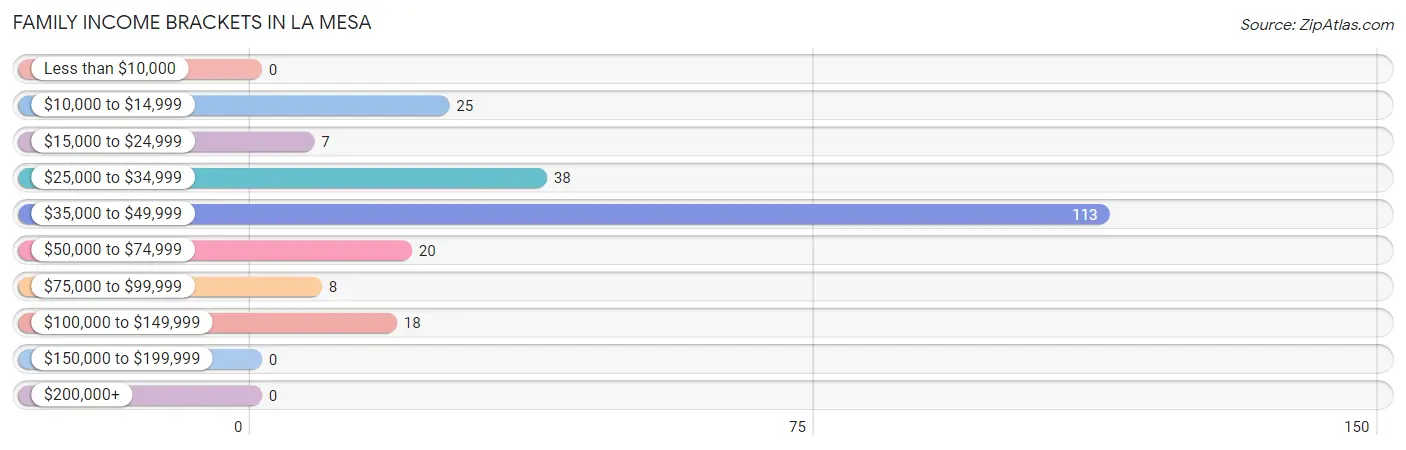
| Income Bracket | # Families | % Families |
| Less than $10,000 | 0 | 0.0% |
| $10,000 to $14,999 | 25 | 10.9% |
| $15,000 to $24,999 | 7 | 3.1% |
| $25,000 to $34,999 | 38 | 16.6% |
| $35,000 to $49,999 | 113 | 49.3% |
| $50,000 to $74,999 | 20 | 8.7% |
| $75,000 to $99,999 | 8 | 3.5% |
| $100,000 to $149,999 | 18 | 7.9% |
| $150,000 to $199,999 | 0 | 0.0% |
| $200,000+ | 0 | 0.0% |
Family Income by Famaliy Size in La Mesa
2-person families (159 | 69.4%) account for the highest median family income in La Mesa with $39,375 per family, while 2-person families (159 | 69.4%) have the highest median income of $19,688 per family member.
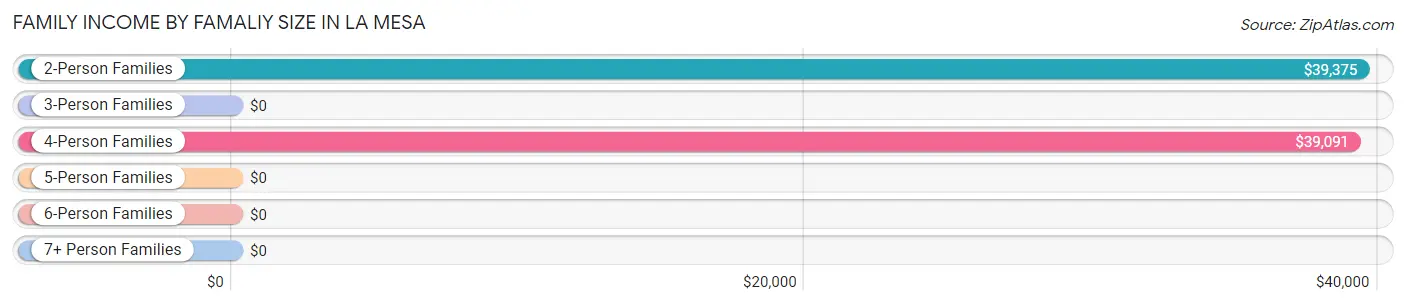
| Income Bracket | # Families | Median Income |
| 2-Person Families | 159 (69.4%) | $39,375 |
| 3-Person Families | 0 (0.0%) | $0 |
| 4-Person Families | 70 (30.6%) | $39,091 |
| 5-Person Families | 0 (0.0%) | $0 |
| 6-Person Families | 0 (0.0%) | $0 |
| 7+ Person Families | 0 (0.0%) | $0 |
| Total | 229 (100.0%) | $39,186 |
Family Income by Number of Earners in La Mesa
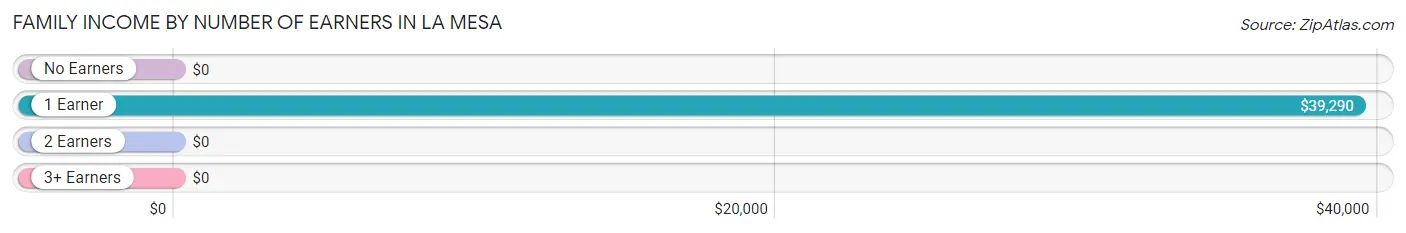
| Number of Earners | # Families | Median Income |
| No Earners | 90 (39.3%) | $0 |
| 1 Earner | 107 (46.7%) | $39,290 |
| 2 Earners | 32 (14.0%) | $0 |
| 3+ Earners | 0 (0.0%) | $0 |
| Total | 229 (100.0%) | $39,186 |
Household Income in La Mesa
Household Income Brackets in La Mesa
With 113 households falling in the category, the $35,000 to $49,999 income range is the most frequent in La Mesa, accounting for 43.3% of all households.
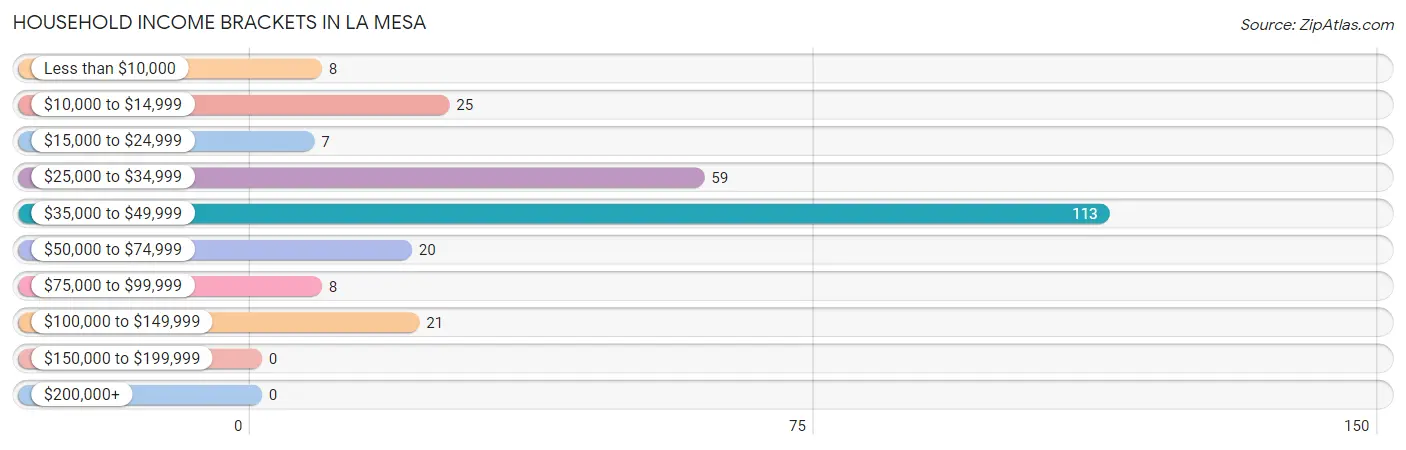
| Income Bracket | # Households | % Households |
| Less than $10,000 | 8 | 3.1% |
| $10,000 to $14,999 | 25 | 9.6% |
| $15,000 to $24,999 | 7 | 2.7% |
| $25,000 to $34,999 | 59 | 22.6% |
| $35,000 to $49,999 | 113 | 43.3% |
| $50,000 to $74,999 | 20 | 7.7% |
| $75,000 to $99,999 | 8 | 3.1% |
| $100,000 to $149,999 | 21 | 8.0% |
| $150,000 to $199,999 | 0 | 0.0% |
| $200,000+ | 0 | 0.0% |
Household Income by Householder Age in La Mesa
The median household income in La Mesa is $38,693, with the highest median household income of $39,489 found in the 65+ years age bracket for the primary householder. A total of 147 households (56.3%) fall into this category.
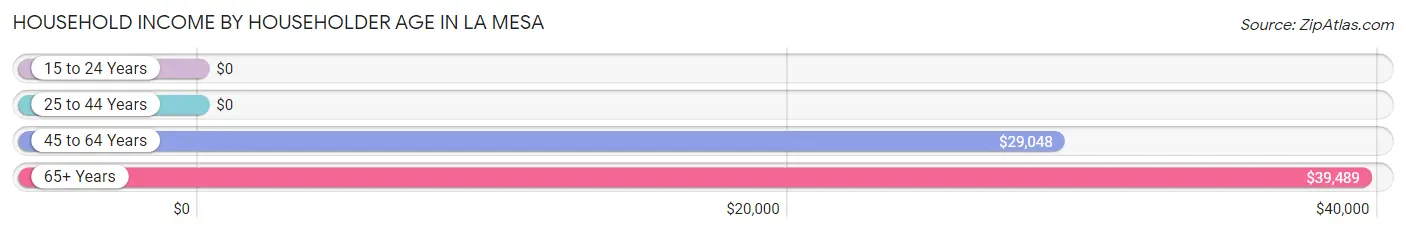
| Income Bracket | # Households | Median Income |
| 15 to 24 Years | 0 (0.0%) | $0 |
| 25 to 44 Years | 44 (16.9%) | $0 |
| 45 to 64 Years | 70 (26.8%) | $29,048 |
| 65+ Years | 147 (56.3%) | $39,489 |
| Total | 261 (100.0%) | $38,693 |
Poverty in La Mesa
Income Below Poverty by Sex and Age in La Mesa
With 12.9% poverty level for males and 15.1% for females among the residents of La Mesa, 75 year old and over males and 6 to 11 year old females are the most vulnerable to poverty, with 25 males (100.0%) and 9 females (100.0%) in their respective age groups living below the poverty level.
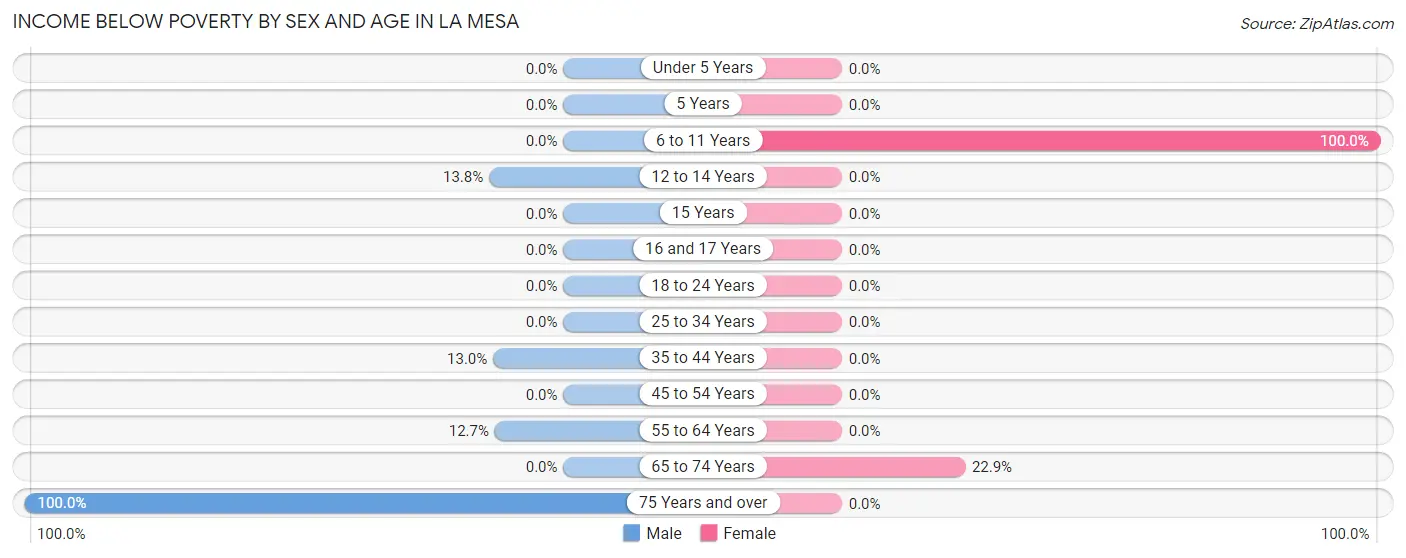
| Age Bracket | Male | Female |
| Under 5 Years | 0 (0.0%) | 0 (0.0%) |
| 5 Years | 0 (0.0%) | 0 (0.0%) |
| 6 to 11 Years | 0 (0.0%) | 9 (100.0%) |
| 12 to 14 Years | 8 (13.8%) | 0 (0.0%) |
| 15 Years | 0 (0.0%) | 0 (0.0%) |
| 16 and 17 Years | 0 (0.0%) | 0 (0.0%) |
| 18 to 24 Years | 0 (0.0%) | 0 (0.0%) |
| 25 to 34 Years | 0 (0.0%) | 0 (0.0%) |
| 35 to 44 Years | 9 (13.0%) | 0 (0.0%) |
| 45 to 54 Years | 0 (0.0%) | 0 (0.0%) |
| 55 to 64 Years | 7 (12.7%) | 0 (0.0%) |
| 65 to 74 Years | 0 (0.0%) | 32 (22.9%) |
| 75 Years and over | 25 (100.0%) | 0 (0.0%) |
| Total | 49 (12.9%) | 41 (15.1%) |
Income Above Poverty by Sex and Age in La Mesa
According to the poverty statistics in La Mesa, males aged under 5 years and females aged under 5 years are the age groups that are most secure financially, with 100.0% of males and 100.0% of females in these age groups living above the poverty line.
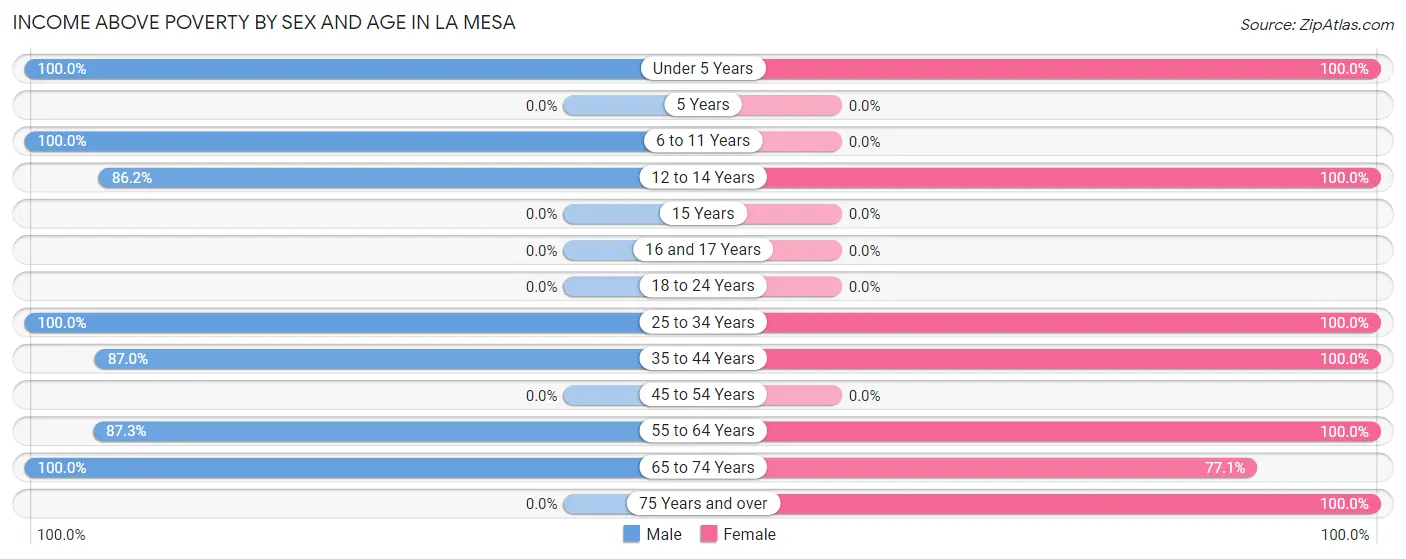
| Age Bracket | Male | Female |
| Under 5 Years | 43 (100.0%) | 9 (100.0%) |
| 5 Years | 0 (0.0%) | 0 (0.0%) |
| 6 to 11 Years | 12 (100.0%) | 0 (0.0%) |
| 12 to 14 Years | 50 (86.2%) | 42 (100.0%) |
| 15 Years | 0 (0.0%) | 0 (0.0%) |
| 16 and 17 Years | 0 (0.0%) | 0 (0.0%) |
| 18 to 24 Years | 0 (0.0%) | 0 (0.0%) |
| 25 to 34 Years | 13 (100.0%) | 24 (100.0%) |
| 35 to 44 Years | 60 (87.0%) | 9 (100.0%) |
| 45 to 54 Years | 0 (0.0%) | 0 (0.0%) |
| 55 to 64 Years | 48 (87.3%) | 22 (100.0%) |
| 65 to 74 Years | 104 (100.0%) | 108 (77.1%) |
| 75 Years and over | 0 (0.0%) | 16 (100.0%) |
| Total | 330 (87.1%) | 230 (84.9%) |
Income Below Poverty Among Married-Couple Families in La Mesa
The poverty statistics for married-couple families in La Mesa show that 19.8% or 25 of the total 126 families live below the poverty line. Families with no children have the highest poverty rate of 19.8%, comprising of 25 families. On the other hand, families with no children have the lowest poverty rate of 19.8%, which includes 25 families.
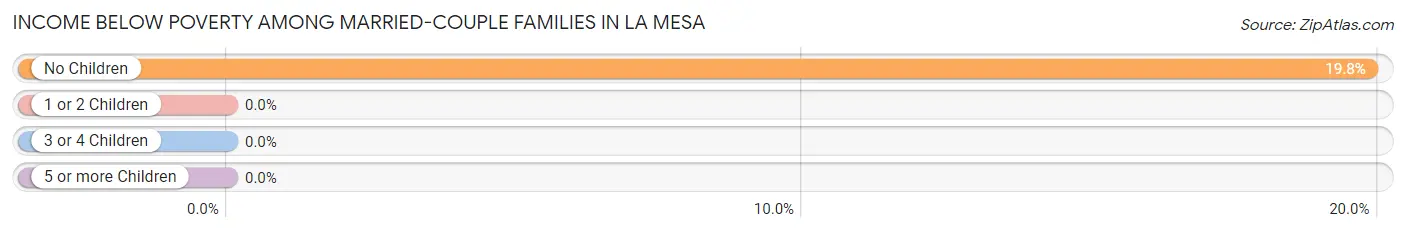
| Children | Above Poverty | Below Poverty |
| No Children | 101 (80.2%) | 25 (19.8%) |
| 1 or 2 Children | 0 (0.0%) | 0 (0.0%) |
| 3 or 4 Children | 0 (0.0%) | 0 (0.0%) |
| 5 or more Children | 0 (0.0%) | 0 (0.0%) |
| Total | 101 (80.2%) | 25 (19.8%) |
Income Below Poverty Among Single-Parent Households in La Mesa
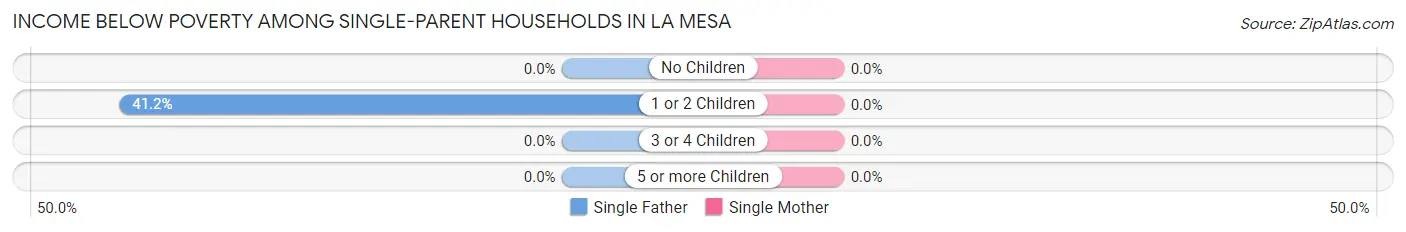
| Children | Single Father | Single Mother |
| No Children | 0 (0.0%) | 0 (0.0%) |
| 1 or 2 Children | 7 (41.2%) | 0 (0.0%) |
| 3 or 4 Children | 0 (0.0%) | 0 (0.0%) |
| 5 or more Children | 0 (0.0%) | 0 (0.0%) |
| Total | 7 (10.4%) | 0 (0.0%) |
Income Below Poverty Among Married-Couple vs Single-Parent Households in La Mesa
The poverty data for La Mesa shows that 25 of the married-couple family households (19.8%) and 7 of the single-parent households (6.8%) are living below the poverty level. Within the married-couple family households, those with no children have the highest poverty rate, with 25 households (19.8%) falling below the poverty line. Among the single-parent households, those with 1 or 2 children have the highest poverty rate, with 7 household (26.9%) living below poverty.
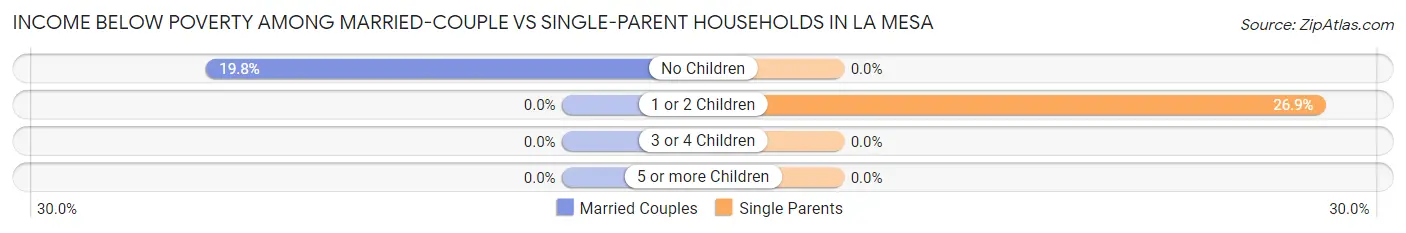
| Children | Married-Couple Families | Single-Parent Households |
| No Children | 25 (19.8%) | 0 (0.0%) |
| 1 or 2 Children | 0 (0.0%) | 7 (26.9%) |
| 3 or 4 Children | 0 (0.0%) | 0 (0.0%) |
| 5 or more Children | 0 (0.0%) | 0 (0.0%) |
| Total | 25 (19.8%) | 7 (6.8%) |
Race in La Mesa
The most populous races in La Mesa are Hispanic or Latino (634 | 97.5%), White / Caucasian (368 | 56.6%), and Some other Race (233 | 35.8%).
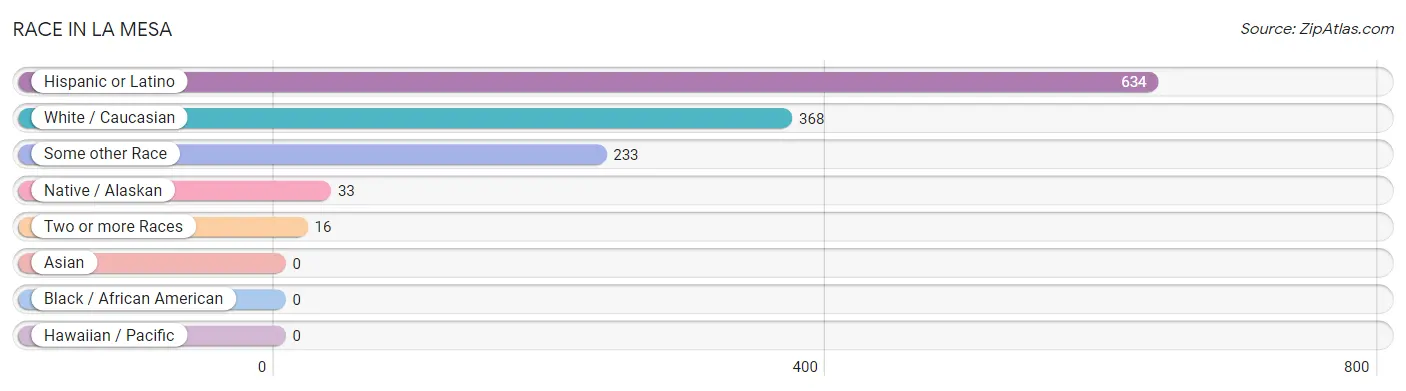
| Race | # Population | % Population |
| Asian | 0 | 0.0% |
| Black / African American | 0 | 0.0% |
| Hawaiian / Pacific | 0 | 0.0% |
| Hispanic or Latino | 634 | 97.5% |
| Native / Alaskan | 33 | 5.1% |
| White / Caucasian | 368 | 56.6% |
| Two or more Races | 16 | 2.5% |
| Some other Race | 233 | 35.8% |
| Total | 650 | 100.0% |
Ancestry in La Mesa
The most populous ancestries reported in La Mesa are Mexican (601 | 92.5%), German (28 | 4.3%), Italian (8 | 1.2%), and Scotch-Irish (3 | 0.5%), together accounting for 98.5% of all La Mesa residents.
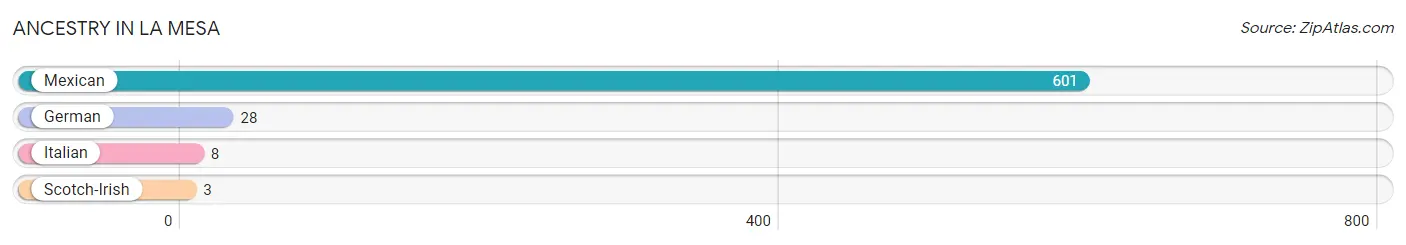
| Ancestry | # Population | % Population |
| German | 28 | 4.3% |
| Italian | 8 | 1.2% |
| Mexican | 601 | 92.5% |
| Scotch-Irish | 3 | 0.5% | View All 4 Rows |
Immigrants in La Mesa
The most numerous immigrant groups reported in La Mesa came from Central America (206 | 31.7%), Latin America (206 | 31.7%), and Mexico (206 | 31.7%), together accounting for 95.1% of all La Mesa residents.
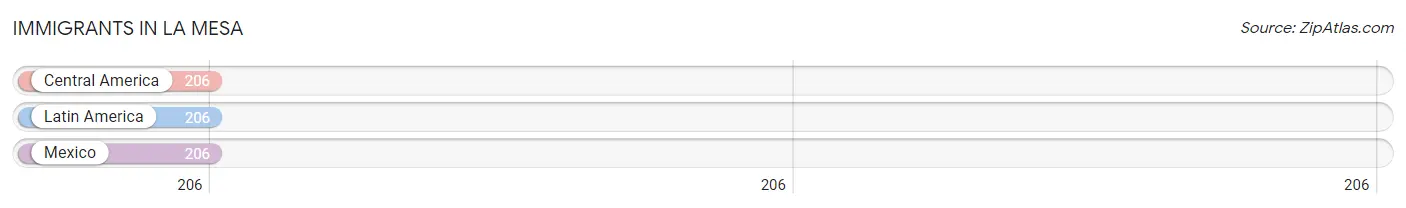
| Immigration Origin | # Population | % Population |
| Central America | 206 | 31.7% |
| Latin America | 206 | 31.7% |
| Mexico | 206 | 31.7% | View All 3 Rows |
Sex and Age in La Mesa
Sex and Age in La Mesa
The most populous age groups in La Mesa are 10 to 14 Years (70 | 18.5%) for men and 65 to 69 Years (81 | 29.9%) for women.
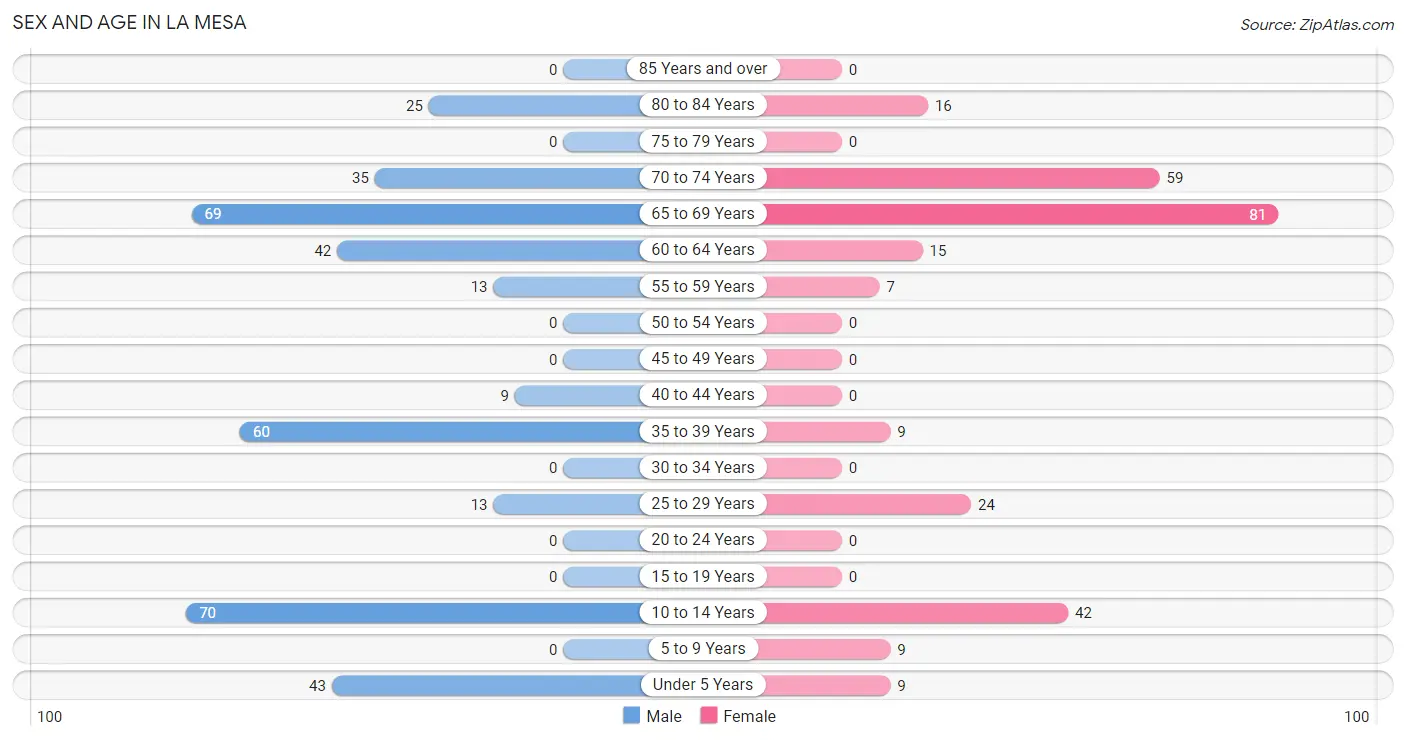
| Age Bracket | Male | Female |
| Under 5 Years | 43 (11.4%) | 9 (3.3%) |
| 5 to 9 Years | 0 (0.0%) | 9 (3.3%) |
| 10 to 14 Years | 70 (18.5%) | 42 (15.5%) |
| 15 to 19 Years | 0 (0.0%) | 0 (0.0%) |
| 20 to 24 Years | 0 (0.0%) | 0 (0.0%) |
| 25 to 29 Years | 13 (3.4%) | 24 (8.9%) |
| 30 to 34 Years | 0 (0.0%) | 0 (0.0%) |
| 35 to 39 Years | 60 (15.8%) | 9 (3.3%) |
| 40 to 44 Years | 9 (2.4%) | 0 (0.0%) |
| 45 to 49 Years | 0 (0.0%) | 0 (0.0%) |
| 50 to 54 Years | 0 (0.0%) | 0 (0.0%) |
| 55 to 59 Years | 13 (3.4%) | 7 (2.6%) |
| 60 to 64 Years | 42 (11.1%) | 15 (5.5%) |
| 65 to 69 Years | 69 (18.2%) | 81 (29.9%) |
| 70 to 74 Years | 35 (9.2%) | 59 (21.8%) |
| 75 to 79 Years | 0 (0.0%) | 0 (0.0%) |
| 80 to 84 Years | 25 (6.6%) | 16 (5.9%) |
| 85 Years and over | 0 (0.0%) | 0 (0.0%) |
| Total | 379 (100.0%) | 271 (100.0%) |
Families and Households in La Mesa
Median Family Size in La Mesa
The median family size in La Mesa is 2.70 persons per family, with single male/father families (67 | 29.3%) accounting for the largest median family size of 3.88 persons per family. On the other hand, married-couple families (126 | 55.0%) represent the smallest median family size with 2.04 persons per family.
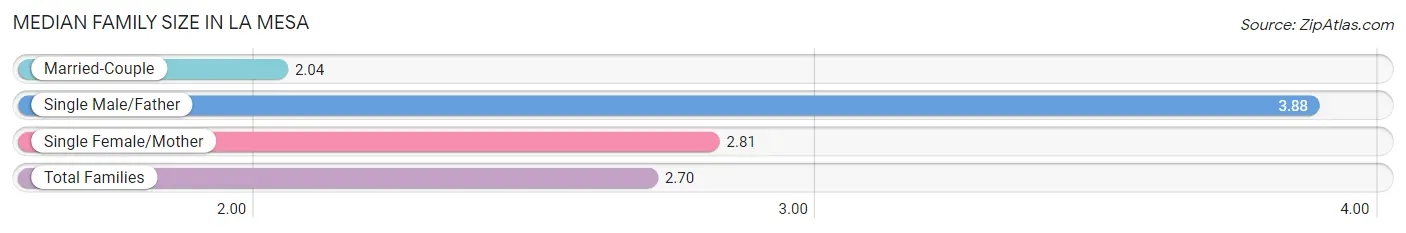
| Family Type | # Families | Family Size |
| Married-Couple | 126 (55.0%) | 2.04 |
| Single Male/Father | 67 (29.3%) | 3.88 |
| Single Female/Mother | 36 (15.7%) | 2.81 |
| Total Families | 229 (100.0%) | 2.70 |
Median Household Size in La Mesa
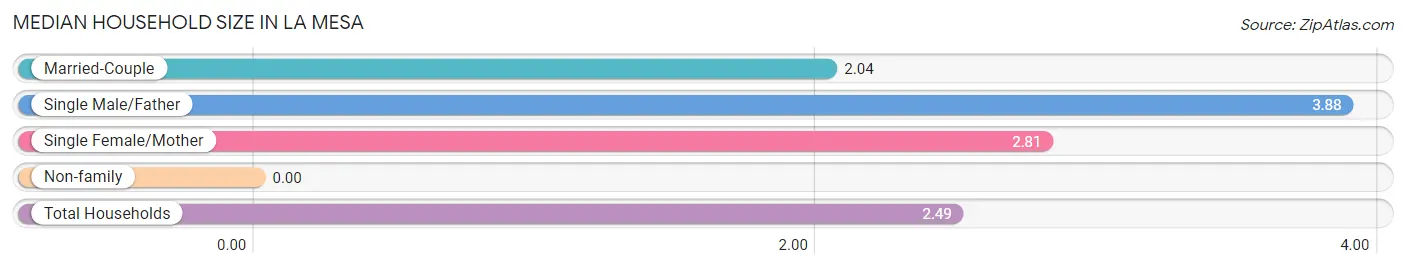
| Household Type | # Households | Household Size |
| Married-Couple | 126 (48.3%) | 2.04 |
| Single Male/Father | 67 (25.7%) | 3.88 |
| Single Female/Mother | 36 (13.8%) | 2.81 |
| Non-family | 32 (12.3%) | - |
| Total Households | 261 (100.0%) | 2.49 |
Household Size by Marriage Status in La Mesa
Out of a total of 261 households in La Mesa, 229 (87.7%) are family households, while 32 (12.3%) are nonfamily households. The most numerous type of family households are 2-person households, comprising 159, and the most common type of nonfamily households are 1-person households, comprising 32.
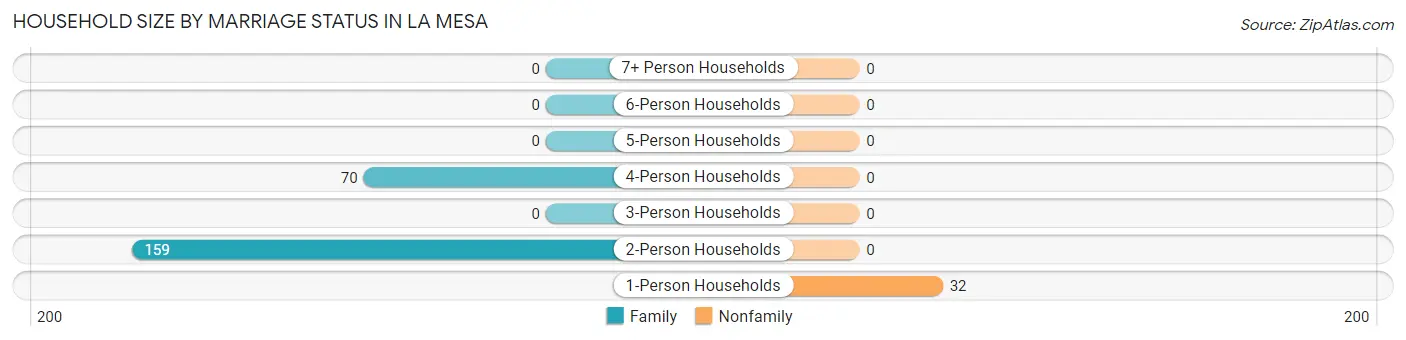
| Household Size | Family Households | Nonfamily Households |
| 1-Person Households | - | 32 (12.3%) |
| 2-Person Households | 159 (60.9%) | 0 (0.0%) |
| 3-Person Households | 0 (0.0%) | 0 (0.0%) |
| 4-Person Households | 70 (26.8%) | 0 (0.0%) |
| 5-Person Households | 0 (0.0%) | 0 (0.0%) |
| 6-Person Households | 0 (0.0%) | 0 (0.0%) |
| 7+ Person Households | 0 (0.0%) | 0 (0.0%) |
| Total | 229 (87.7%) | 32 (12.3%) |
Female Fertility in La Mesa
Fertility by Age in La Mesa
Average fertility rate in La Mesa is 273.0 births per 1,000 women. Women in the age bracket of 35 to 50 years have the highest fertility rate with 1,000.0 births per 1,000 women. Women in the age bracket of 35 to 50 years acount for 100.0% of all women with births.
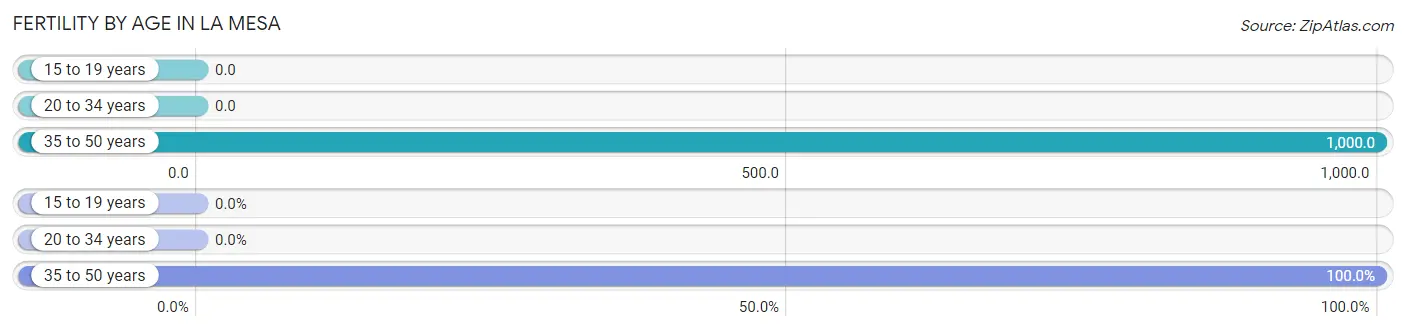
| Age Bracket | Women with Births | Births / 1,000 Women |
| 15 to 19 years | 0 (0.0%) | 0.0 |
| 20 to 34 years | 0 (0.0%) | 0.0 |
| 35 to 50 years | 9 (100.0%) | 1,000.0 |
| Total | 9 (100.0%) | 273.0 |
Fertility by Age by Marriage Status in La Mesa
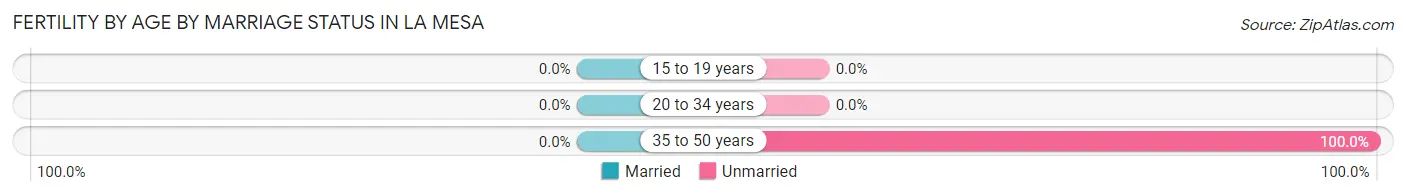
| Age Bracket | Married | Unmarried |
| 15 to 19 years | 0 (0.0%) | 0 (0.0%) |
| 20 to 34 years | 0 (0.0%) | 0 (0.0%) |
| 35 to 50 years | 0 (0.0%) | 9 (100.0%) |
| Total | 0 (0.0%) | 9 (100.0%) |
Fertility by Education in La Mesa
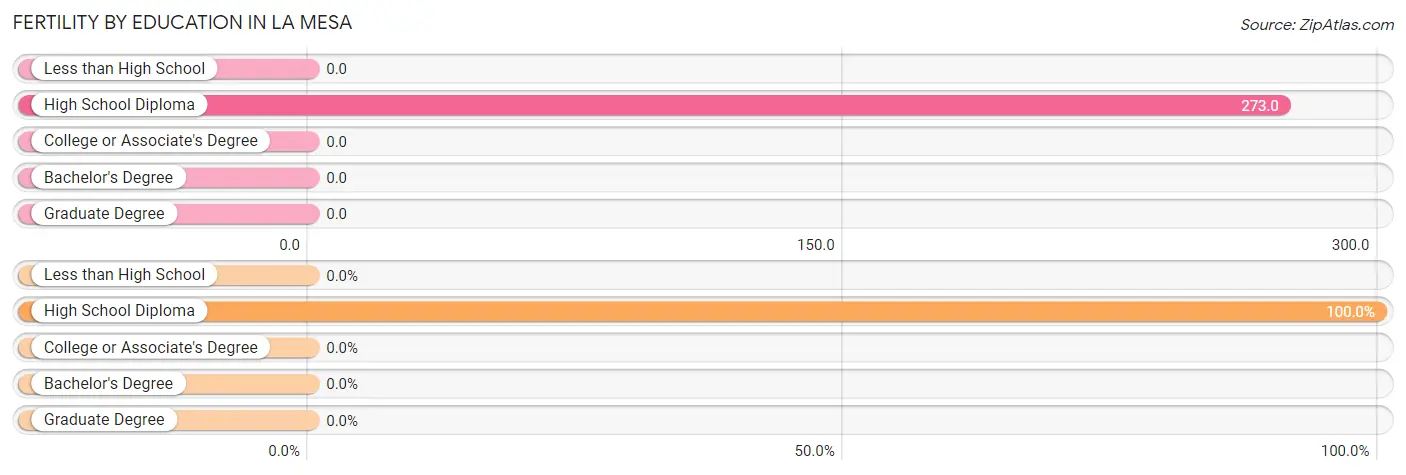
| Educational Attainment | Women with Births | Births / 1,000 Women |
| Less than High School | 0 (0.0%) | 0.0 |
| High School Diploma | 9 (100.0%) | 273.0 |
| College or Associate's Degree | 0 (0.0%) | 0.0 |
| Bachelor's Degree | 0 (0.0%) | 0.0 |
| Graduate Degree | 0 (0.0%) | 0.0 |
| Total | 9 (100.0%) | 273.0 |
Fertility by Education by Marriage Status in La Mesa
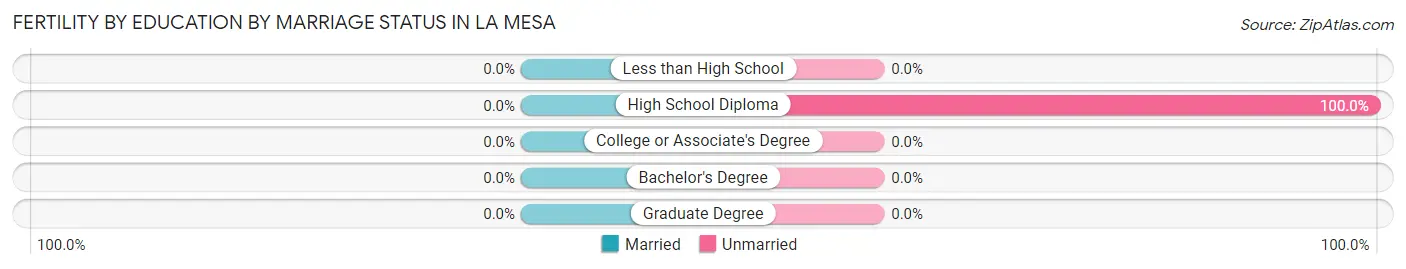
| Educational Attainment | Married | Unmarried |
| Less than High School | 0 (0.0%) | 0 (0.0%) |
| High School Diploma | 0 (0.0%) | 9 (100.0%) |
| College or Associate's Degree | 0 (0.0%) | 0 (0.0%) |
| Bachelor's Degree | 0 (0.0%) | 0 (0.0%) |
| Graduate Degree | 0 (0.0%) | 0 (0.0%) |
| Total | 0 (0.0%) | 9 (100.0%) |
Employment Characteristics in La Mesa
Employment by Class of Employer in La Mesa
Among the 165 employed individuals in La Mesa, private company employees (134 | 81.2%), not-for-profit organizations (23 | 13.9%), and self-employed (not incorporated) (8 | 4.9%) make up the most common classes of employment.
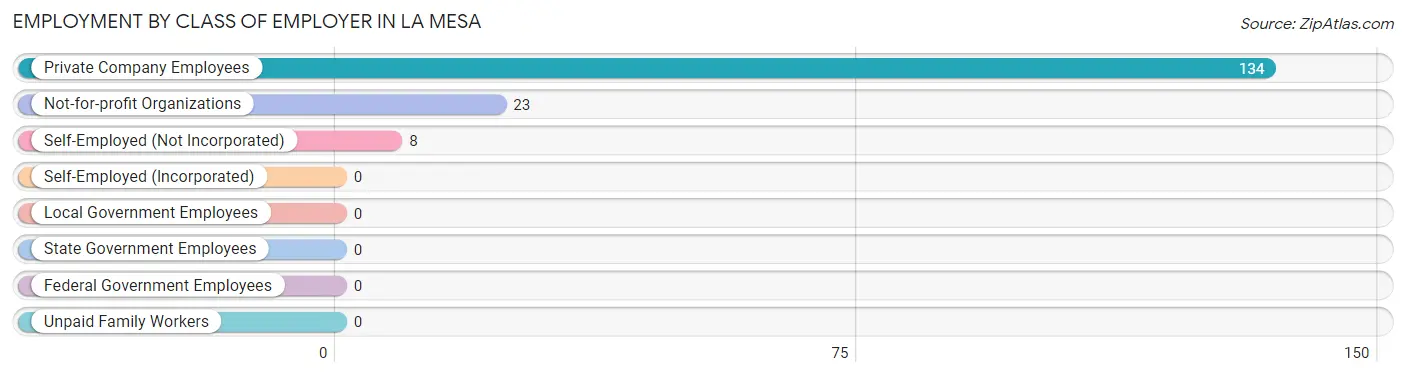
| Employer Class | # Employees | % Employees |
| Private Company Employees | 134 | 81.2% |
| Self-Employed (Incorporated) | 0 | 0.0% |
| Self-Employed (Not Incorporated) | 8 | 4.9% |
| Not-for-profit Organizations | 23 | 13.9% |
| Local Government Employees | 0 | 0.0% |
| State Government Employees | 0 | 0.0% |
| Federal Government Employees | 0 | 0.0% |
| Unpaid Family Workers | 0 | 0.0% |
| Total | 165 | 100.0% |
Employment Status by Age in La Mesa
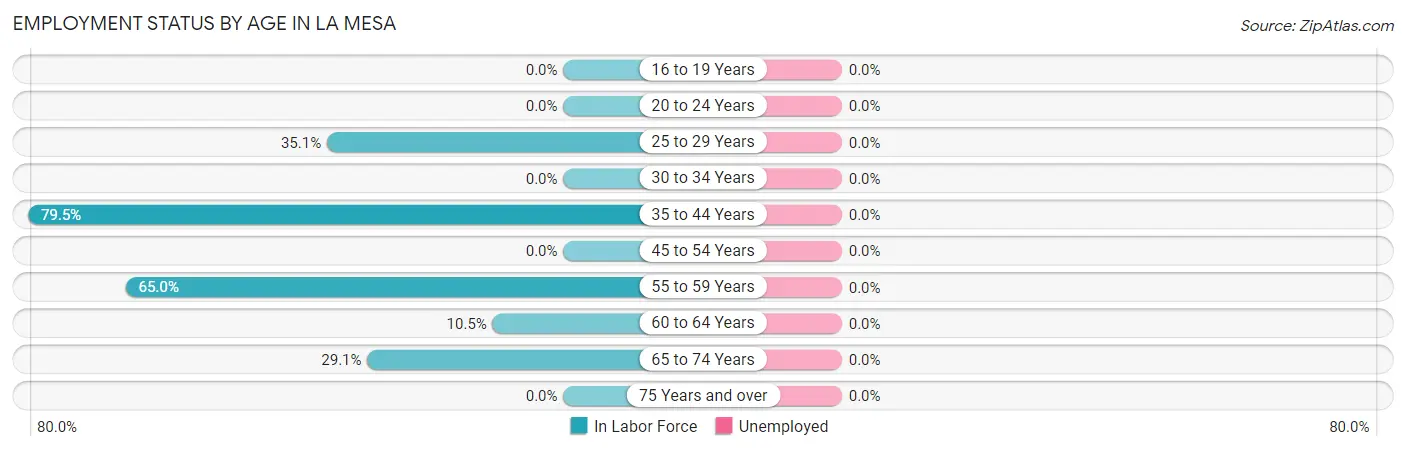
| Age Bracket | In Labor Force | Unemployed |
| 16 to 19 Years | 0 (0.0%) | 0 (0.0%) |
| 20 to 24 Years | 0 (0.0%) | 0 (0.0%) |
| 25 to 29 Years | 13 (35.1%) | 0 (0.0%) |
| 30 to 34 Years | 0 (0.0%) | 0 (0.0%) |
| 35 to 44 Years | 62 (79.5%) | 0 (0.0%) |
| 45 to 54 Years | 0 (0.0%) | 0 (0.0%) |
| 55 to 59 Years | 13 (65.0%) | 0 (0.0%) |
| 60 to 64 Years | 6 (10.5%) | 0 (0.0%) |
| 65 to 74 Years | 71 (29.1%) | 0 (0.0%) |
| 75 Years and over | 0 (0.0%) | 0 (0.0%) |
| Total | 165 (34.6%) | 0 (0.0%) |
Employment Status by Educational Attainment in La Mesa
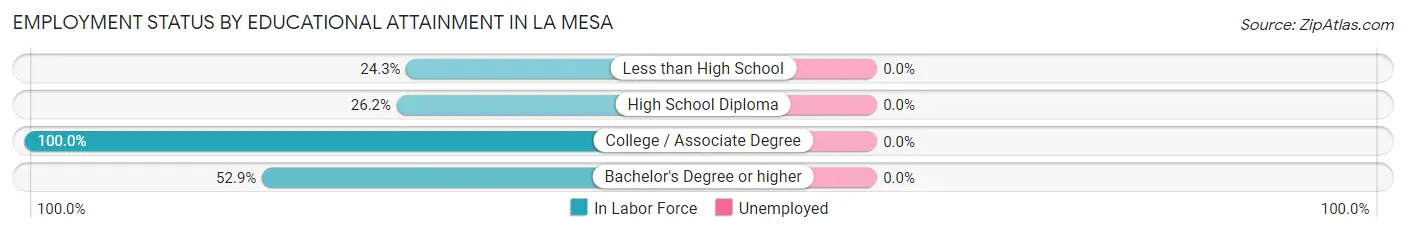
| Educational Attainment | In Labor Force | Unemployed |
| Less than High School | 9 (24.3%) | 0 (0.0%) |
| High School Diploma | 22 (26.2%) | 0 (0.0%) |
| College / Associate Degree | 54 (100.0%) | 0 (0.0%) |
| Bachelor's Degree or higher | 9 (52.9%) | 0 (0.0%) |
| Total | 94 (49.0%) | 0 (0.0%) |
Employment Occupations by Sex in La Mesa
Management, Business, Science and Arts Occupations
The most common Management, Business, Science and Arts occupations in La Mesa are , and Management (3 | 1.8%).
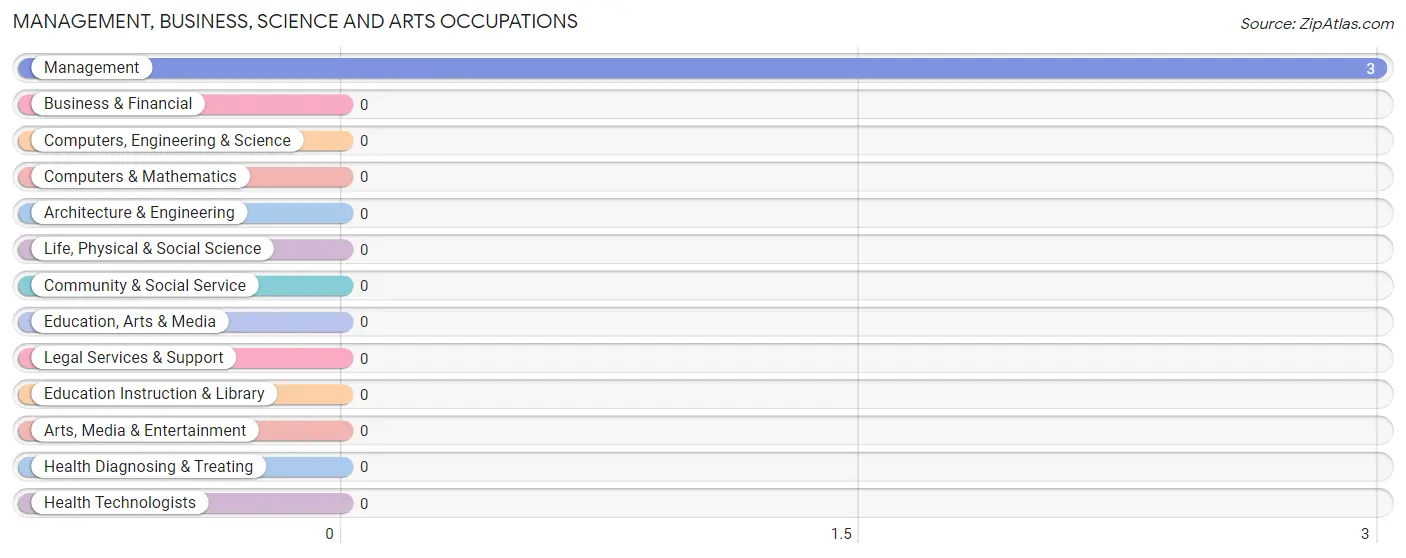
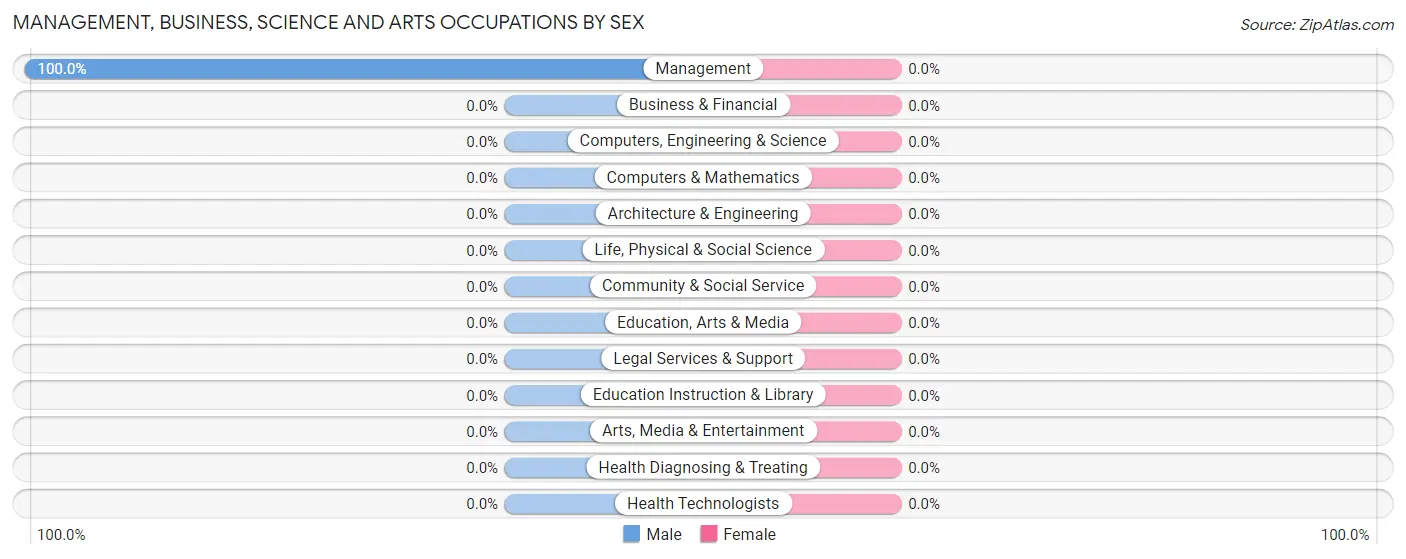
Management, Business, Science and Arts Occupations by Sex
| Occupation | Male | Female |
| Management | 3 (100.0%) | 0 (0.0%) |
| Business & Financial | 0 (0.0%) | 0 (0.0%) |
| Computers, Engineering & Science | 0 (0.0%) | 0 (0.0%) |
| Computers & Mathematics | 0 (0.0%) | 0 (0.0%) |
| Architecture & Engineering | 0 (0.0%) | 0 (0.0%) |
| Life, Physical & Social Science | 0 (0.0%) | 0 (0.0%) |
| Community & Social Service | 0 (0.0%) | 0 (0.0%) |
| Education, Arts & Media | 0 (0.0%) | 0 (0.0%) |
| Legal Services & Support | 0 (0.0%) | 0 (0.0%) |
| Education Instruction & Library | 0 (0.0%) | 0 (0.0%) |
| Arts, Media & Entertainment | 0 (0.0%) | 0 (0.0%) |
| Health Diagnosing & Treating | 0 (0.0%) | 0 (0.0%) |
| Health Technologists | 0 (0.0%) | 0 (0.0%) |
| Total (Category) | 3 (100.0%) | 0 (0.0%) |
| Total (Overall) | 128 (77.6%) | 37 (22.4%) |
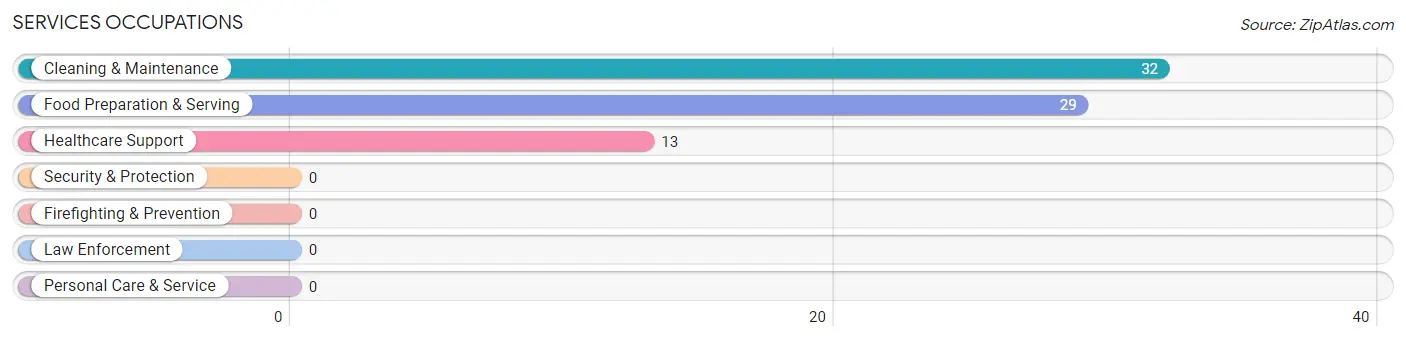
Services Occupations
The most common Services occupations in La Mesa are Cleaning & Maintenance (32 | 19.4%), Food Preparation & Serving (29 | 17.6%), and Healthcare Support (13 | 7.9%).
Services Occupations by Sex
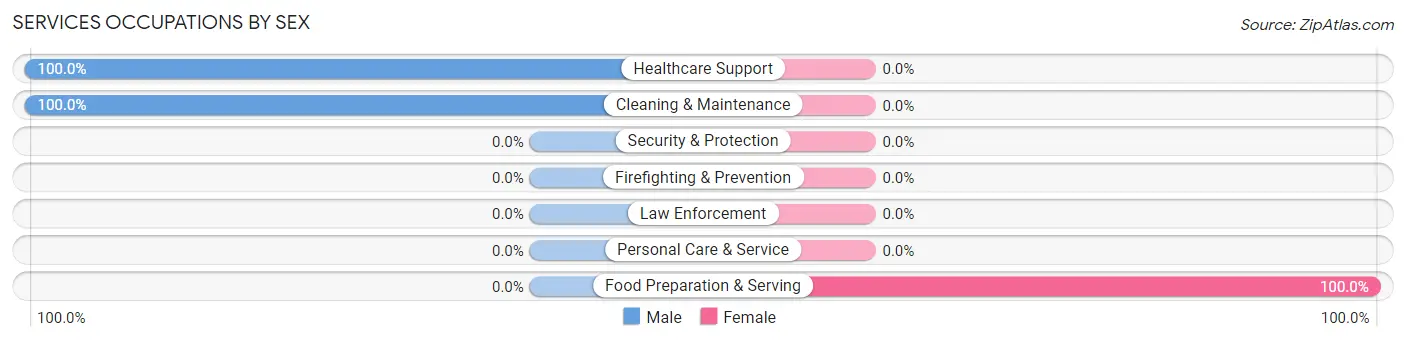
| Occupation | Male | Female |
| Healthcare Support | 13 (100.0%) | 0 (0.0%) |
| Security & Protection | 0 (0.0%) | 0 (0.0%) |
| Firefighting & Prevention | 0 (0.0%) | 0 (0.0%) |
| Law Enforcement | 0 (0.0%) | 0 (0.0%) |
| Food Preparation & Serving | 0 (0.0%) | 29 (100.0%) |
| Cleaning & Maintenance | 32 (100.0%) | 0 (0.0%) |
| Personal Care & Service | 0 (0.0%) | 0 (0.0%) |
| Total (Category) | 45 (60.8%) | 29 (39.2%) |
| Total (Overall) | 128 (77.6%) | 37 (22.4%) |
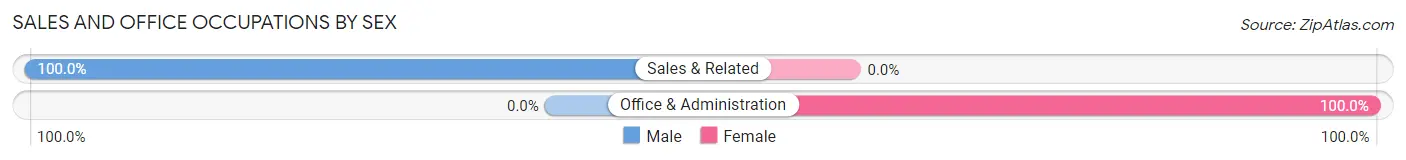
Sales and Office Occupations
The most common Sales and Office occupations in La Mesa are Office & Administration (8 | 4.9%), and Sales & Related (6 | 3.6%).
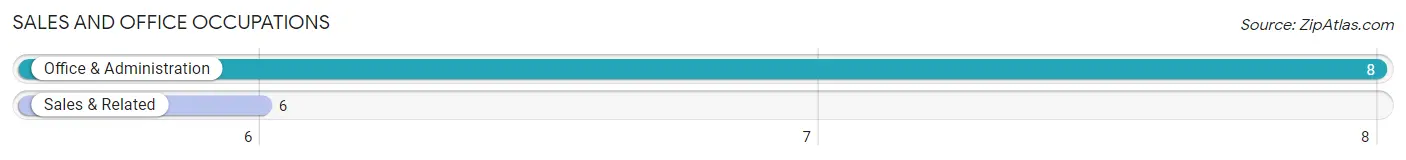
Sales and Office Occupations by Sex
| Occupation | Male | Female |
| Sales & Related | 6 (100.0%) | 0 (0.0%) |
| Office & Administration | 0 (0.0%) | 8 (100.0%) |
| Total (Category) | 6 (42.9%) | 8 (57.1%) |
| Total (Overall) | 128 (77.6%) | 37 (22.4%) |
Natural Resources, Construction and Maintenance Occupations
The most common Natural Resources, Construction and Maintenance occupations in La Mesa are , and Construction & Extraction (9 | 5.4%).
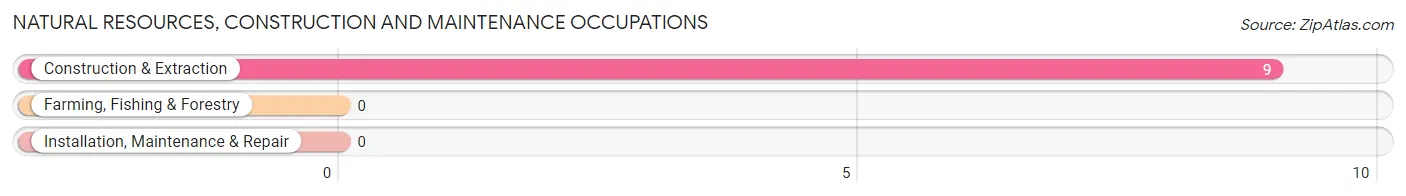
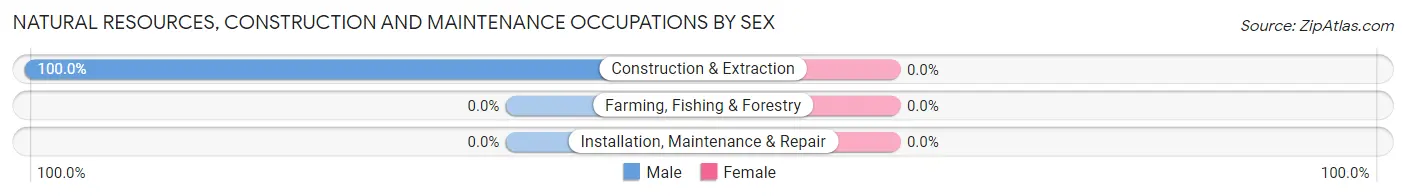
Natural Resources, Construction and Maintenance Occupations by Sex
| Occupation | Male | Female |
| Farming, Fishing & Forestry | 0 (0.0%) | 0 (0.0%) |
| Construction & Extraction | 9 (100.0%) | 0 (0.0%) |
| Installation, Maintenance & Repair | 0 (0.0%) | 0 (0.0%) |
| Total (Category) | 9 (100.0%) | 0 (0.0%) |
| Total (Overall) | 128 (77.6%) | 37 (22.4%) |
Production, Transportation and Moving Occupations
The most common Production, Transportation and Moving occupations in La Mesa are Transportation (44 | 26.7%), and Production (21 | 12.7%).
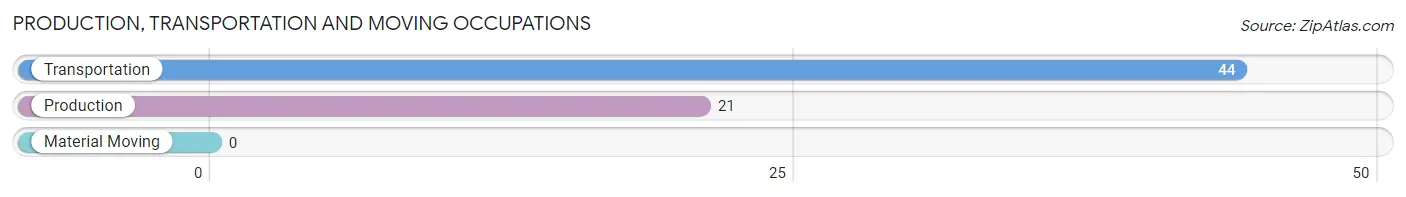
Production, Transportation and Moving Occupations by Sex
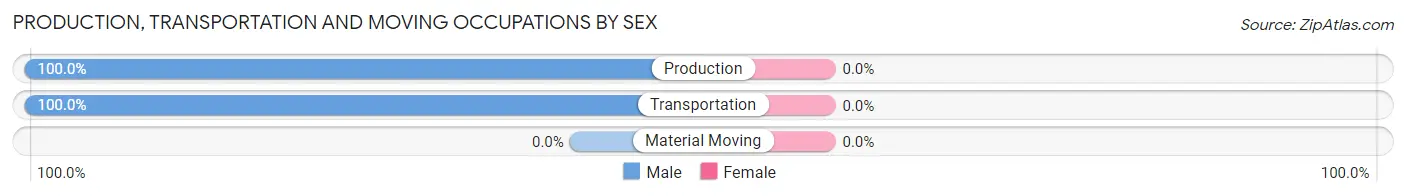
| Occupation | Male | Female |
| Production | 21 (100.0%) | 0 (0.0%) |
| Transportation | 44 (100.0%) | 0 (0.0%) |
| Material Moving | 0 (0.0%) | 0 (0.0%) |
| Total (Category) | 65 (100.0%) | 0 (0.0%) |
| Total (Overall) | 128 (77.6%) | 37 (22.4%) |
Employment Industries by Sex in La Mesa
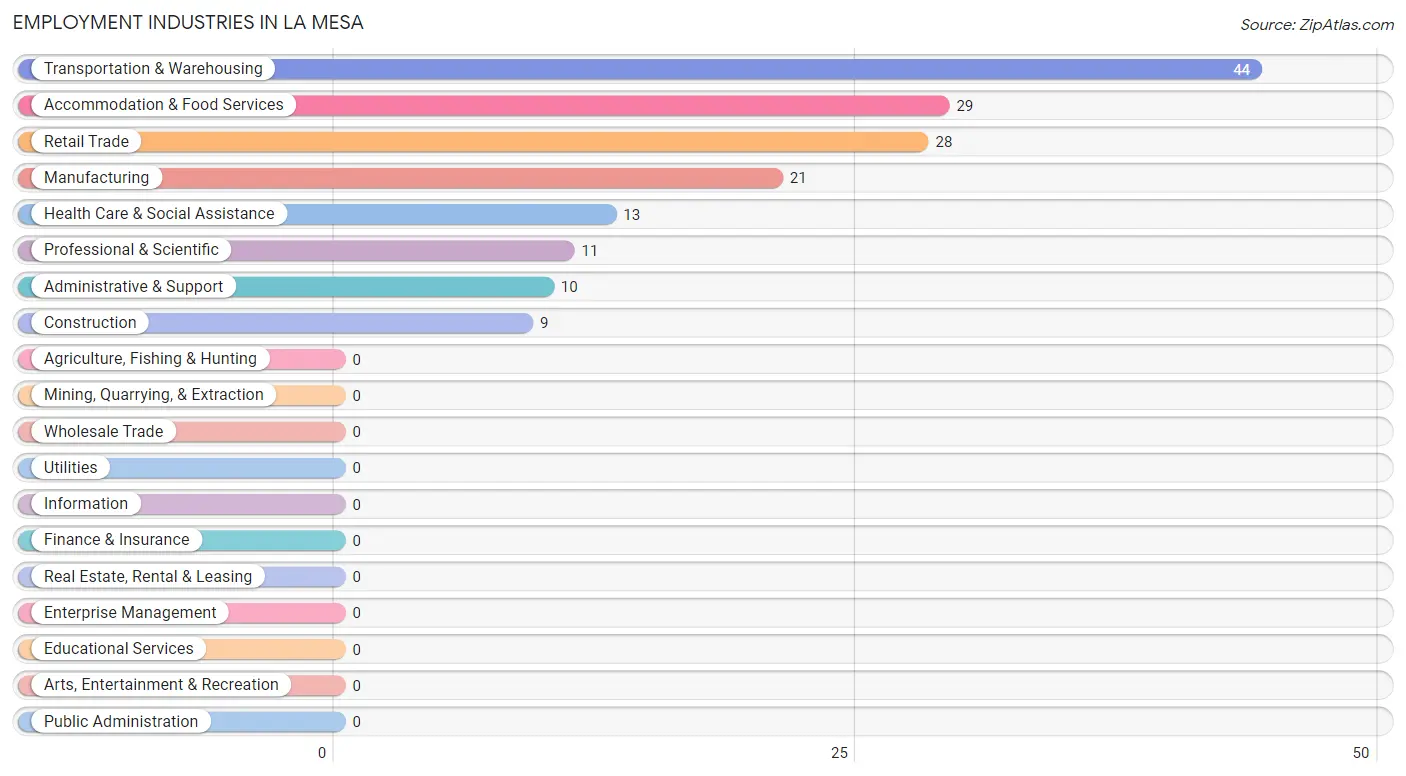
Employment Industries in La Mesa
The major employment industries in La Mesa include Transportation & Warehousing (44 | 26.7%), Accommodation & Food Services (29 | 17.6%), Retail Trade (28 | 17.0%), Manufacturing (21 | 12.7%), and Health Care & Social Assistance (13 | 7.9%).
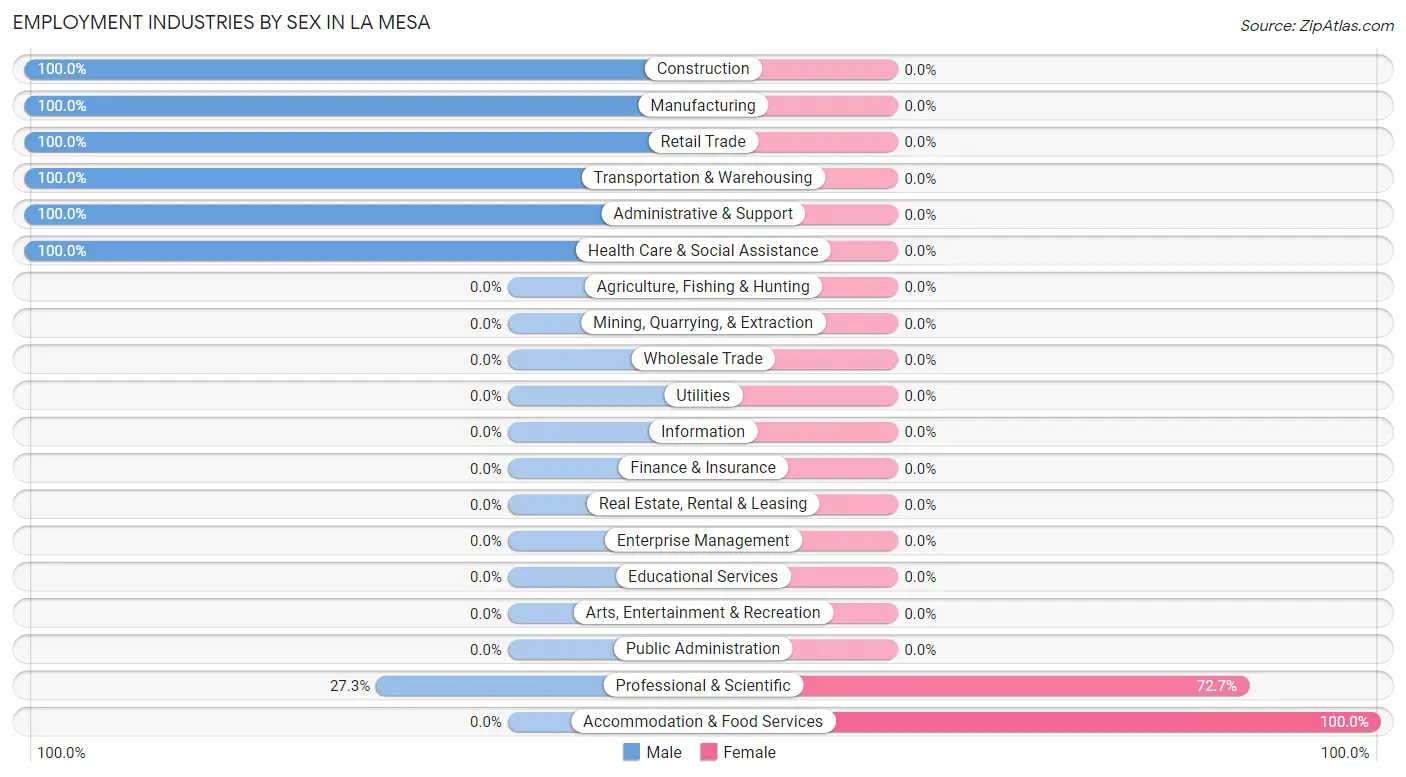
Employment Industries by Sex in La Mesa
The La Mesa industries that see more men than women are Construction (100.0%), Manufacturing (100.0%), and Retail Trade (100.0%), whereas the industries that tend to have a higher number of women are Accommodation & Food Services (100.0%), and Professional & Scientific (72.7%).
| Industry | Male | Female |
| Agriculture, Fishing & Hunting | 0 (0.0%) | 0 (0.0%) |
| Mining, Quarrying, & Extraction | 0 (0.0%) | 0 (0.0%) |
| Construction | 9 (100.0%) | 0 (0.0%) |
| Manufacturing | 21 (100.0%) | 0 (0.0%) |
| Wholesale Trade | 0 (0.0%) | 0 (0.0%) |
| Retail Trade | 28 (100.0%) | 0 (0.0%) |
| Transportation & Warehousing | 44 (100.0%) | 0 (0.0%) |
| Utilities | 0 (0.0%) | 0 (0.0%) |
| Information | 0 (0.0%) | 0 (0.0%) |
| Finance & Insurance | 0 (0.0%) | 0 (0.0%) |
| Real Estate, Rental & Leasing | 0 (0.0%) | 0 (0.0%) |
| Professional & Scientific | 3 (27.3%) | 8 (72.7%) |
| Enterprise Management | 0 (0.0%) | 0 (0.0%) |
| Administrative & Support | 10 (100.0%) | 0 (0.0%) |
| Educational Services | 0 (0.0%) | 0 (0.0%) |
| Health Care & Social Assistance | 13 (100.0%) | 0 (0.0%) |
| Arts, Entertainment & Recreation | 0 (0.0%) | 0 (0.0%) |
| Accommodation & Food Services | 0 (0.0%) | 29 (100.0%) |
| Public Administration | 0 (0.0%) | 0 (0.0%) |
| Total | 128 (77.6%) | 37 (22.4%) |
Education in La Mesa
School Enrollment in La Mesa
The most common levels of schooling among the 146 students in La Mesa are middle school (104 | 71.2%), college / undergraduate (25 | 17.1%), and elementary school (9 | 6.2%).
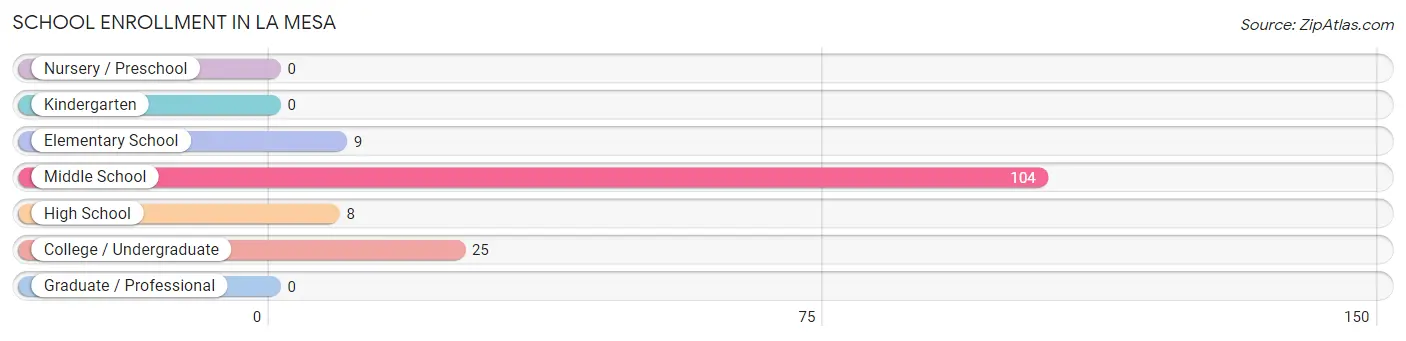
| School Level | # Students | % Students |
| Nursery / Preschool | 0 | 0.0% |
| Kindergarten | 0 | 0.0% |
| Elementary School | 9 | 6.2% |
| Middle School | 104 | 71.2% |
| High School | 8 | 5.5% |
| College / Undergraduate | 25 | 17.1% |
| Graduate / Professional | 0 | 0.0% |
| Total | 146 | 100.0% |
School Enrollment by Age by Funding Source in La Mesa
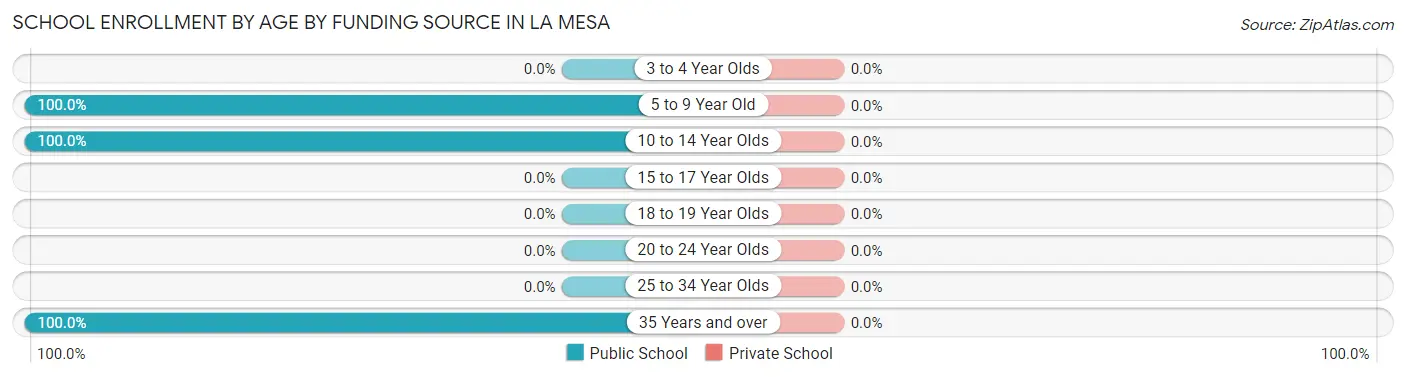
| Age Bracket | Public School | Private School |
| 3 to 4 Year Olds | 0 (0.0%) | 0 (0.0%) |
| 5 to 9 Year Old | 9 (100.0%) | 0 (0.0%) |
| 10 to 14 Year Olds | 112 (100.0%) | 0 (0.0%) |
| 15 to 17 Year Olds | 0 (0.0%) | 0 (0.0%) |
| 18 to 19 Year Olds | 0 (0.0%) | 0 (0.0%) |
| 20 to 24 Year Olds | 0 (0.0%) | 0 (0.0%) |
| 25 to 34 Year Olds | 0 (0.0%) | 0 (0.0%) |
| 35 Years and over | 25 (100.0%) | 0 (0.0%) |
| Total | 146 (100.0%) | 0 (0.0%) |
Educational Attainment by Field of Study in La Mesa
Literature & languages (8 | 36.4%), business (6 | 27.3%), education (5 | 22.7%), and science & technology (3 | 13.6%) are the most common fields of study among 22 individuals in La Mesa who have obtained a bachelor's degree or higher.
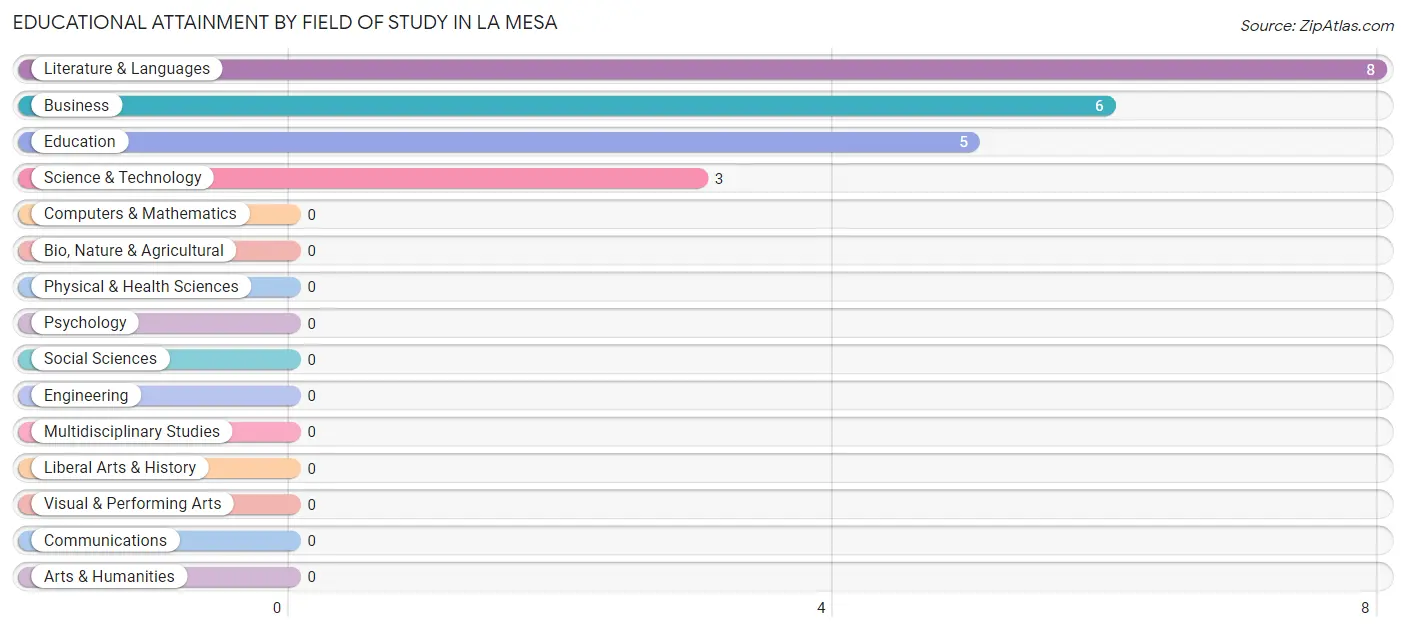
| Field of Study | # Graduates | % Graduates |
| Computers & Mathematics | 0 | 0.0% |
| Bio, Nature & Agricultural | 0 | 0.0% |
| Physical & Health Sciences | 0 | 0.0% |
| Psychology | 0 | 0.0% |
| Social Sciences | 0 | 0.0% |
| Engineering | 0 | 0.0% |
| Multidisciplinary Studies | 0 | 0.0% |
| Science & Technology | 3 | 13.6% |
| Business | 6 | 27.3% |
| Education | 5 | 22.7% |
| Literature & Languages | 8 | 36.4% |
| Liberal Arts & History | 0 | 0.0% |
| Visual & Performing Arts | 0 | 0.0% |
| Communications | 0 | 0.0% |
| Arts & Humanities | 0 | 0.0% |
| Total | 22 | 100.0% |
Transportation & Commute in La Mesa
Vehicle Availability by Sex in La Mesa
The most prevalent vehicle ownership categories in La Mesa are males with 4 vehicles (74, accounting for 57.8%) and females with 4 vehicles (0, making up 200.0%).
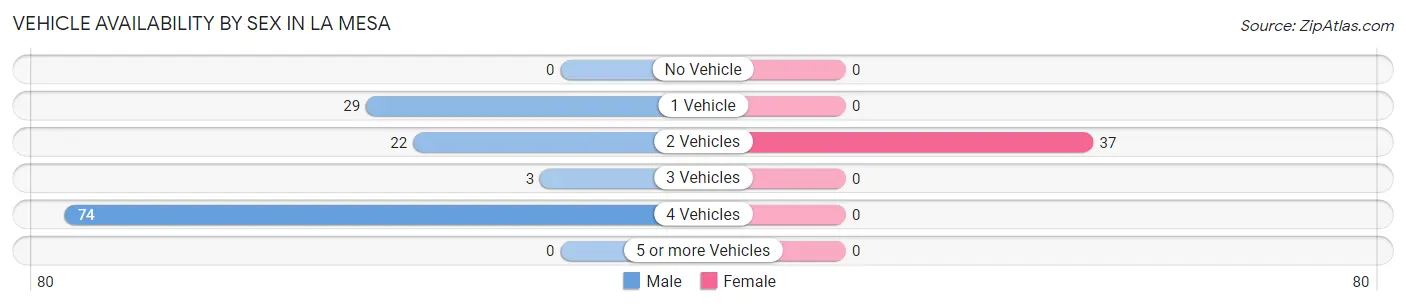
| Vehicles Available | Male | Female |
| No Vehicle | 0 (0.0%) | 0 (0.0%) |
| 1 Vehicle | 29 (22.7%) | 0 (0.0%) |
| 2 Vehicles | 22 (17.2%) | 37 (100.0%) |
| 3 Vehicles | 3 (2.3%) | 0 (0.0%) |
| 4 Vehicles | 74 (57.8%) | 0 (0.0%) |
| 5 or more Vehicles | 0 (0.0%) | 0 (0.0%) |
| Total | 128 (100.0%) | 37 (100.0%) |
Commute Time in La Mesa
The most frequently occuring commute durations in La Mesa are 20 to 24 minutes (71 commuters, 45.5%), 5 to 9 minutes (28 commuters, 17.9%), and 10 to 14 minutes (22 commuters, 14.1%).
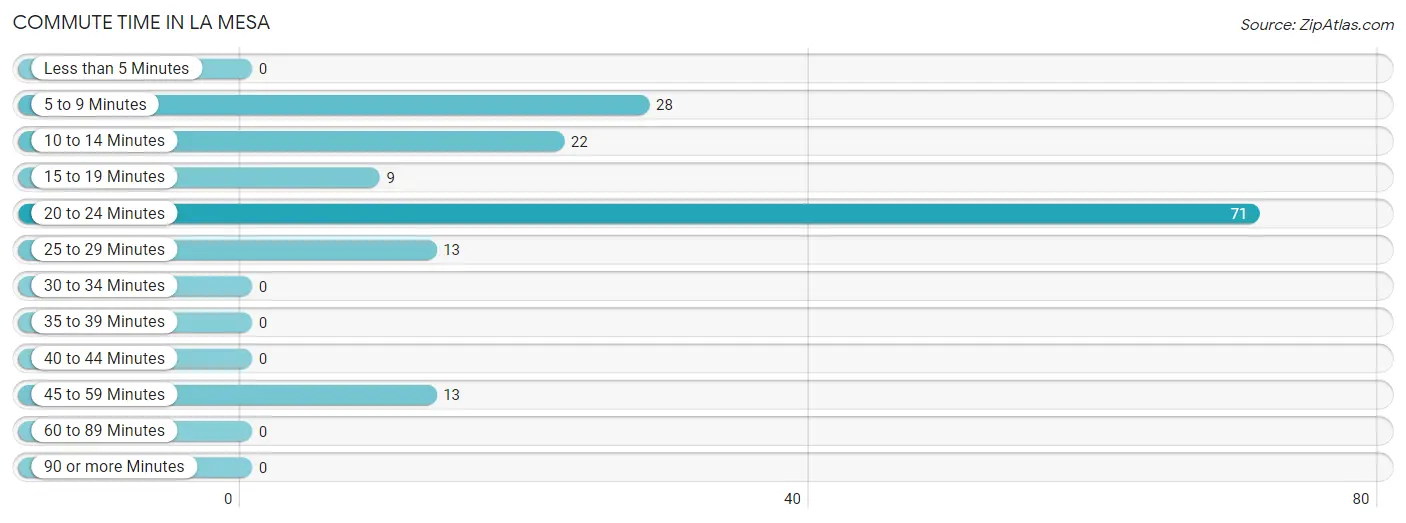
| Commute Time | # Commuters | % Commuters |
| Less than 5 Minutes | 0 | 0.0% |
| 5 to 9 Minutes | 28 | 17.9% |
| 10 to 14 Minutes | 22 | 14.1% |
| 15 to 19 Minutes | 9 | 5.8% |
| 20 to 24 Minutes | 71 | 45.5% |
| 25 to 29 Minutes | 13 | 8.3% |
| 30 to 34 Minutes | 0 | 0.0% |
| 35 to 39 Minutes | 0 | 0.0% |
| 40 to 44 Minutes | 0 | 0.0% |
| 45 to 59 Minutes | 13 | 8.3% |
| 60 to 89 Minutes | 0 | 0.0% |
| 90 or more Minutes | 0 | 0.0% |
Commute Time by Sex in La Mesa
The most common commute times in La Mesa are 20 to 24 minutes (71 commuters, 55.5%) for males and 5 to 9 minutes (28 commuters, 100.0%) for females.
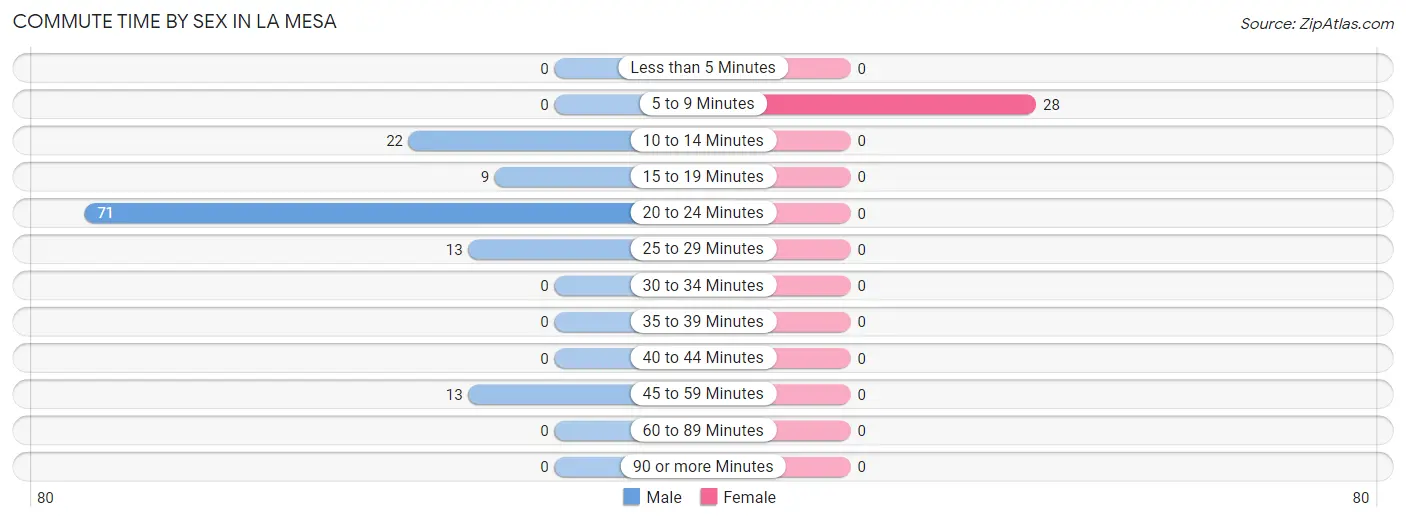
| Commute Time | Male | Female |
| Less than 5 Minutes | 0 (0.0%) | 0 (0.0%) |
| 5 to 9 Minutes | 0 (0.0%) | 28 (100.0%) |
| 10 to 14 Minutes | 22 (17.2%) | 0 (0.0%) |
| 15 to 19 Minutes | 9 (7.0%) | 0 (0.0%) |
| 20 to 24 Minutes | 71 (55.5%) | 0 (0.0%) |
| 25 to 29 Minutes | 13 (10.2%) | 0 (0.0%) |
| 30 to 34 Minutes | 0 (0.0%) | 0 (0.0%) |
| 35 to 39 Minutes | 0 (0.0%) | 0 (0.0%) |
| 40 to 44 Minutes | 0 (0.0%) | 0 (0.0%) |
| 45 to 59 Minutes | 13 (10.2%) | 0 (0.0%) |
| 60 to 89 Minutes | 0 (0.0%) | 0 (0.0%) |
| 90 or more Minutes | 0 (0.0%) | 0 (0.0%) |
Time of Departure to Work by Sex in La Mesa
The most frequent times of departure to work in La Mesa are 6:30 AM to 6:59 AM (44, 34.4%) for males and 4:00 PM to 11:59 PM (20, 71.4%) for females.
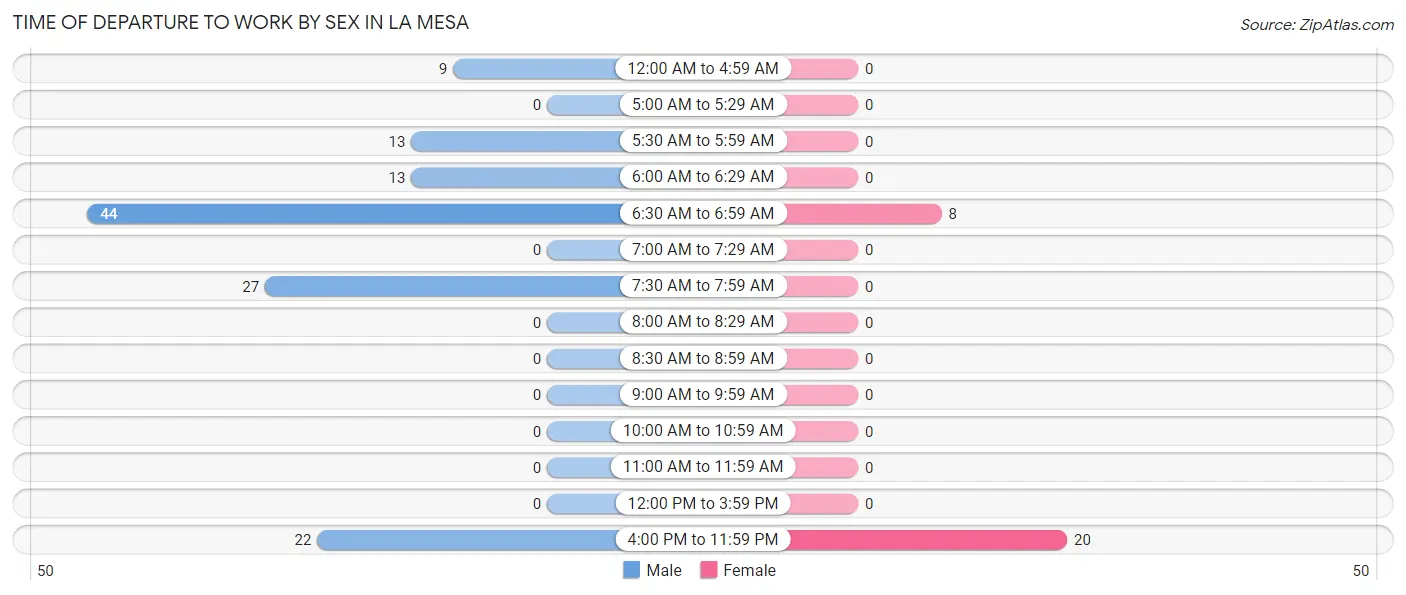
| Time of Departure | Male | Female |
| 12:00 AM to 4:59 AM | 9 (7.0%) | 0 (0.0%) |
| 5:00 AM to 5:29 AM | 0 (0.0%) | 0 (0.0%) |
| 5:30 AM to 5:59 AM | 13 (10.2%) | 0 (0.0%) |
| 6:00 AM to 6:29 AM | 13 (10.2%) | 0 (0.0%) |
| 6:30 AM to 6:59 AM | 44 (34.4%) | 8 (28.6%) |
| 7:00 AM to 7:29 AM | 0 (0.0%) | 0 (0.0%) |
| 7:30 AM to 7:59 AM | 27 (21.1%) | 0 (0.0%) |
| 8:00 AM to 8:29 AM | 0 (0.0%) | 0 (0.0%) |
| 8:30 AM to 8:59 AM | 0 (0.0%) | 0 (0.0%) |
| 9:00 AM to 9:59 AM | 0 (0.0%) | 0 (0.0%) |
| 10:00 AM to 10:59 AM | 0 (0.0%) | 0 (0.0%) |
| 11:00 AM to 11:59 AM | 0 (0.0%) | 0 (0.0%) |
| 12:00 PM to 3:59 PM | 0 (0.0%) | 0 (0.0%) |
| 4:00 PM to 11:59 PM | 22 (17.2%) | 20 (71.4%) |
| Total | 128 (100.0%) | 28 (100.0%) |
Housing Occupancy in La Mesa
Occupancy by Ownership in La Mesa
Of the total 261 dwellings in La Mesa, owner-occupied units account for 203 (77.8%), while renter-occupied units make up 58 (22.2%).
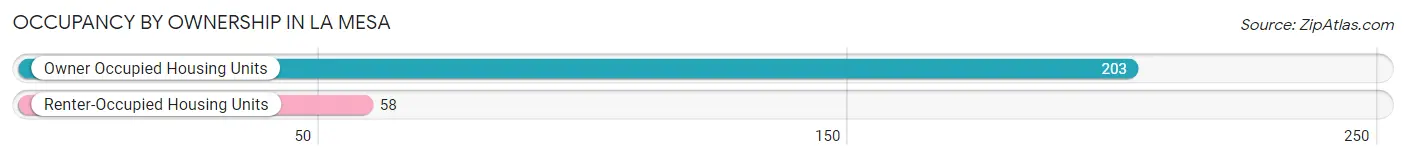
| Occupancy | # Housing Units | % Housing Units |
| Owner Occupied Housing Units | 203 | 77.8% |
| Renter-Occupied Housing Units | 58 | 22.2% |
| Total Occupied Housing Units | 261 | 100.0% |
Occupancy by Household Size in La Mesa
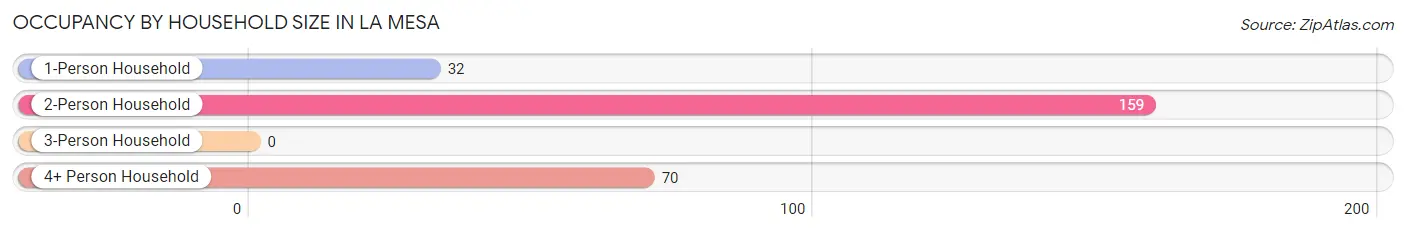
| Household Size | # Housing Units | % Housing Units |
| 1-Person Household | 32 | 12.3% |
| 2-Person Household | 159 | 60.9% |
| 3-Person Household | 0 | 0.0% |
| 4+ Person Household | 70 | 26.8% |
| Total Housing Units | 261 | 100.0% |
Occupancy by Ownership by Household Size in La Mesa
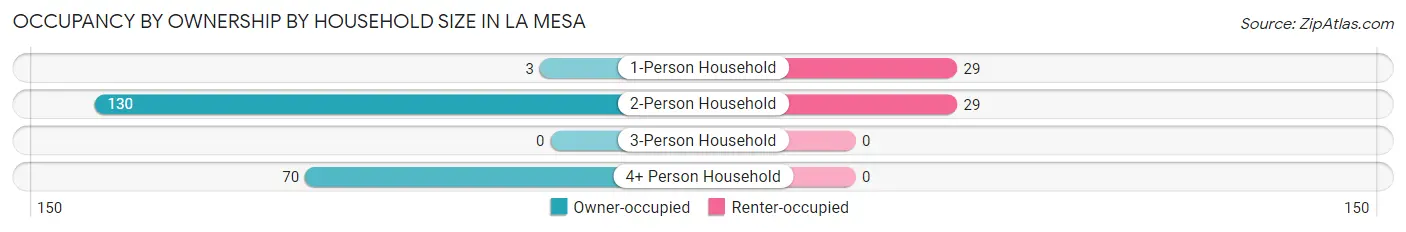
| Household Size | Owner-occupied | Renter-occupied |
| 1-Person Household | 3 (9.4%) | 29 (90.6%) |
| 2-Person Household | 130 (81.8%) | 29 (18.2%) |
| 3-Person Household | 0 (0.0%) | 0 (0.0%) |
| 4+ Person Household | 70 (100.0%) | 0 (0.0%) |
| Total Housing Units | 203 (77.8%) | 58 (22.2%) |
Occupancy by Educational Attainment in La Mesa
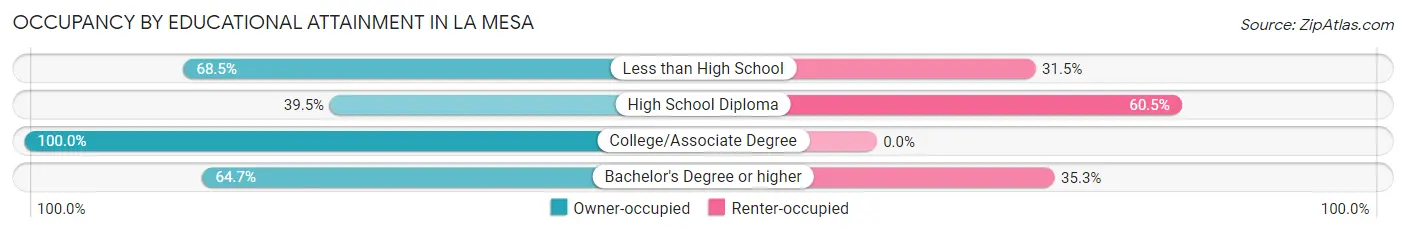
| Household Size | Owner-occupied | Renter-occupied |
| Less than High School | 63 (68.5%) | 29 (31.5%) |
| High School Diploma | 15 (39.5%) | 23 (60.5%) |
| College/Associate Degree | 114 (100.0%) | 0 (0.0%) |
| Bachelor's Degree or higher | 11 (64.7%) | 6 (35.3%) |
Occupancy by Age of Householder in La Mesa
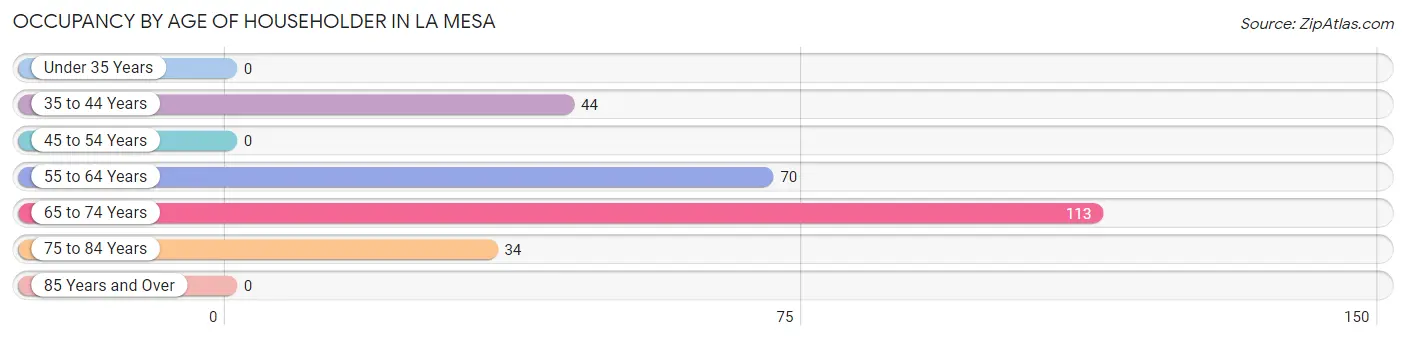
| Age Bracket | # Households | % Households |
| Under 35 Years | 0 | 0.0% |
| 35 to 44 Years | 44 | 16.9% |
| 45 to 54 Years | 0 | 0.0% |
| 55 to 64 Years | 70 | 26.8% |
| 65 to 74 Years | 113 | 43.3% |
| 75 to 84 Years | 34 | 13.0% |
| 85 Years and Over | 0 | 0.0% |
| Total | 261 | 100.0% |
Housing Finances in La Mesa
Median Income by Occupancy in La Mesa
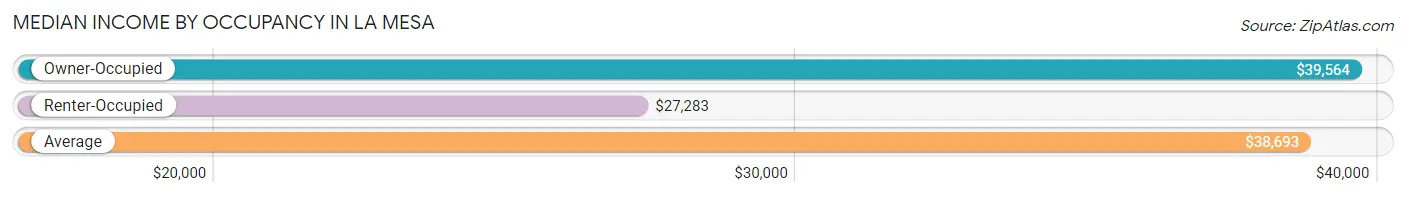
| Occupancy Type | # Households | Median Income |
| Owner-Occupied | 203 (77.8%) | $39,564 |
| Renter-Occupied | 58 (22.2%) | $27,283 |
| Average | 261 (100.0%) | $38,693 |
Occupancy by Householder Income Bracket in La Mesa
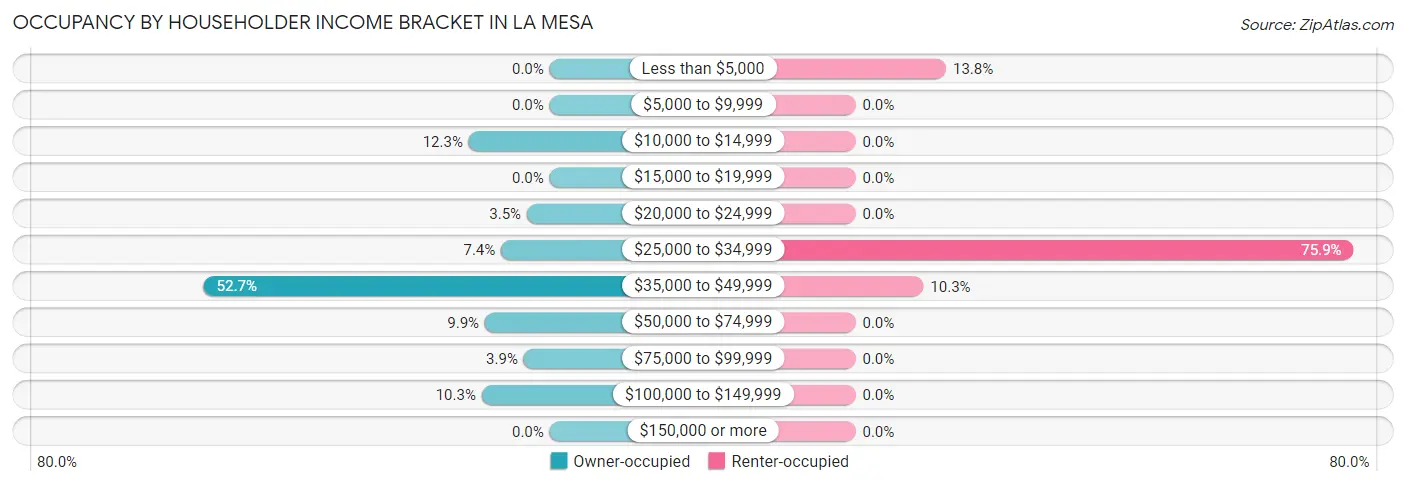
| Income Bracket | Owner-occupied | Renter-occupied |
| Less than $5,000 | 0 (0.0%) | 8 (13.8%) |
| $5,000 to $9,999 | 0 (0.0%) | 0 (0.0%) |
| $10,000 to $14,999 | 25 (12.3%) | 0 (0.0%) |
| $15,000 to $19,999 | 0 (0.0%) | 0 (0.0%) |
| $20,000 to $24,999 | 7 (3.5%) | 0 (0.0%) |
| $25,000 to $34,999 | 15 (7.4%) | 44 (75.9%) |
| $35,000 to $49,999 | 107 (52.7%) | 6 (10.3%) |
| $50,000 to $74,999 | 20 (9.9%) | 0 (0.0%) |
| $75,000 to $99,999 | 8 (3.9%) | 0 (0.0%) |
| $100,000 to $149,999 | 21 (10.3%) | 0 (0.0%) |
| $150,000 or more | 0 (0.0%) | 0 (0.0%) |
| Total | 203 (100.0%) | 58 (100.0%) |
Monthly Housing Cost Tiers in La Mesa
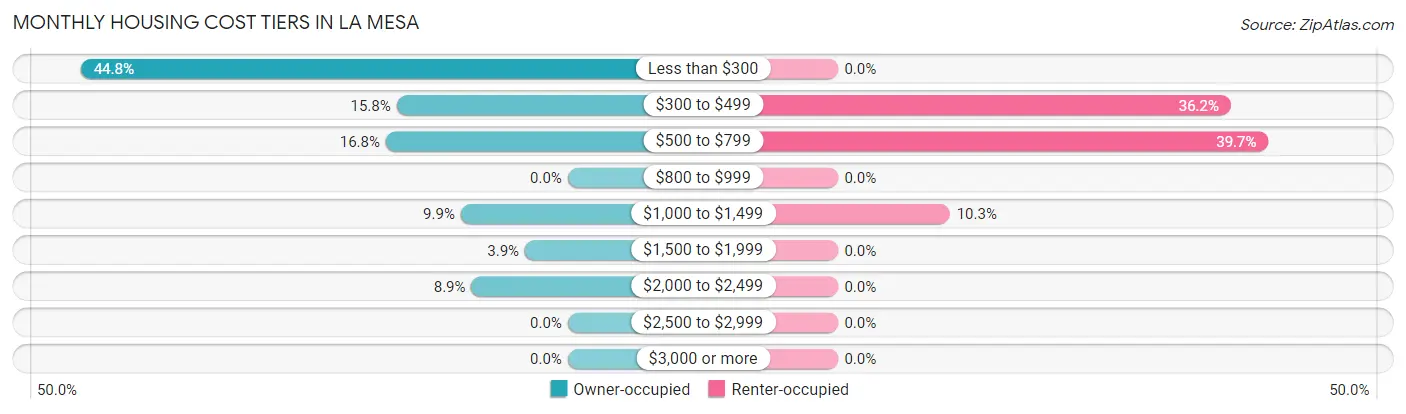
| Monthly Cost | Owner-occupied | Renter-occupied |
| Less than $300 | 91 (44.8%) | 0 (0.0%) |
| $300 to $499 | 32 (15.8%) | 21 (36.2%) |
| $500 to $799 | 34 (16.8%) | 23 (39.7%) |
| $800 to $999 | 0 (0.0%) | 0 (0.0%) |
| $1,000 to $1,499 | 20 (9.9%) | 6 (10.3%) |
| $1,500 to $1,999 | 8 (3.9%) | 0 (0.0%) |
| $2,000 to $2,499 | 18 (8.9%) | 0 (0.0%) |
| $2,500 to $2,999 | 0 (0.0%) | 0 (0.0%) |
| $3,000 or more | 0 (0.0%) | 0 (0.0%) |
| Total | 203 (100.0%) | 58 (100.0%) |
Physical Housing Characteristics in La Mesa
Housing Structures in La Mesa
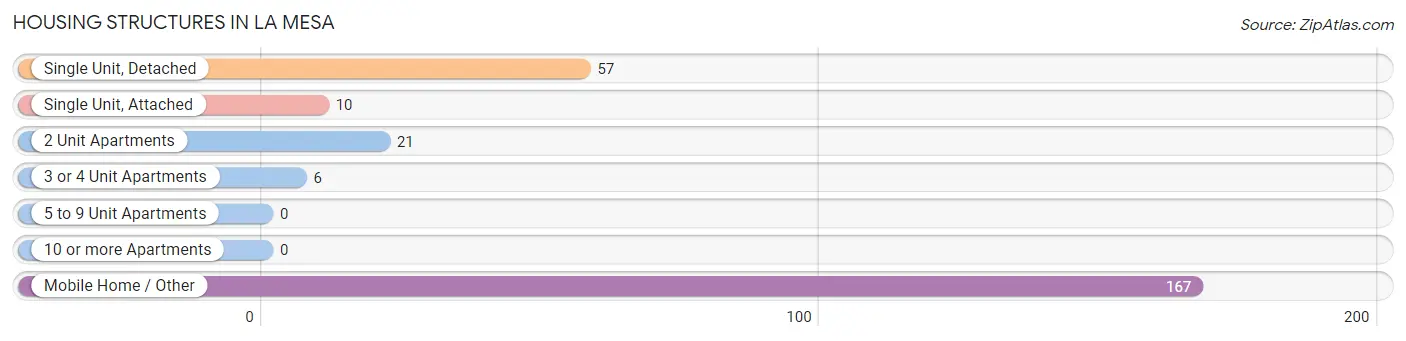
| Structure Type | # Housing Units | % Housing Units |
| Single Unit, Detached | 57 | 21.8% |
| Single Unit, Attached | 10 | 3.8% |
| 2 Unit Apartments | 21 | 8.1% |
| 3 or 4 Unit Apartments | 6 | 2.3% |
| 5 to 9 Unit Apartments | 0 | 0.0% |
| 10 or more Apartments | 0 | 0.0% |
| Mobile Home / Other | 167 | 64.0% |
| Total | 261 | 100.0% |
Housing Structures by Occupancy in La Mesa
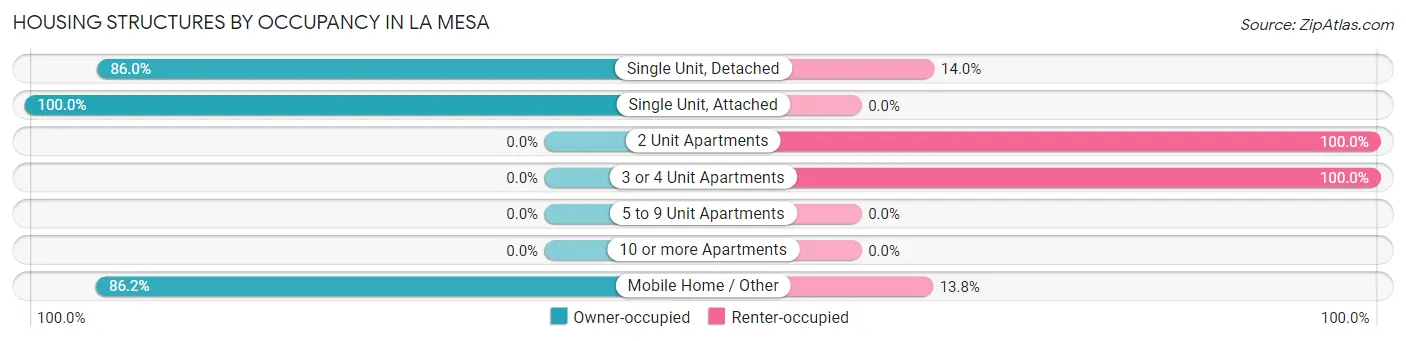
| Structure Type | Owner-occupied | Renter-occupied |
| Single Unit, Detached | 49 (86.0%) | 8 (14.0%) |
| Single Unit, Attached | 10 (100.0%) | 0 (0.0%) |
| 2 Unit Apartments | 0 (0.0%) | 21 (100.0%) |
| 3 or 4 Unit Apartments | 0 (0.0%) | 6 (100.0%) |
| 5 to 9 Unit Apartments | 0 (0.0%) | 0 (0.0%) |
| 10 or more Apartments | 0 (0.0%) | 0 (0.0%) |
| Mobile Home / Other | 144 (86.2%) | 23 (13.8%) |
| Total | 203 (77.8%) | 58 (22.2%) |
Housing Structures by Number of Rooms in La Mesa
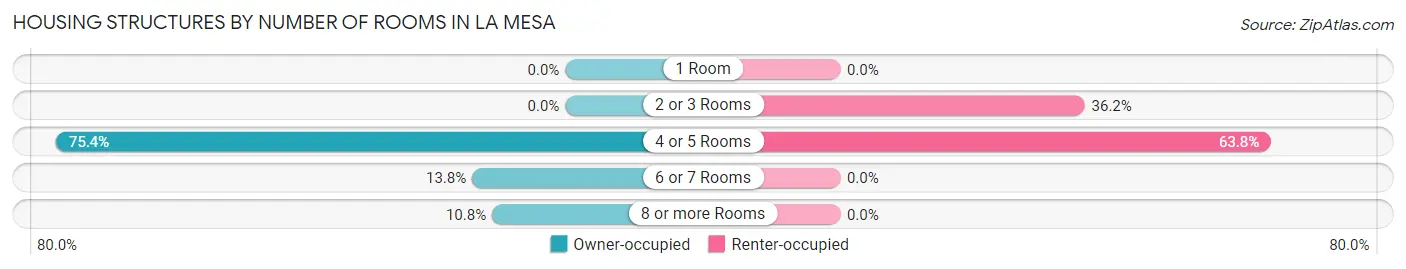
| Number of Rooms | Owner-occupied | Renter-occupied |
| 1 Room | 0 (0.0%) | 0 (0.0%) |
| 2 or 3 Rooms | 0 (0.0%) | 21 (36.2%) |
| 4 or 5 Rooms | 153 (75.4%) | 37 (63.8%) |
| 6 or 7 Rooms | 28 (13.8%) | 0 (0.0%) |
| 8 or more Rooms | 22 (10.8%) | 0 (0.0%) |
| Total | 203 (100.0%) | 58 (100.0%) |
Housing Structure by Heating Type in La Mesa
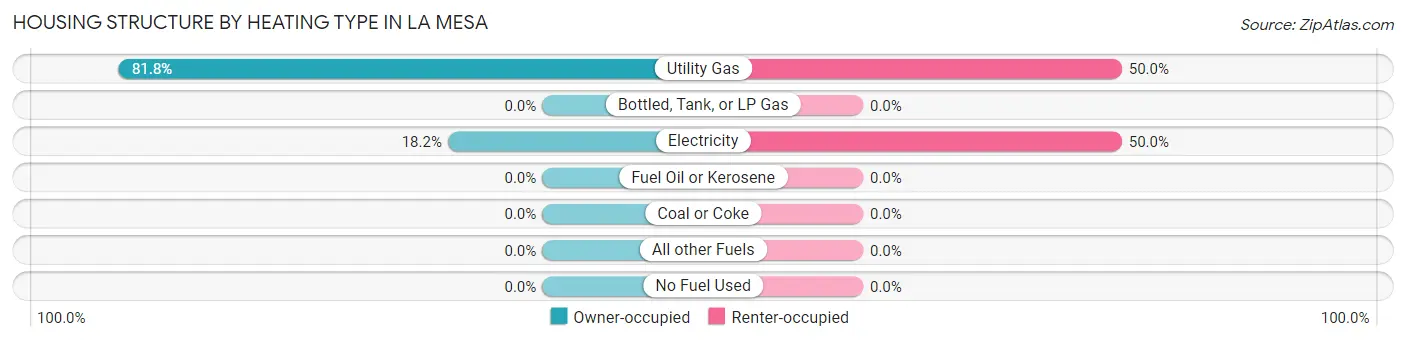
| Heating Type | Owner-occupied | Renter-occupied |
| Utility Gas | 166 (81.8%) | 29 (50.0%) |
| Bottled, Tank, or LP Gas | 0 (0.0%) | 0 (0.0%) |
| Electricity | 37 (18.2%) | 29 (50.0%) |
| Fuel Oil or Kerosene | 0 (0.0%) | 0 (0.0%) |
| Coal or Coke | 0 (0.0%) | 0 (0.0%) |
| All other Fuels | 0 (0.0%) | 0 (0.0%) |
| No Fuel Used | 0 (0.0%) | 0 (0.0%) |
| Total | 203 (100.0%) | 58 (100.0%) |
Household Vehicle Usage in La Mesa
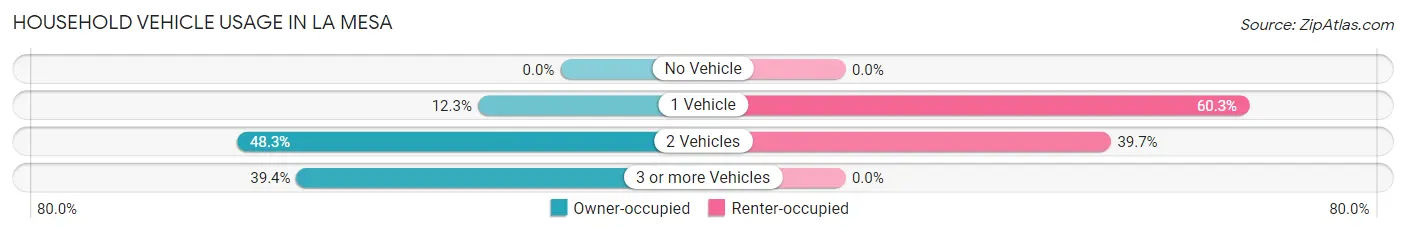
| Vehicles per Household | Owner-occupied | Renter-occupied |
| No Vehicle | 0 (0.0%) | 0 (0.0%) |
| 1 Vehicle | 25 (12.3%) | 35 (60.3%) |
| 2 Vehicles | 98 (48.3%) | 23 (39.7%) |
| 3 or more Vehicles | 80 (39.4%) | 0 (0.0%) |
| Total | 203 (100.0%) | 58 (100.0%) |
Real Estate & Mortgages in La Mesa
Real Estate and Mortgage Overview in La Mesa
| Characteristic | Without Mortgage | With Mortgage |
| Housing Units | 123 | 80 |
| Median Property Value | - | - |
| Median Household Income | $38,617 | $0 |
| Monthly Housing Costs | $241 | $0 |
| Real Estate Taxes | $225 | $0 |
Property Value by Mortgage Status in La Mesa
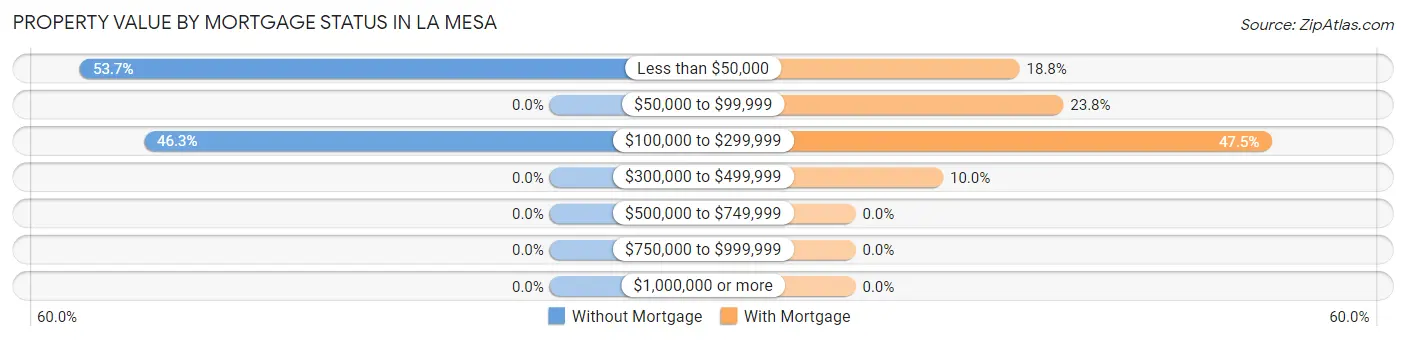
| Property Value | Without Mortgage | With Mortgage |
| Less than $50,000 | 66 (53.7%) | 15 (18.8%) |
| $50,000 to $99,999 | 0 (0.0%) | 19 (23.7%) |
| $100,000 to $299,999 | 57 (46.3%) | 38 (47.5%) |
| $300,000 to $499,999 | 0 (0.0%) | 8 (10.0%) |
| $500,000 to $749,999 | 0 (0.0%) | 0 (0.0%) |
| $750,000 to $999,999 | 0 (0.0%) | 0 (0.0%) |
| $1,000,000 or more | 0 (0.0%) | 0 (0.0%) |
| Total | 123 (100.0%) | 80 (100.0%) |
Household Income by Mortgage Status in La Mesa
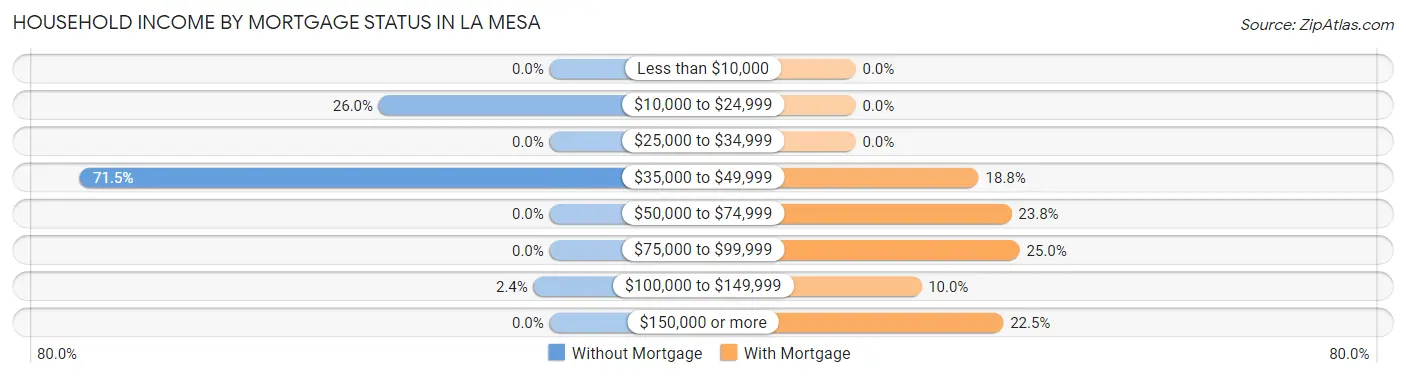
| Household Income | Without Mortgage | With Mortgage |
| Less than $10,000 | 0 (0.0%) | 0 (0.0%) |
| $10,000 to $24,999 | 32 (26.0%) | 0 (0.0%) |
| $25,000 to $34,999 | 0 (0.0%) | 0 (0.0%) |
| $35,000 to $49,999 | 88 (71.5%) | 15 (18.8%) |
| $50,000 to $74,999 | 0 (0.0%) | 19 (23.7%) |
| $75,000 to $99,999 | 0 (0.0%) | 20 (25.0%) |
| $100,000 to $149,999 | 3 (2.4%) | 8 (10.0%) |
| $150,000 or more | 0 (0.0%) | 18 (22.5%) |
| Total | 123 (100.0%) | 80 (100.0%) |
Property Value to Household Income Ratio in La Mesa
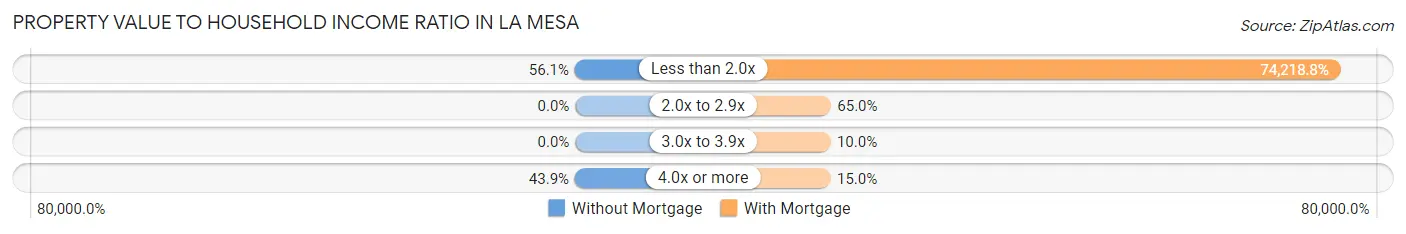
| Value-to-Income Ratio | Without Mortgage | With Mortgage |
| Less than 2.0x | 69 (56.1%) | 59,375 (74,218.8%) |
| 2.0x to 2.9x | 0 (0.0%) | 52 (65.0%) |
| 3.0x to 3.9x | 0 (0.0%) | 8 (10.0%) |
| 4.0x or more | 54 (43.9%) | 12 (15.0%) |
| Total | 123 (100.0%) | 80 (100.0%) |
Real Estate Taxes by Mortgage Status in La Mesa
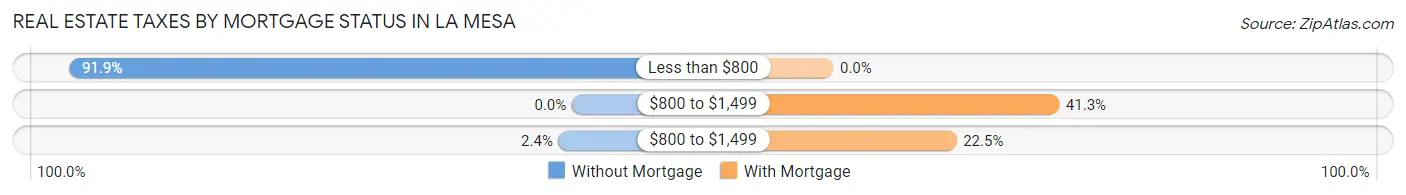
| Property Taxes | Without Mortgage | With Mortgage |
| Less than $800 | 113 (91.9%) | 0 (0.0%) |
| $800 to $1,499 | 0 (0.0%) | 33 (41.2%) |
| $800 to $1,499 | 3 (2.4%) | 18 (22.5%) |
| Total | 123 (100.0%) | 80 (100.0%) |
Health & Disability in La Mesa
Health Insurance Coverage by Age in La Mesa
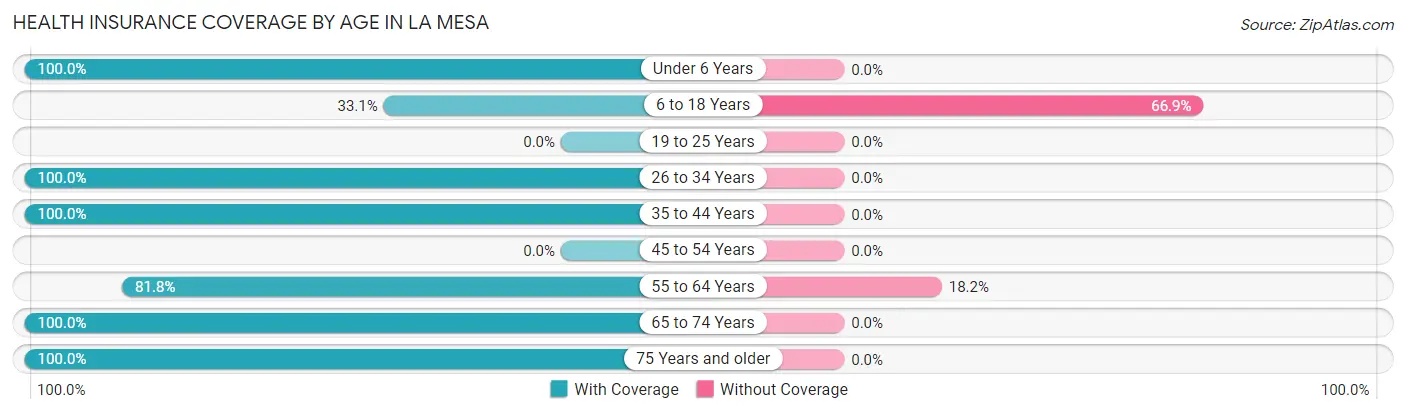
| Age Bracket | With Coverage | Without Coverage |
| Under 6 Years | 52 (100.0%) | 0 (0.0%) |
| 6 to 18 Years | 40 (33.1%) | 81 (66.9%) |
| 19 to 25 Years | 0 (0.0%) | 0 (0.0%) |
| 26 to 34 Years | 37 (100.0%) | 0 (0.0%) |
| 35 to 44 Years | 78 (100.0%) | 0 (0.0%) |
| 45 to 54 Years | 0 (0.0%) | 0 (0.0%) |
| 55 to 64 Years | 63 (81.8%) | 14 (18.2%) |
| 65 to 74 Years | 244 (100.0%) | 0 (0.0%) |
| 75 Years and older | 41 (100.0%) | 0 (0.0%) |
| Total | 555 (85.4%) | 95 (14.6%) |
Health Insurance Coverage by Citizenship Status in La Mesa
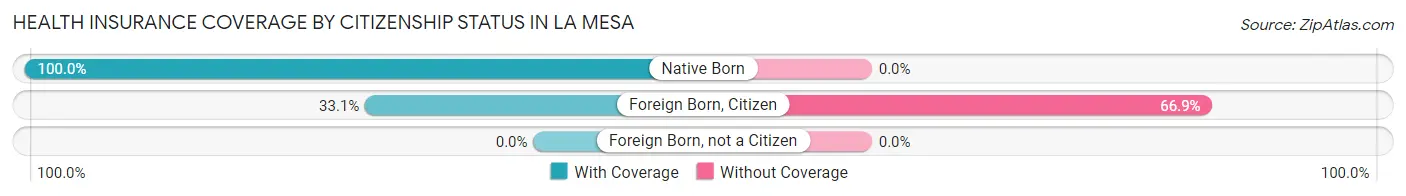
| Citizenship Status | With Coverage | Without Coverage |
| Native Born | 52 (100.0%) | 0 (0.0%) |
| Foreign Born, Citizen | 40 (33.1%) | 81 (66.9%) |
| Foreign Born, not a Citizen | 0 (0.0%) | 0 (0.0%) |
Health Insurance Coverage by Household Income in La Mesa
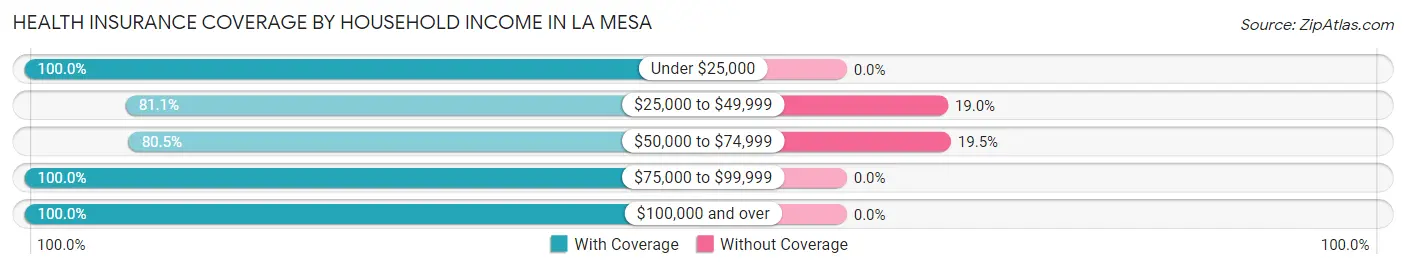
| Household Income | With Coverage | Without Coverage |
| Under $25,000 | 90 (100.0%) | 0 (0.0%) |
| $25,000 to $49,999 | 372 (81.0%) | 87 (19.0%) |
| $50,000 to $74,999 | 33 (80.5%) | 8 (19.5%) |
| $75,000 to $99,999 | 18 (100.0%) | 0 (0.0%) |
| $100,000 and over | 42 (100.0%) | 0 (0.0%) |
Public vs Private Health Insurance Coverage by Age in La Mesa
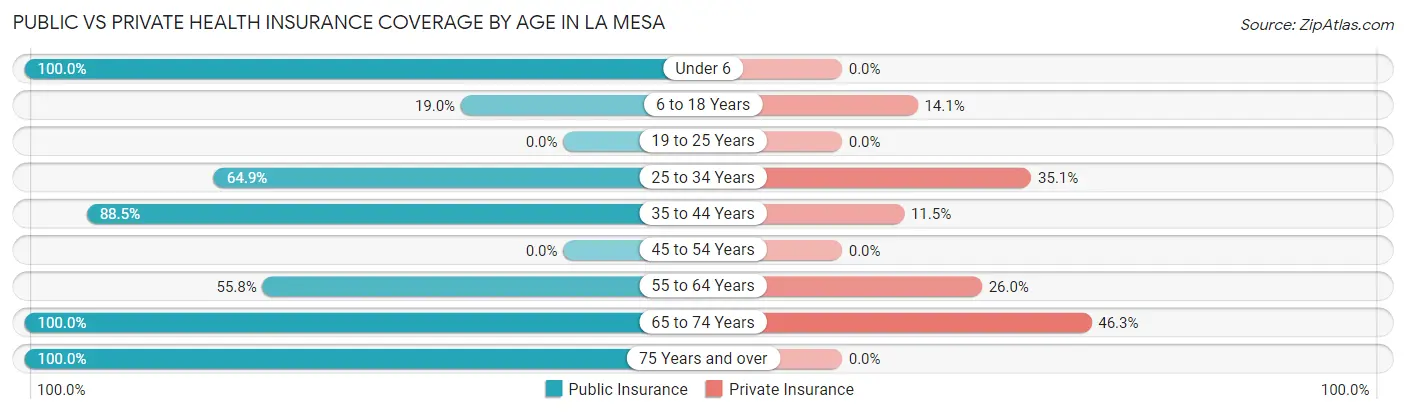
| Age Bracket | Public Insurance | Private Insurance |
| Under 6 | 52 (100.0%) | 0 (0.0%) |
| 6 to 18 Years | 23 (19.0%) | 17 (14.1%) |
| 19 to 25 Years | 0 (0.0%) | 0 (0.0%) |
| 25 to 34 Years | 24 (64.9%) | 13 (35.1%) |
| 35 to 44 Years | 69 (88.5%) | 9 (11.5%) |
| 45 to 54 Years | 0 (0.0%) | 0 (0.0%) |
| 55 to 64 Years | 43 (55.8%) | 20 (26.0%) |
| 65 to 74 Years | 244 (100.0%) | 113 (46.3%) |
| 75 Years and over | 41 (100.0%) | 0 (0.0%) |
| Total | 496 (76.3%) | 172 (26.5%) |
Disability Status by Sex by Age in La Mesa
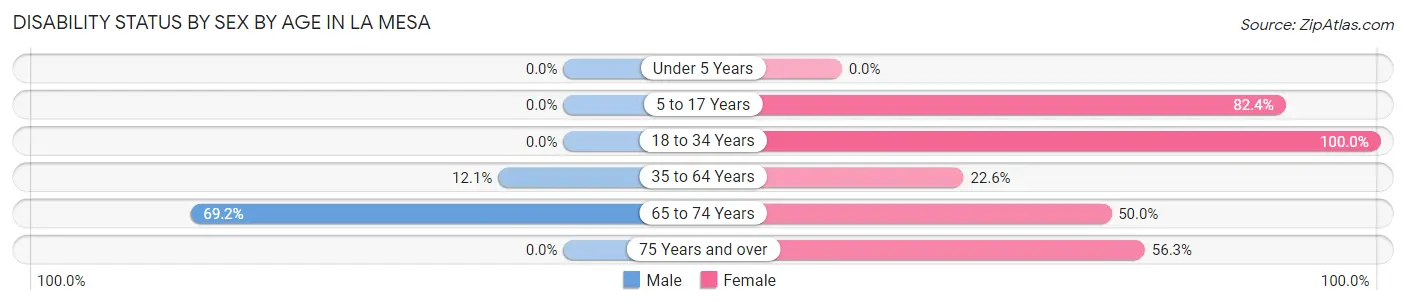
| Age Bracket | Male | Female |
| Under 5 Years | 0 (0.0%) | 0 (0.0%) |
| 5 to 17 Years | 0 (0.0%) | 42 (82.4%) |
| 18 to 34 Years | 0 (0.0%) | 24 (100.0%) |
| 35 to 64 Years | 15 (12.1%) | 7 (22.6%) |
| 65 to 74 Years | 72 (69.2%) | 70 (50.0%) |
| 75 Years and over | 0 (0.0%) | 9 (56.2%) |
Disability Class by Sex by Age in La Mesa
Disability Class: Hearing Difficulty
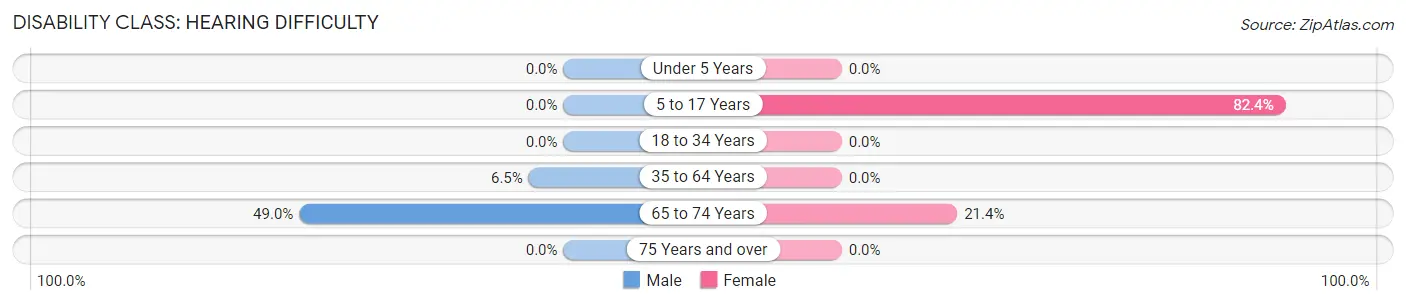
| Age Bracket | Male | Female |
| Under 5 Years | 0 (0.0%) | 0 (0.0%) |
| 5 to 17 Years | 0 (0.0%) | 42 (82.4%) |
| 18 to 34 Years | 0 (0.0%) | 0 (0.0%) |
| 35 to 64 Years | 8 (6.5%) | 0 (0.0%) |
| 65 to 74 Years | 51 (49.0%) | 30 (21.4%) |
| 75 Years and over | 0 (0.0%) | 0 (0.0%) |
Disability Class: Vision Difficulty
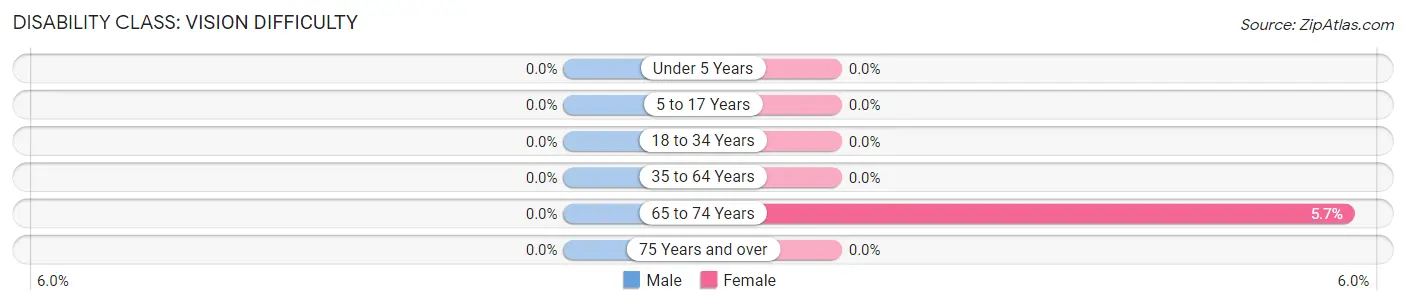
| Age Bracket | Male | Female |
| Under 5 Years | 0 (0.0%) | 0 (0.0%) |
| 5 to 17 Years | 0 (0.0%) | 0 (0.0%) |
| 18 to 34 Years | 0 (0.0%) | 0 (0.0%) |
| 35 to 64 Years | 0 (0.0%) | 0 (0.0%) |
| 65 to 74 Years | 0 (0.0%) | 8 (5.7%) |
| 75 Years and over | 0 (0.0%) | 0 (0.0%) |
Disability Class: Cognitive Difficulty
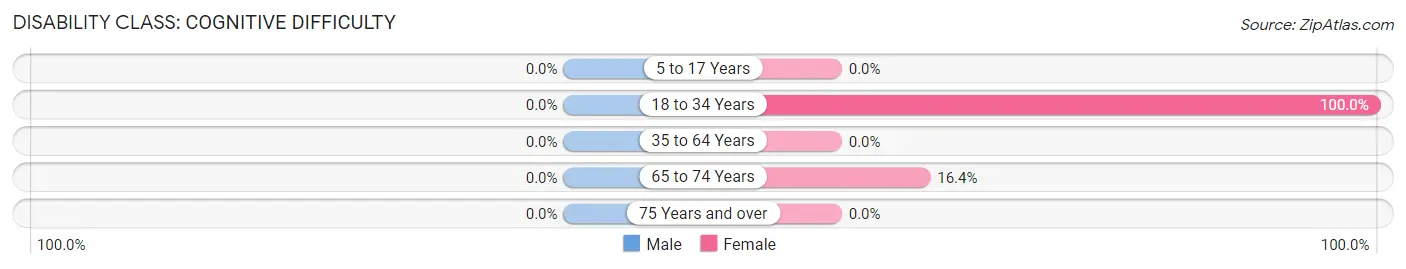
| Age Bracket | Male | Female |
| 5 to 17 Years | 0 (0.0%) | 0 (0.0%) |
| 18 to 34 Years | 0 (0.0%) | 24 (100.0%) |
| 35 to 64 Years | 0 (0.0%) | 0 (0.0%) |
| 65 to 74 Years | 0 (0.0%) | 23 (16.4%) |
| 75 Years and over | 0 (0.0%) | 0 (0.0%) |
Disability Class: Ambulatory Difficulty
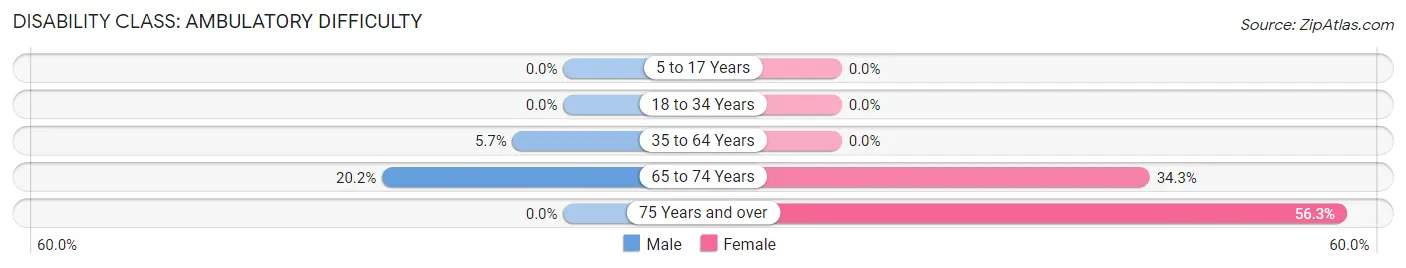
| Age Bracket | Male | Female |
| 5 to 17 Years | 0 (0.0%) | 0 (0.0%) |
| 18 to 34 Years | 0 (0.0%) | 0 (0.0%) |
| 35 to 64 Years | 7 (5.7%) | 0 (0.0%) |
| 65 to 74 Years | 21 (20.2%) | 48 (34.3%) |
| 75 Years and over | 0 (0.0%) | 9 (56.2%) |
Disability Class: Self-Care Difficulty
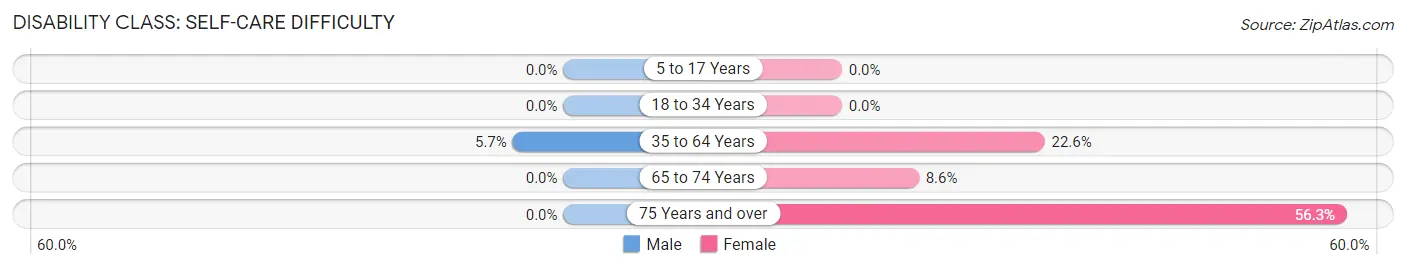
| Age Bracket | Male | Female |
| 5 to 17 Years | 0 (0.0%) | 0 (0.0%) |
| 18 to 34 Years | 0 (0.0%) | 0 (0.0%) |
| 35 to 64 Years | 7 (5.7%) | 7 (22.6%) |
| 65 to 74 Years | 0 (0.0%) | 12 (8.6%) |
| 75 Years and over | 0 (0.0%) | 9 (56.2%) |
Technology Access in La Mesa
Computing Device Access in La Mesa
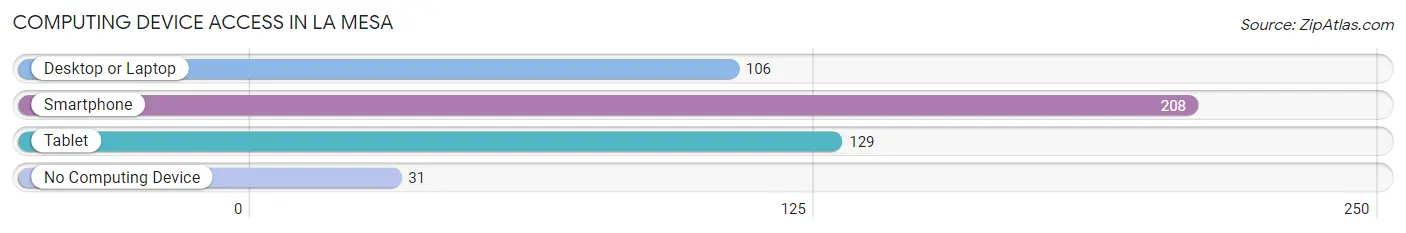
| Device Type | # Households | % Households |
| Desktop or Laptop | 106 | 40.6% |
| Smartphone | 208 | 79.7% |
| Tablet | 129 | 49.4% |
| No Computing Device | 31 | 11.9% |
| Total | 261 | 100.0% |
Internet Access in La Mesa
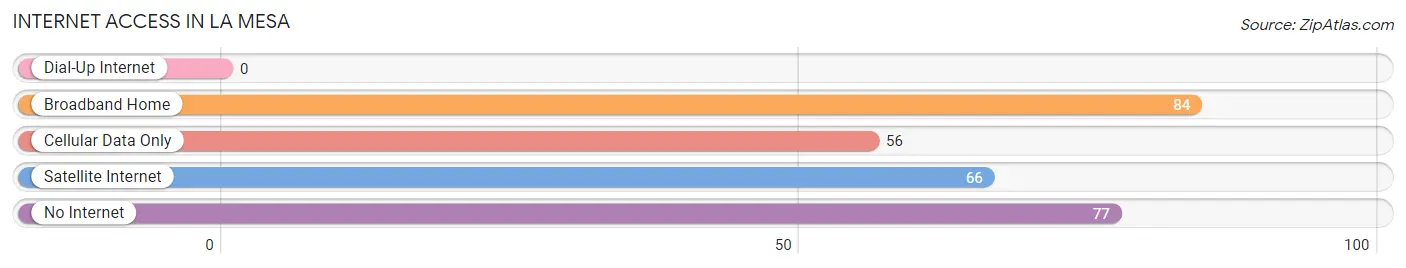
| Internet Type | # Households | % Households |
| Dial-Up Internet | 0 | 0.0% |
| Broadband Home | 84 | 32.2% |
| Cellular Data Only | 56 | 21.5% |
| Satellite Internet | 66 | 25.3% |
| No Internet | 77 | 29.5% |
| Total | 261 | 100.0% |
La Mesa Summary
Mesa, New Mexico is a small town located in the south-central part of the state. It is situated in the foothills of the Sangre de Cristo Mountains, and is part of the Chihuahuan Desert. The town is located in the Rio Grande Valley, and is surrounded by the San Miguel, Socorro, and Dona Ana counties. The town is home to a population of approximately 1,500 people, and is the county seat of Dona Ana County.
History
Mesa, New Mexico was founded in 1881 by a group of settlers from the nearby town of Mesilla. The settlers were looking for a place to settle and start a new life, and they chose the area around Mesa because of its fertile soil and abundant water supply. The town was originally called La Mesa, which means “the table” in Spanish. The name was changed to Mesa in 1883.
The town quickly grew and prospered, and by the early 1900s it had become a major agricultural center. The town was home to several large farms, and the surrounding area was used for grazing cattle and sheep. The town also had a thriving business district, with several stores, banks, and other businesses.
In the early 1900s, the town was also home to a large number of Mexican immigrants, who had come to the area to work in the fields and on the farms. The town was also home to a large number of Native Americans, who had been living in the area for centuries.
Geography
Mesa, New Mexico is located in the south-central part of the state, in the foothills of the Sangre de Cristo Mountains. The town is situated in the Rio Grande Valley, and is surrounded by the San Miguel, Socorro, and Dona Ana counties. The town is located at an elevation of 4,500 feet, and has a total area of 1.2 square miles.
The town is located in a semi-arid climate, with hot summers and mild winters. The average annual temperature is around 70 degrees Fahrenheit, and the average annual precipitation is around 12 inches.
Economy
Mesa, New Mexico is a small town with a limited economy. The town is primarily supported by agriculture, with the surrounding area used for grazing cattle and sheep. The town also has a small business district, with several stores, banks, and other businesses.
The town is also home to a number of small manufacturing companies, which produce a variety of products, including furniture, clothing, and electronics. The town is also home to a number of small service businesses, such as restaurants, hotels, and auto repair shops.
Demographics
Mesa, New Mexico has a population of approximately 1,500 people. The town is predominantly Hispanic, with around 75% of the population identifying as Hispanic or Latino. The town is also home to a small number of Native Americans, who make up around 5% of the population. The town is also home to a small number of African Americans, who make up around 2% of the population. The median household income in the town is around $30,000, and the median home value is around $90,000.
Common Questions
What is Per Capita Income in La Mesa?
Per Capita income in La Mesa is $18,975.
What is the Median Family Income in La Mesa?
Median Family Income in La Mesa is $39,186.
What is the Median Household income in La Mesa?
Median Household Income in La Mesa is $38,693.
What is Income or Wage Gap in La Mesa?
Income or Wage Gap in La Mesa is 42.9%.
Women in La Mesa earn 57.1 cents for every dollar earned by a man.
What is Inequality or Gini Index in La Mesa?
Inequality or Gini Index in La Mesa is 0.35.
What is the Total Population of La Mesa?
Total Population of La Mesa is 650.
What is the Total Male Population of La Mesa?
Total Male Population of La Mesa is 379.
What is the Total Female Population of La Mesa?
Total Female Population of La Mesa is 271.
What is the Ratio of Males per 100 Females in La Mesa?
There are 139.85 Males per 100 Females in La Mesa.
What is the Ratio of Females per 100 Males in La Mesa?
There are 71.50 Females per 100 Males in La Mesa.
What is the Median Population Age in La Mesa?
Median Population Age in La Mesa is 62.1 Years.
What is the Average Family Size in La Mesa
Average Family Size in La Mesa is 2.7 People.
What is the Average Household Size in La Mesa
Average Household Size in La Mesa is 2.5 People.
How Large is the Labor Force in La Mesa?
There are 165 People in the Labor Forcein in La Mesa.
What is the Percentage of People in the Labor Force in La Mesa?
34.6% of People are in the Labor Force in La Mesa.