Zip Codes with the Highest Percentage of Population Employed in Food Preparation & Serving in Albuquerque, NM
RELATED REPORTS & OPTIONS
Food Preparation & Serving
Albuquerque
Compare Zip Codes
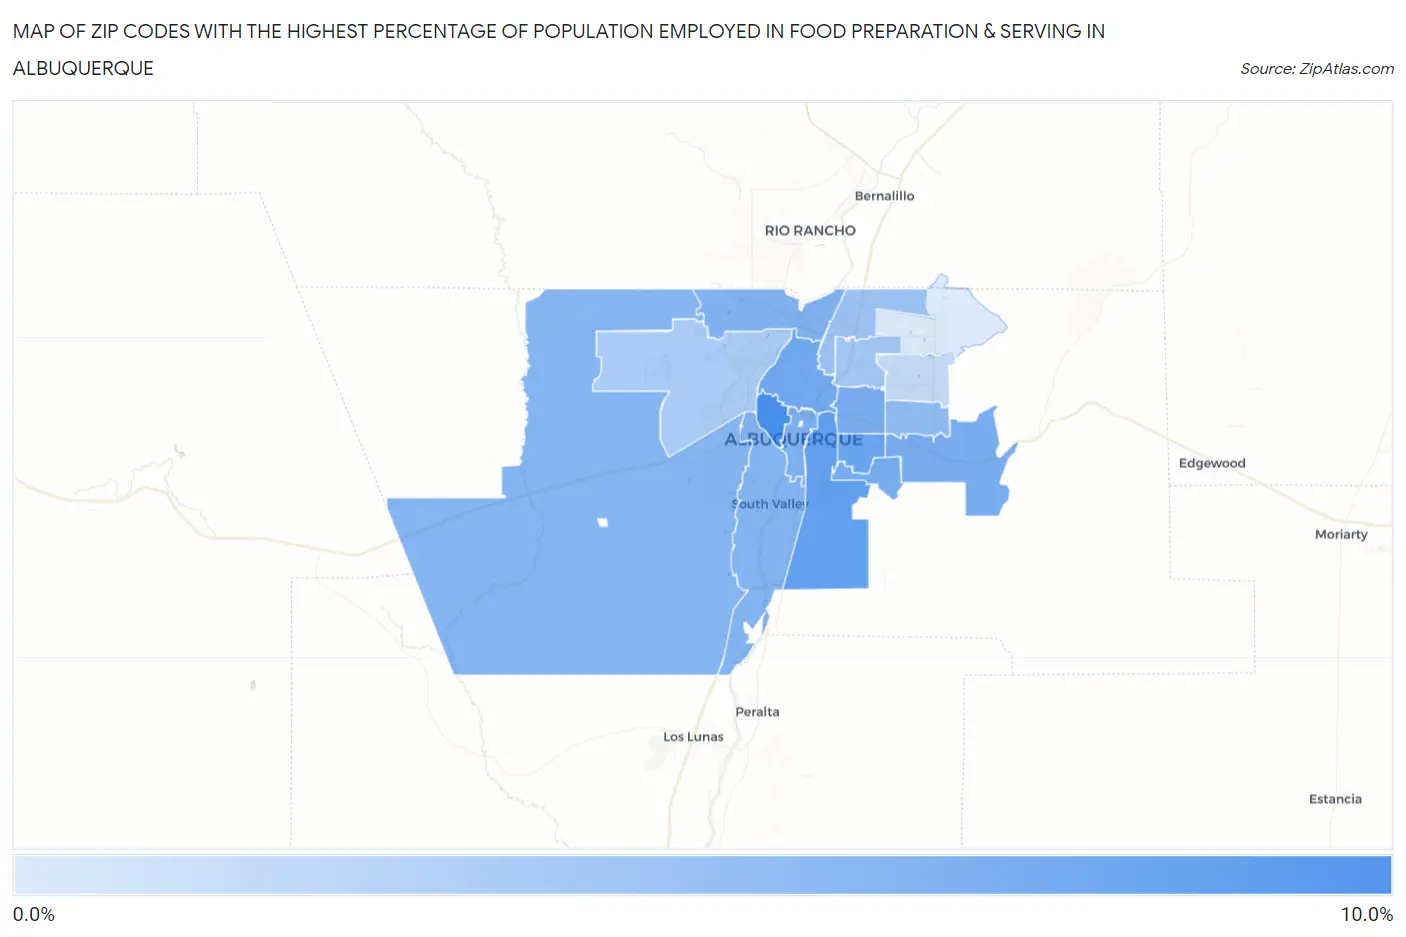
Map of Zip Codes with the Highest Percentage of Population Employed in Food Preparation & Serving in Albuquerque
1.5%
9.8%
Zip Codes with the Highest Percentage of Population Employed in Food Preparation & Serving in Albuquerque, NM
| Zip Code | % Employed | vs State | vs National | |
| 1. | 87104 | 9.8% | 5.8%(+4.00)#42 | 5.3%(+4.47)#2,842 |
| 2. | 87106 | 8.1% | 5.8%(+2.38)#61 | 5.3%(+2.85)#4,536 |
| 3. | 87108 | 7.7% | 5.8%(+1.96)#64 | 5.3%(+2.43)#5,188 |
| 4. | 87107 | 7.2% | 5.8%(+1.47)#74 | 5.3%(+1.94)#6,075 |
| 5. | 87123 | 7.1% | 5.8%(+1.30)#78 | 5.3%(+1.77)#6,417 |
| 6. | 87116 | 7.0% | 5.8%(+1.25)#80 | 5.3%(+1.72)#6,540 |
| 7. | 87110 | 6.9% | 5.8%(+1.11)#82 | 5.3%(+1.58)#6,897 |
| 8. | 87102 | 6.6% | 5.8%(+0.852)#91 | 5.3%(+1.32)#7,582 |
| 9. | 87114 | 6.5% | 5.8%(+0.742)#95 | 5.3%(+1.21)#7,887 |
| 10. | 87105 | 6.4% | 5.8%(+0.670)#96 | 5.3%(+1.14)#8,075 |
| 11. | 87121 | 6.2% | 5.8%(+0.475)#105 | 5.3%(+0.945)#8,645 |
| 12. | 87112 | 5.6% | 5.8%(-0.110)#121 | 5.3%(+0.359)#10,540 |
| 13. | 87113 | 5.0% | 5.8%(-0.773)#135 | 5.3%(-0.304)#13,023 |
| 14. | 87109 | 4.7% | 5.8%(-1.10)#143 | 5.3%(-0.632)#14,351 |
| 15. | 87120 | 4.2% | 5.8%(-1.53)#155 | 5.3%(-1.06)#16,221 |
| 16. | 87111 | 2.8% | 5.8%(-2.93)#180 | 5.3%(-2.46)#21,981 |
| 17. | 87122 | 1.5% | 5.8%(-4.24)#195 | 5.3%(-3.77)#25,970 |
1
Common Questions
What are the Top 10 Zip Codes with the Highest Percentage of Population Employed in Food Preparation & Serving in Albuquerque, NM?
Top 10 Zip Codes with the Highest Percentage of Population Employed in Food Preparation & Serving in Albuquerque, NM are:
What zip code has the Highest Percentage of Population Employed in Food Preparation & Serving in Albuquerque, NM?
87104 has the Highest Percentage of Population Employed in Food Preparation & Serving in Albuquerque, NM with 9.8%.
What is the Percentage of Population Employed in Food Preparation & Serving in Albuquerque, NM?
Percentage of Population Employed in Food Preparation & Serving in Albuquerque is 5.9%.
What is the Percentage of Population Employed in Food Preparation & Serving in New Mexico?
Percentage of Population Employed in Food Preparation & Serving in New Mexico is 5.8%.
What is the Percentage of Population Employed in Food Preparation & Serving in the United States?
Percentage of Population Employed in Food Preparation & Serving in the United States is 5.3%.