Napi Headquarters, NM Map & Demographics
Napi Headquarters Map
Napi Headquarters Overview
$13,915
PER CAPITA INCOME
$26,875
AVG FAMILY INCOME
$26,362
AVG HOUSEHOLD INCOME
9.3%
WAGE / INCOME GAP [ % ]
90.7¢/ $1
WAGE / INCOME GAP [ $ ]
0.36
INEQUALITY / GINI INDEX
628
TOTAL POPULATION
227
MALE POPULATION
401
FEMALE POPULATION
56.61
MALES / 100 FEMALES
176.65
FEMALES / 100 MALES
29.8
MEDIAN AGE
4.4
AVG FAMILY SIZE
2.7
AVG HOUSEHOLD SIZE
289
LABOR FORCE [ PEOPLE ]
57.2%
PERCENT IN LABOR FORCE
4.8%
UNEMPLOYMENT RATE
Income in Napi Headquarters
Income Overview in Napi Headquarters
Per Capita Income in Napi Headquarters is $13,915, while median incomes of families and households are $26,875 and $26,362 respectively.
| Characteristic | Number | Measure |
| Per Capita Income | 628 | $13,915 |
| Median Family Income | 108 | $26,875 |
| Mean Family Income | 108 | $45,401 |
| Median Household Income | 233 | $26,362 |
| Mean Household Income | 233 | $34,971 |
| Income Deficit | 108 | $0 |
| Wage / Income Gap (%) | 628 | 9.35% |
| Wage / Income Gap ($) | 628 | 90.65¢ per $1 |
| Gini / Inequality Index | 628 | 0.36 |
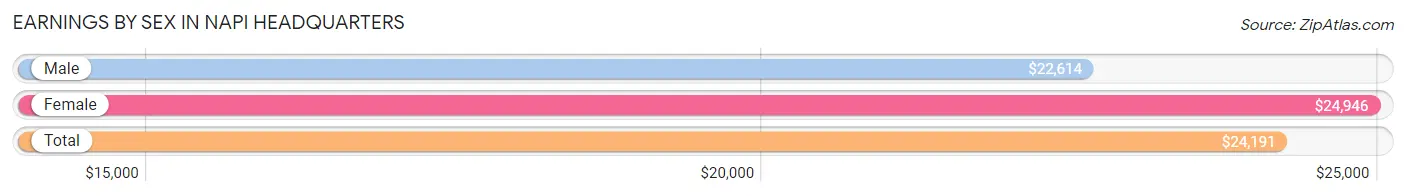
Earnings by Sex in Napi Headquarters
Average Earnings in Napi Headquarters are $24,191, $22,614 for men and $24,946 for women, a difference of 9.3%.
| Sex | Number | Average Earnings |
| Male | 103 (31.2%) | $22,614 |
| Female | 227 (68.8%) | $24,946 |
| Total | 330 (100.0%) | $24,191 |
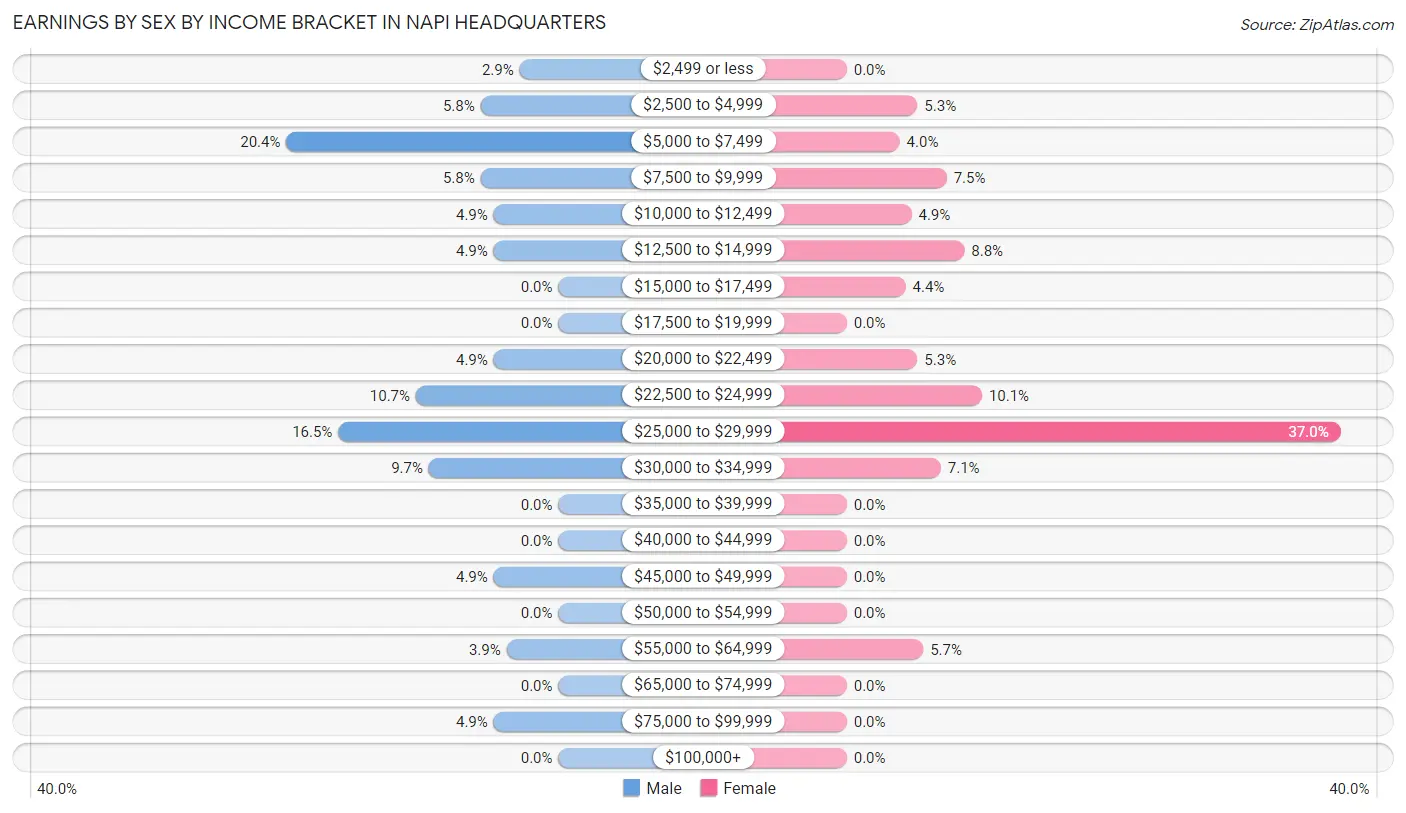
Earnings by Sex by Income Bracket in Napi Headquarters
The most common earnings brackets in Napi Headquarters are $5,000 to $7,499 for men (21 | 20.4%) and $25,000 to $29,999 for women (84 | 37.0%).
| Income | Male | Female |
| $2,499 or less | 3 (2.9%) | 0 (0.0%) |
| $2,500 to $4,999 | 6 (5.8%) | 12 (5.3%) |
| $5,000 to $7,499 | 21 (20.4%) | 9 (4.0%) |
| $7,500 to $9,999 | 6 (5.8%) | 17 (7.5%) |
| $10,000 to $12,499 | 5 (4.9%) | 11 (4.9%) |
| $12,500 to $14,999 | 5 (4.9%) | 20 (8.8%) |
| $15,000 to $17,499 | 0 (0.0%) | 10 (4.4%) |
| $17,500 to $19,999 | 0 (0.0%) | 0 (0.0%) |
| $20,000 to $22,499 | 5 (4.9%) | 12 (5.3%) |
| $22,500 to $24,999 | 11 (10.7%) | 23 (10.1%) |
| $25,000 to $29,999 | 17 (16.5%) | 84 (37.0%) |
| $30,000 to $34,999 | 10 (9.7%) | 16 (7.0%) |
| $35,000 to $39,999 | 0 (0.0%) | 0 (0.0%) |
| $40,000 to $44,999 | 0 (0.0%) | 0 (0.0%) |
| $45,000 to $49,999 | 5 (4.9%) | 0 (0.0%) |
| $50,000 to $54,999 | 0 (0.0%) | 0 (0.0%) |
| $55,000 to $64,999 | 4 (3.9%) | 13 (5.7%) |
| $65,000 to $74,999 | 0 (0.0%) | 0 (0.0%) |
| $75,000 to $99,999 | 5 (4.9%) | 0 (0.0%) |
| $100,000+ | 0 (0.0%) | 0 (0.0%) |
| Total | 103 (100.0%) | 227 (100.0%) |
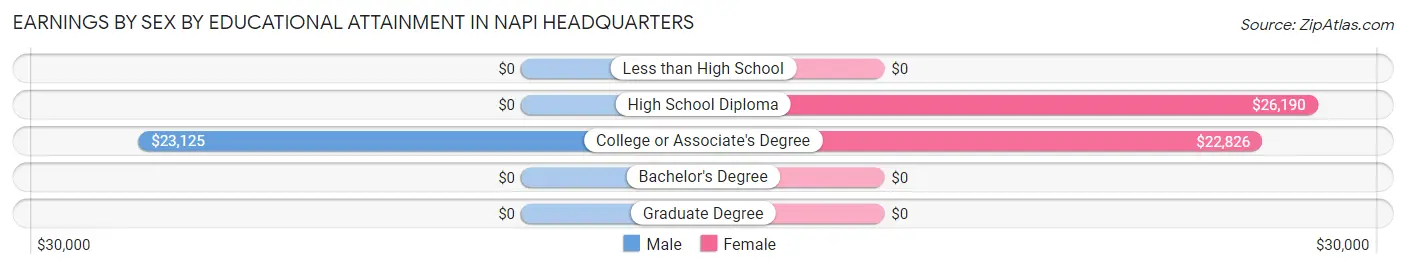
Earnings by Sex by Educational Attainment in Napi Headquarters
Average earnings in Napi Headquarters are $24,091 for men and $25,491 for women, a difference of 5.5%. Men with an educational attainment of college or associate's degree enjoy the highest average annual earnings of $23,125, while those with college or associate's degree education earn the least with $23,125. Women with an educational attainment of high school diploma earn the most with the average annual earnings of $26,190, while those with college or associate's degree education have the smallest earnings of $22,826.
| Educational Attainment | Male Income | Female Income |
| Less than High School | - | - |
| High School Diploma | - | - |
| College or Associate's Degree | $23,125 | $22,826 |
| Bachelor's Degree | - | - |
| Graduate Degree | - | - |
| Total | $24,091 | $25,491 |
Family Income in Napi Headquarters
Family Income Brackets in Napi Headquarters
According to the Napi Headquarters family income data, there are 28 families falling into the $75,000 to $99,999 income range, which is the most common income bracket and makes up 25.9% of all families.
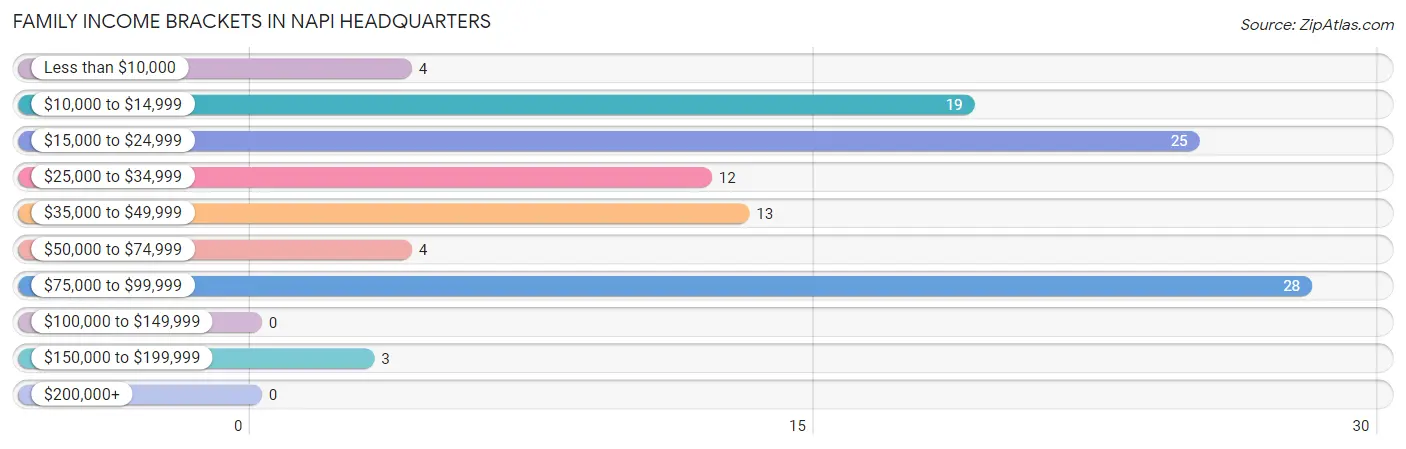
| Income Bracket | # Families | % Families |
| Less than $10,000 | 4 | 3.7% |
| $10,000 to $14,999 | 19 | 17.6% |
| $15,000 to $24,999 | 25 | 23.1% |
| $25,000 to $34,999 | 12 | 11.1% |
| $35,000 to $49,999 | 13 | 12.0% |
| $50,000 to $74,999 | 4 | 3.7% |
| $75,000 to $99,999 | 28 | 25.9% |
| $100,000 to $149,999 | 0 | 0.0% |
| $150,000 to $199,999 | 3 | 2.8% |
| $200,000+ | 0 | 0.0% |
Family Income by Famaliy Size in Napi Headquarters
4-person families (18 | 16.7%) account for the highest median family income in Napi Headquarters with $38,000 per family, while 2-person families (19 | 17.6%) have the highest median income of $11,484 per family member.
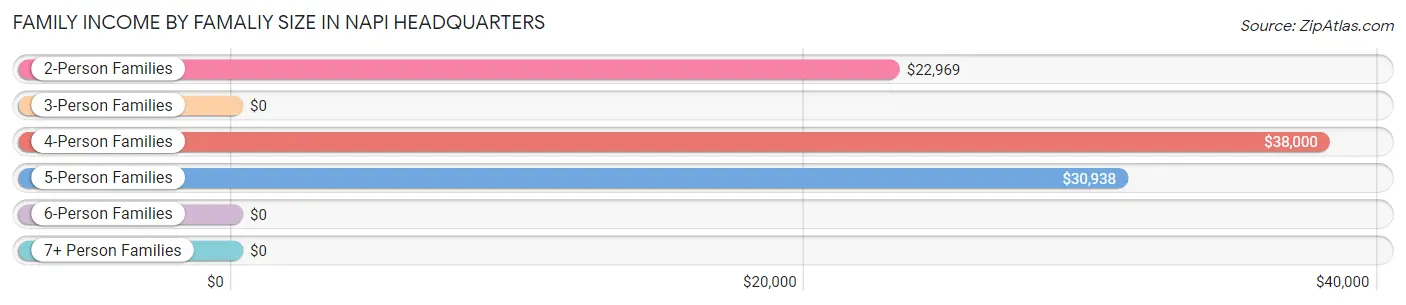
| Income Bracket | # Families | Median Income |
| 2-Person Families | 19 (17.6%) | $22,969 |
| 3-Person Families | 26 (24.1%) | $0 |
| 4-Person Families | 18 (16.7%) | $38,000 |
| 5-Person Families | 21 (19.4%) | $30,938 |
| 6-Person Families | 15 (13.9%) | $0 |
| 7+ Person Families | 9 (8.3%) | $0 |
| Total | 108 (100.0%) | $26,875 |
Family Income by Number of Earners in Napi Headquarters
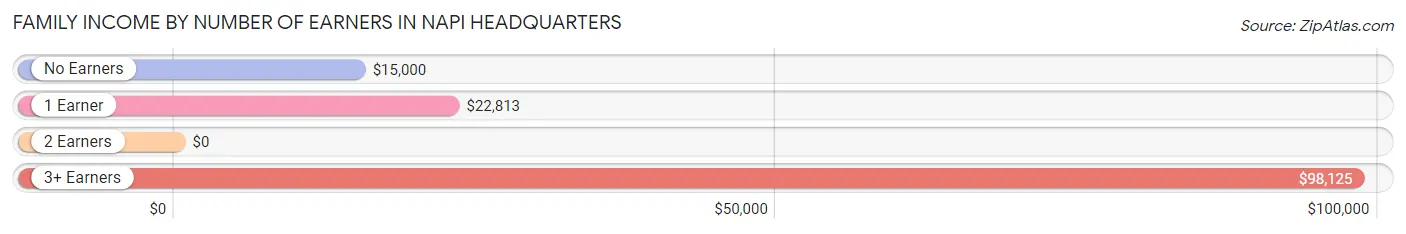
| Number of Earners | # Families | Median Income |
| No Earners | 16 (14.8%) | $15,000 |
| 1 Earner | 40 (37.0%) | $22,813 |
| 2 Earners | 31 (28.7%) | $0 |
| 3+ Earners | 21 (19.4%) | $98,125 |
| Total | 108 (100.0%) | $26,875 |
Household Income in Napi Headquarters
Household Income Brackets in Napi Headquarters
With 114 households falling in the category, the $25,000 to $34,999 income range is the most frequent in Napi Headquarters, accounting for 48.9% of all households.
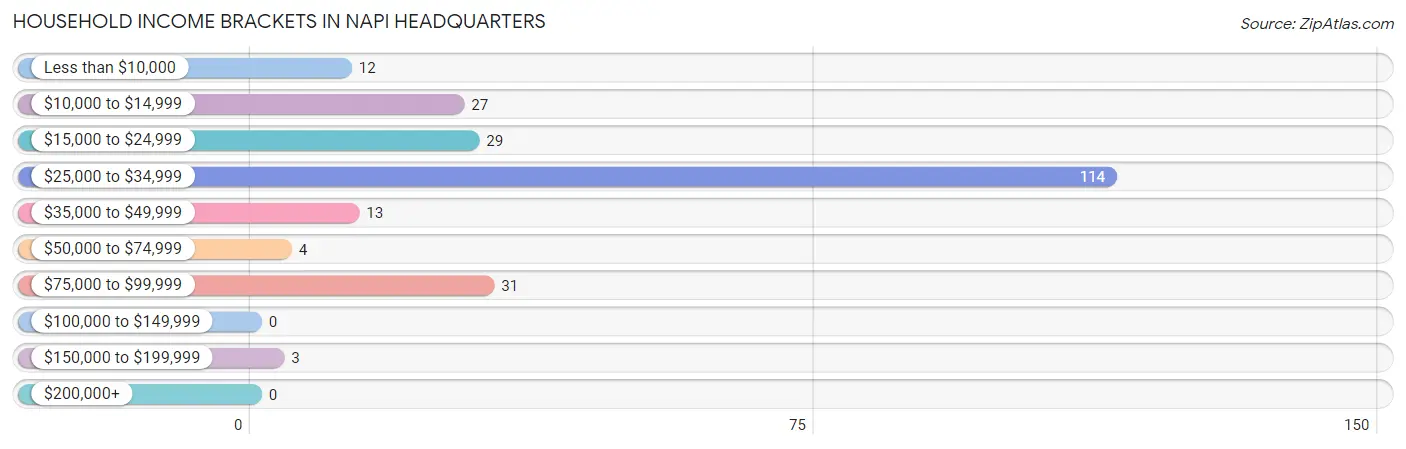
| Income Bracket | # Households | % Households |
| Less than $10,000 | 12 | 5.2% |
| $10,000 to $14,999 | 27 | 11.6% |
| $15,000 to $24,999 | 29 | 12.4% |
| $25,000 to $34,999 | 114 | 48.9% |
| $35,000 to $49,999 | 13 | 5.6% |
| $50,000 to $74,999 | 4 | 1.7% |
| $75,000 to $99,999 | 31 | 13.3% |
| $100,000 to $149,999 | 0 | 0.0% |
| $150,000 to $199,999 | 3 | 1.3% |
| $200,000+ | 0 | 0.0% |
Household Income by Householder Age in Napi Headquarters
The median household income in Napi Headquarters is $26,362, with the highest median household income of $28,036 found in the 25 to 44 years age bracket for the primary householder. A total of 63 households (27.0%) fall into this category. Meanwhile, the 15 to 24 years age bracket for the primary householder has the lowest median household income of $0, with 9 households (3.9%) in this group.
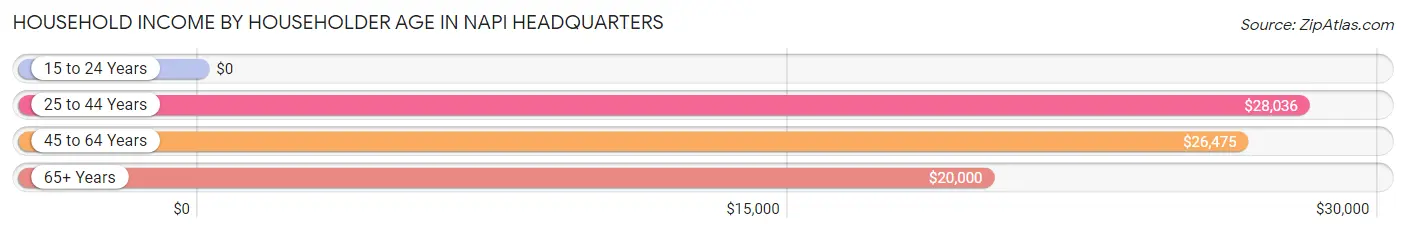
| Income Bracket | # Households | Median Income |
| 15 to 24 Years | 9 (3.9%) | $0 |
| 25 to 44 Years | 63 (27.0%) | $28,036 |
| 45 to 64 Years | 113 (48.5%) | $26,475 |
| 65+ Years | 48 (20.6%) | $20,000 |
| Total | 233 (100.0%) | $26,362 |
Poverty in Napi Headquarters
Income Below Poverty by Sex and Age in Napi Headquarters
With 48.5% poverty level for males and 29.9% for females among the residents of Napi Headquarters, under 5 year old males and 6 to 11 year old females are the most vulnerable to poverty, with 7 males (100.0%) and 24 females (75.0%) in their respective age groups living below the poverty level.
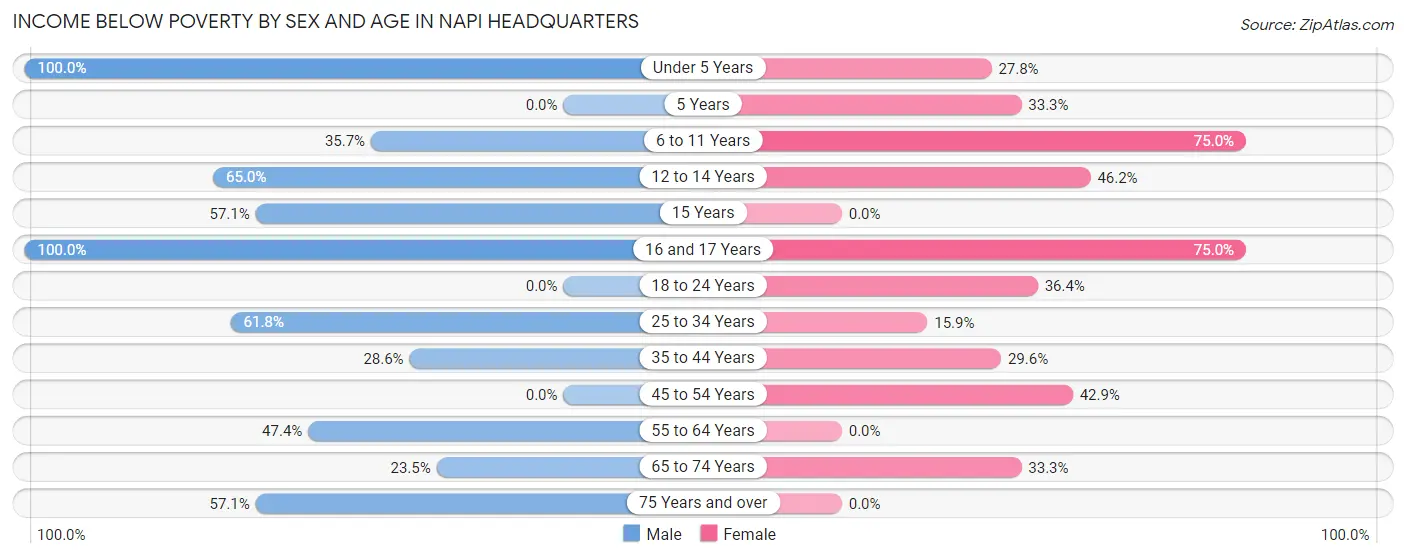
| Age Bracket | Male | Female |
| Under 5 Years | 7 (100.0%) | 5 (27.8%) |
| 5 Years | 0 (0.0%) | 4 (33.3%) |
| 6 to 11 Years | 5 (35.7%) | 24 (75.0%) |
| 12 to 14 Years | 13 (65.0%) | 6 (46.2%) |
| 15 Years | 4 (57.1%) | 0 (0.0%) |
| 16 and 17 Years | 7 (100.0%) | 18 (75.0%) |
| 18 to 24 Years | 0 (0.0%) | 16 (36.4%) |
| 25 to 34 Years | 42 (61.8%) | 10 (15.9%) |
| 35 to 44 Years | 6 (28.6%) | 13 (29.5%) |
| 45 to 54 Years | 0 (0.0%) | 12 (42.9%) |
| 55 to 64 Years | 18 (47.4%) | 0 (0.0%) |
| 65 to 74 Years | 4 (23.5%) | 12 (33.3%) |
| 75 Years and over | 4 (57.1%) | 0 (0.0%) |
| Total | 110 (48.5%) | 120 (29.9%) |
Income Above Poverty by Sex and Age in Napi Headquarters
According to the poverty statistics in Napi Headquarters, males aged 18 to 24 years and females aged 55 to 64 years are the age groups that are most secure financially, with 100.0% of males and 100.0% of females in these age groups living above the poverty line.
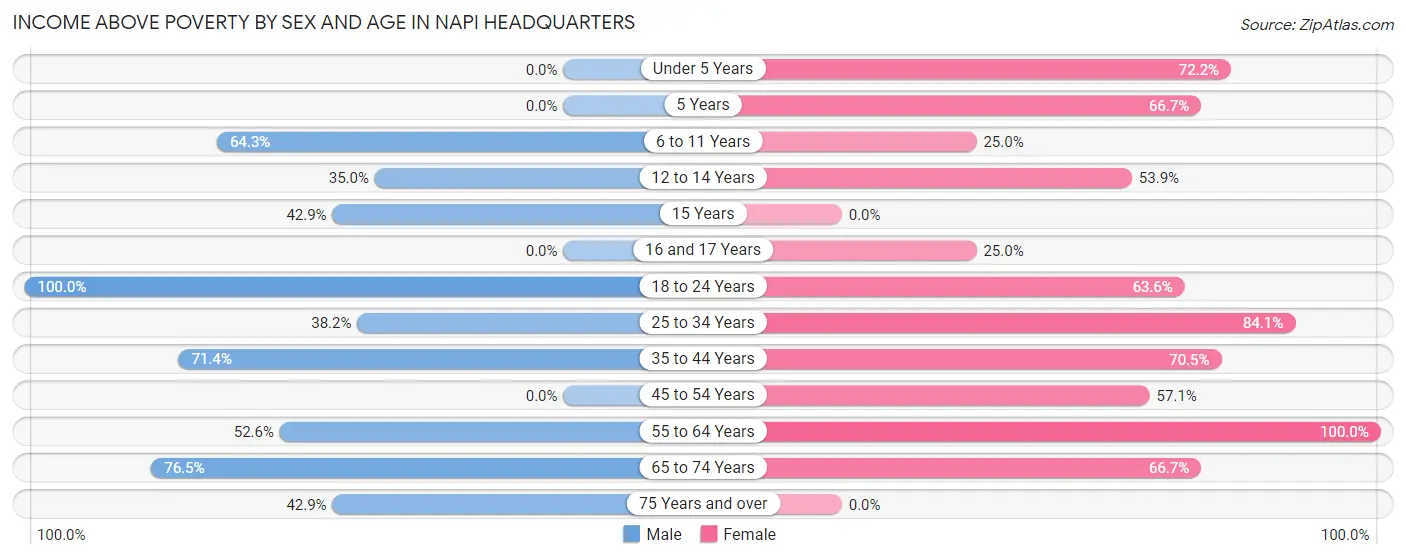
| Age Bracket | Male | Female |
| Under 5 Years | 0 (0.0%) | 13 (72.2%) |
| 5 Years | 0 (0.0%) | 8 (66.7%) |
| 6 to 11 Years | 9 (64.3%) | 8 (25.0%) |
| 12 to 14 Years | 7 (35.0%) | 7 (53.8%) |
| 15 Years | 3 (42.9%) | 0 (0.0%) |
| 16 and 17 Years | 0 (0.0%) | 6 (25.0%) |
| 18 to 24 Years | 21 (100.0%) | 28 (63.6%) |
| 25 to 34 Years | 26 (38.2%) | 53 (84.1%) |
| 35 to 44 Years | 15 (71.4%) | 31 (70.5%) |
| 45 to 54 Years | 0 (0.0%) | 16 (57.1%) |
| 55 to 64 Years | 20 (52.6%) | 87 (100.0%) |
| 65 to 74 Years | 13 (76.5%) | 24 (66.7%) |
| 75 Years and over | 3 (42.9%) | 0 (0.0%) |
| Total | 117 (51.5%) | 281 (70.1%) |
Income Below Poverty Among Married-Couple Families in Napi Headquarters
The poverty statistics for married-couple families in Napi Headquarters show that 16.1% or 10 of the total 62 families live below the poverty line. Families with no children have the highest poverty rate of 18.2%, comprising of 4 families. On the other hand, families with 3 or 4 children have the lowest poverty rate of 0.0%, which includes 0 families.
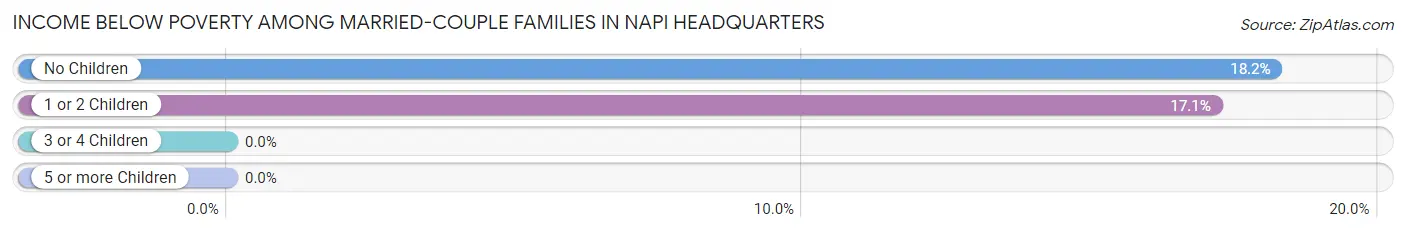
| Children | Above Poverty | Below Poverty |
| No Children | 18 (81.8%) | 4 (18.2%) |
| 1 or 2 Children | 29 (82.9%) | 6 (17.1%) |
| 3 or 4 Children | 5 (100.0%) | 0 (0.0%) |
| 5 or more Children | 0 (0.0%) | 0 (0.0%) |
| Total | 52 (83.9%) | 10 (16.1%) |
Income Below Poverty Among Single-Parent Households in Napi Headquarters
According to the poverty data in Napi Headquarters, 100.0% or 5 single-father households and 70.7% or 29 single-mother households are living below the poverty line. Among single-father households, those with 5 or more children have the highest poverty rate, with 5 households (100.0%) experiencing poverty. Likewise, among single-mother households, those with 3 or 4 children have the highest poverty rate, with 17 households (100.0%) falling below the poverty line.
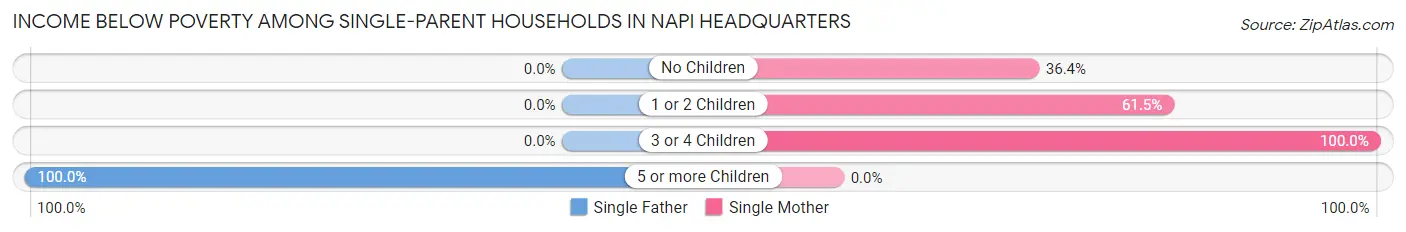
| Children | Single Father | Single Mother |
| No Children | 0 (0.0%) | 4 (36.4%) |
| 1 or 2 Children | 0 (0.0%) | 8 (61.5%) |
| 3 or 4 Children | 0 (0.0%) | 17 (100.0%) |
| 5 or more Children | 5 (100.0%) | 0 (0.0%) |
| Total | 5 (100.0%) | 29 (70.7%) |
Income Below Poverty Among Married-Couple vs Single-Parent Households in Napi Headquarters
The poverty data for Napi Headquarters shows that 10 of the married-couple family households (16.1%) and 34 of the single-parent households (73.9%) are living below the poverty level. Within the married-couple family households, those with no children have the highest poverty rate, with 4 households (18.2%) falling below the poverty line. Among the single-parent households, those with 3 or 4 children have the highest poverty rate, with 17 household (100.0%) living below poverty.
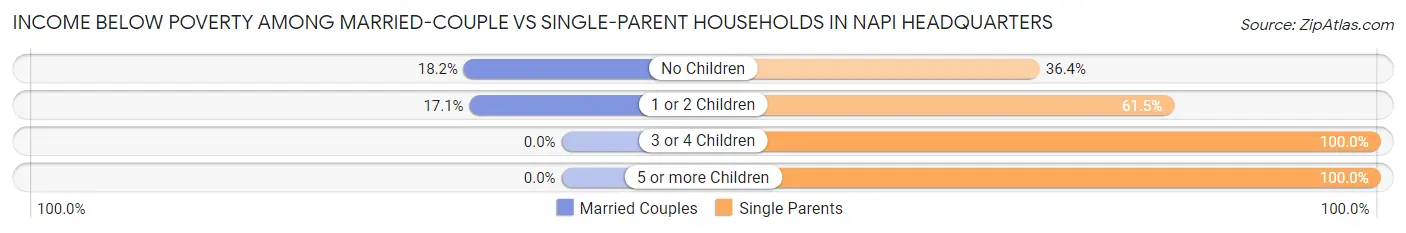
| Children | Married-Couple Families | Single-Parent Households |
| No Children | 4 (18.2%) | 4 (36.4%) |
| 1 or 2 Children | 6 (17.1%) | 8 (61.5%) |
| 3 or 4 Children | 0 (0.0%) | 17 (100.0%) |
| 5 or more Children | 0 (0.0%) | 5 (100.0%) |
| Total | 10 (16.1%) | 34 (73.9%) |
Race in Napi Headquarters
The most populous races in Napi Headquarters are Native / Alaskan (614 | 97.8%), and Two or more Races (14 | 2.2%).
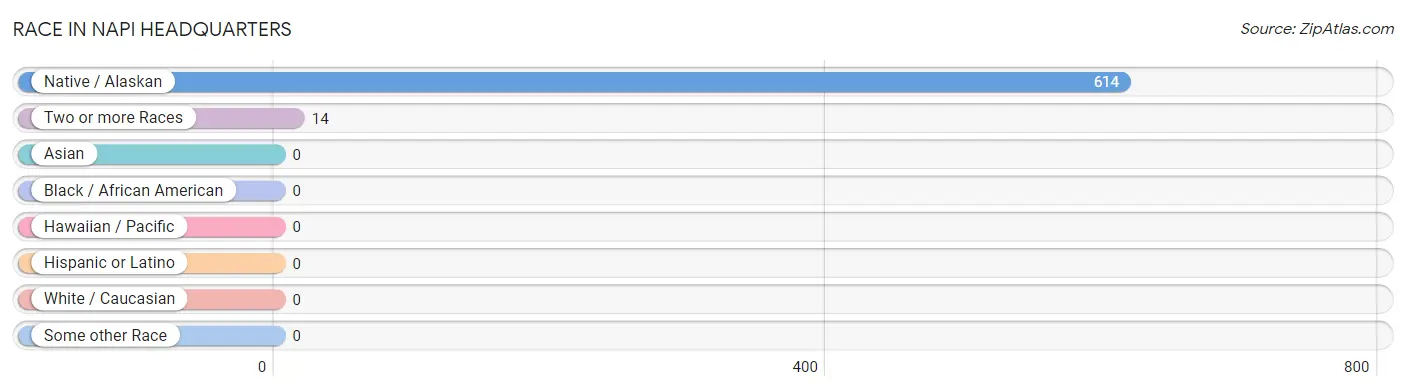
| Race | # Population | % Population |
| Asian | 0 | 0.0% |
| Black / African American | 0 | 0.0% |
| Hawaiian / Pacific | 0 | 0.0% |
| Hispanic or Latino | 0 | 0.0% |
| Native / Alaskan | 614 | 97.8% |
| White / Caucasian | 0 | 0.0% |
| Two or more Races | 14 | 2.2% |
| Some other Race | 0 | 0.0% |
| Total | 628 | 100.0% |
Ancestry in Napi Headquarters
The most populous ancestries reported in Napi Headquarters are Navajo (618 | 98.4%), Pueblo (26 | 4.1%), and Hopi (4 | 0.6%), together accounting for 103.2% of all Napi Headquarters residents.
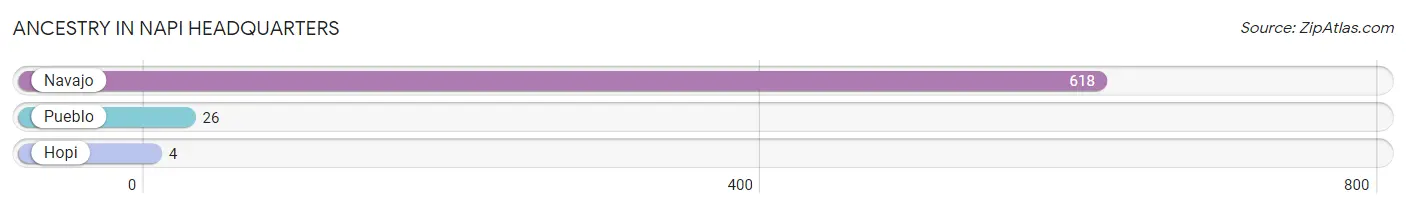
| Ancestry | # Population | % Population |
| Hopi | 4 | 0.6% |
| Navajo | 618 | 98.4% |
| Pueblo | 26 | 4.1% | View All 3 Rows |
Immigrants in Napi Headquarters

| Immigration Origin | # Population | % Population | View All 0 Rows |
Sex and Age in Napi Headquarters
Sex and Age in Napi Headquarters
The most populous age groups in Napi Headquarters are 25 to 29 Years (45 | 19.8%) for men and 55 to 59 Years (80 | 20.0%) for women.
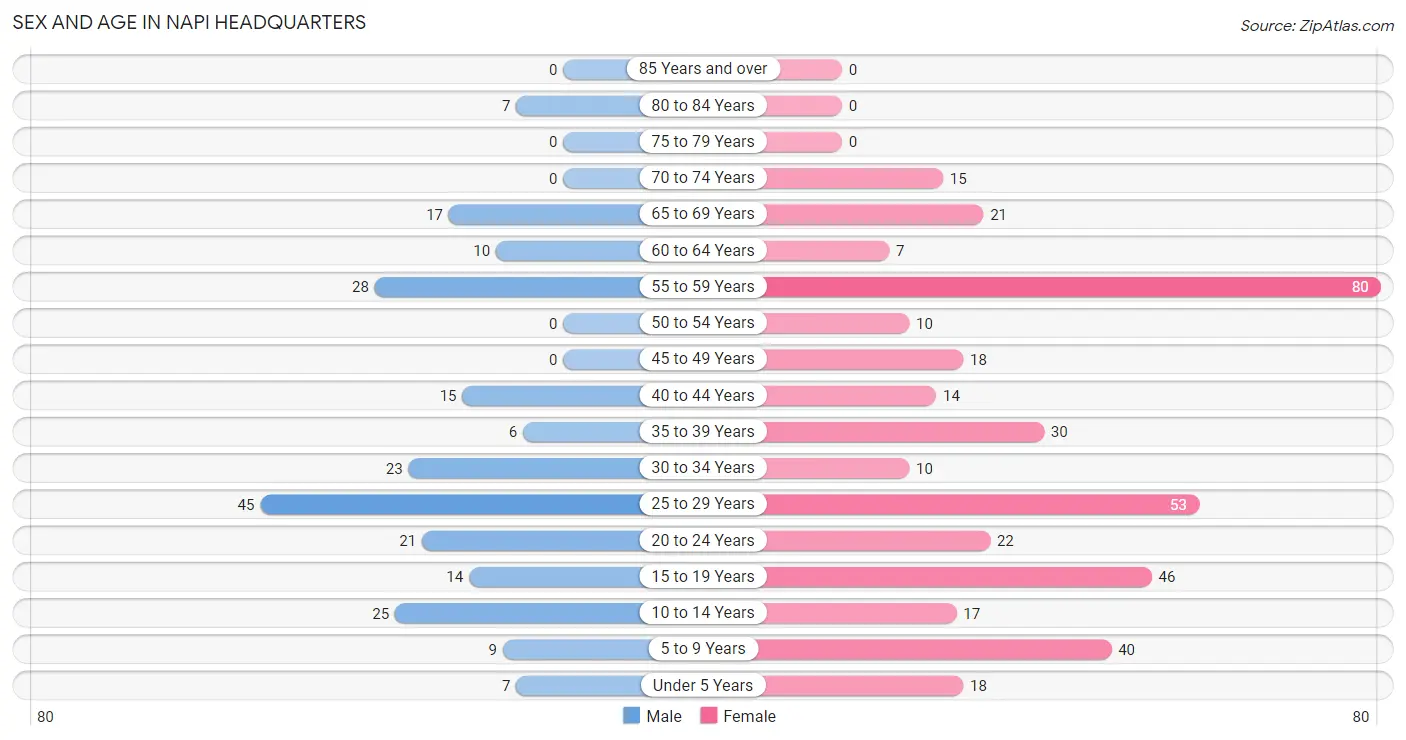
| Age Bracket | Male | Female |
| Under 5 Years | 7 (3.1%) | 18 (4.5%) |
| 5 to 9 Years | 9 (4.0%) | 40 (10.0%) |
| 10 to 14 Years | 25 (11.0%) | 17 (4.2%) |
| 15 to 19 Years | 14 (6.2%) | 46 (11.5%) |
| 20 to 24 Years | 21 (9.2%) | 22 (5.5%) |
| 25 to 29 Years | 45 (19.8%) | 53 (13.2%) |
| 30 to 34 Years | 23 (10.1%) | 10 (2.5%) |
| 35 to 39 Years | 6 (2.6%) | 30 (7.5%) |
| 40 to 44 Years | 15 (6.6%) | 14 (3.5%) |
| 45 to 49 Years | 0 (0.0%) | 18 (4.5%) |
| 50 to 54 Years | 0 (0.0%) | 10 (2.5%) |
| 55 to 59 Years | 28 (12.3%) | 80 (20.0%) |
| 60 to 64 Years | 10 (4.4%) | 7 (1.8%) |
| 65 to 69 Years | 17 (7.5%) | 21 (5.2%) |
| 70 to 74 Years | 0 (0.0%) | 15 (3.7%) |
| 75 to 79 Years | 0 (0.0%) | 0 (0.0%) |
| 80 to 84 Years | 7 (3.1%) | 0 (0.0%) |
| 85 Years and over | 0 (0.0%) | 0 (0.0%) |
| Total | 227 (100.0%) | 401 (100.0%) |
Families and Households in Napi Headquarters
Median Family Size in Napi Headquarters
The median family size in Napi Headquarters is 4.41 persons per family, with single male/father families (5 | 4.6%) accounting for the largest median family size of 6 persons per family. On the other hand, single female/mother families (41 | 38.0%) represent the smallest median family size with 4.10 persons per family.
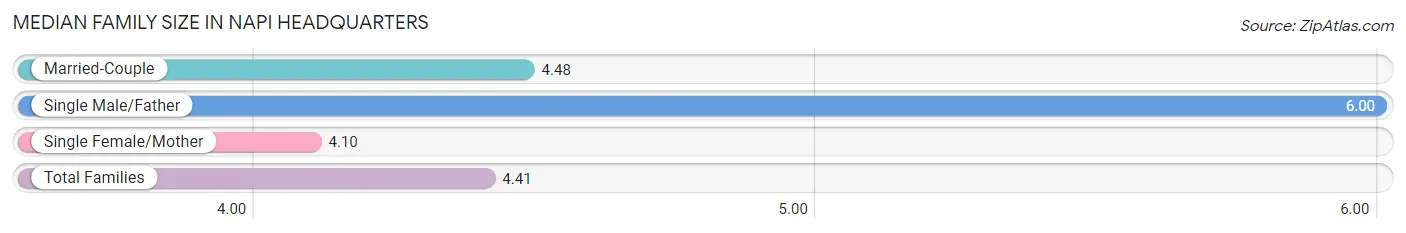
| Family Type | # Families | Family Size |
| Married-Couple | 62 (57.4%) | 4.48 |
| Single Male/Father | 5 (4.6%) | 6.00 |
| Single Female/Mother | 41 (38.0%) | 4.10 |
| Total Families | 108 (100.0%) | 4.41 |
Median Household Size in Napi Headquarters
The median household size in Napi Headquarters is 2.70 persons per household, with single male/father households (5 | 2.1%) accounting for the largest median household size of 6 persons per household. non-family households (125 | 53.6%) represent the smallest median household size with 1.15 persons per household.
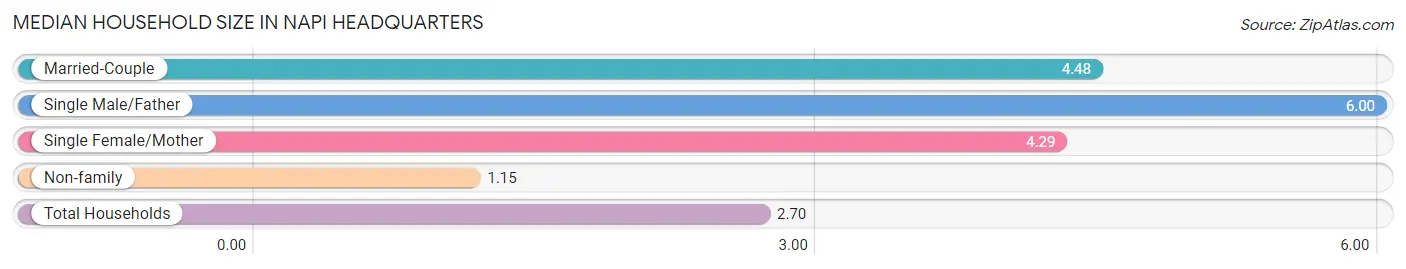
| Household Type | # Households | Household Size |
| Married-Couple | 62 (26.6%) | 4.48 |
| Single Male/Father | 5 (2.1%) | 6.00 |
| Single Female/Mother | 41 (17.6%) | 4.29 |
| Non-family | 125 (53.6%) | 1.15 |
| Total Households | 233 (100.0%) | 2.70 |
Household Size by Marriage Status in Napi Headquarters
Out of a total of 233 households in Napi Headquarters, 108 (46.4%) are family households, while 125 (53.6%) are nonfamily households. The most numerous type of family households are 3-person households, comprising 29, and the most common type of nonfamily households are 1-person households, comprising 104.
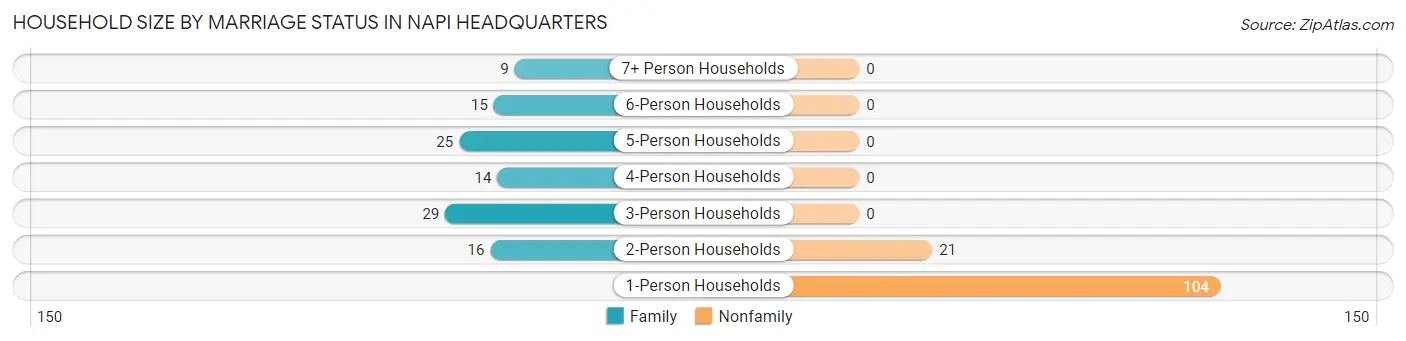
| Household Size | Family Households | Nonfamily Households |
| 1-Person Households | - | 104 (44.6%) |
| 2-Person Households | 16 (6.9%) | 21 (9.0%) |
| 3-Person Households | 29 (12.4%) | 0 (0.0%) |
| 4-Person Households | 14 (6.0%) | 0 (0.0%) |
| 5-Person Households | 25 (10.7%) | 0 (0.0%) |
| 6-Person Households | 15 (6.4%) | 0 (0.0%) |
| 7+ Person Households | 9 (3.9%) | 0 (0.0%) |
| Total | 108 (46.4%) | 125 (53.6%) |
Female Fertility in Napi Headquarters
Fertility by Age in Napi Headquarters
Average fertility rate in Napi Headquarters is 98.0 births per 1,000 women. Women in the age bracket of 20 to 34 years have the highest fertility rate with 224.0 births per 1,000 women. Women in the age bracket of 20 to 34 years acount for 100.0% of all women with births.
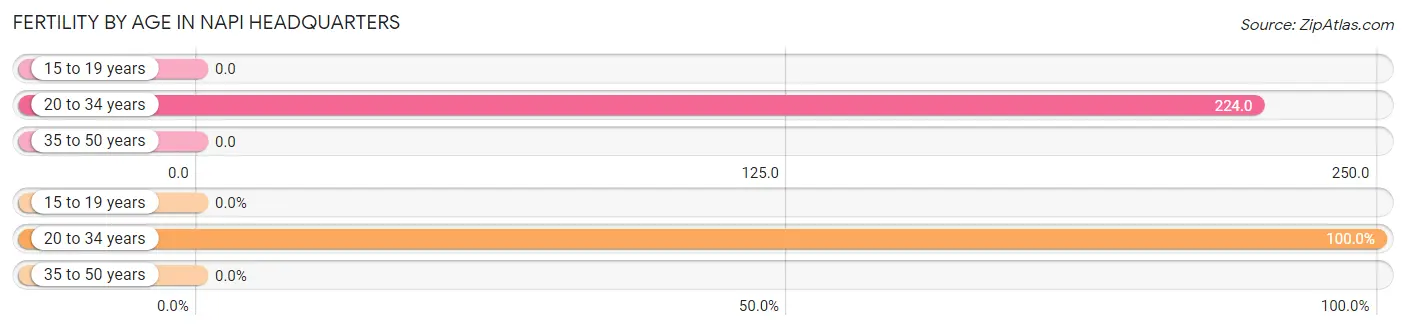
| Age Bracket | Women with Births | Births / 1,000 Women |
| 15 to 19 years | 0 (0.0%) | 0.0 |
| 20 to 34 years | 19 (100.0%) | 224.0 |
| 35 to 50 years | 0 (0.0%) | 0.0 |
| Total | 19 (100.0%) | 98.0 |
Fertility by Age by Marriage Status in Napi Headquarters
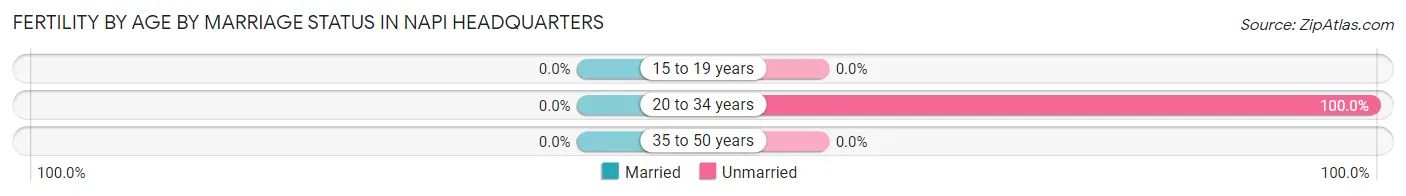
| Age Bracket | Married | Unmarried |
| 15 to 19 years | 0 (0.0%) | 0 (0.0%) |
| 20 to 34 years | 0 (0.0%) | 19 (100.0%) |
| 35 to 50 years | 0 (0.0%) | 0 (0.0%) |
| Total | 0 (0.0%) | 19 (100.0%) |
Fertility by Education in Napi Headquarters
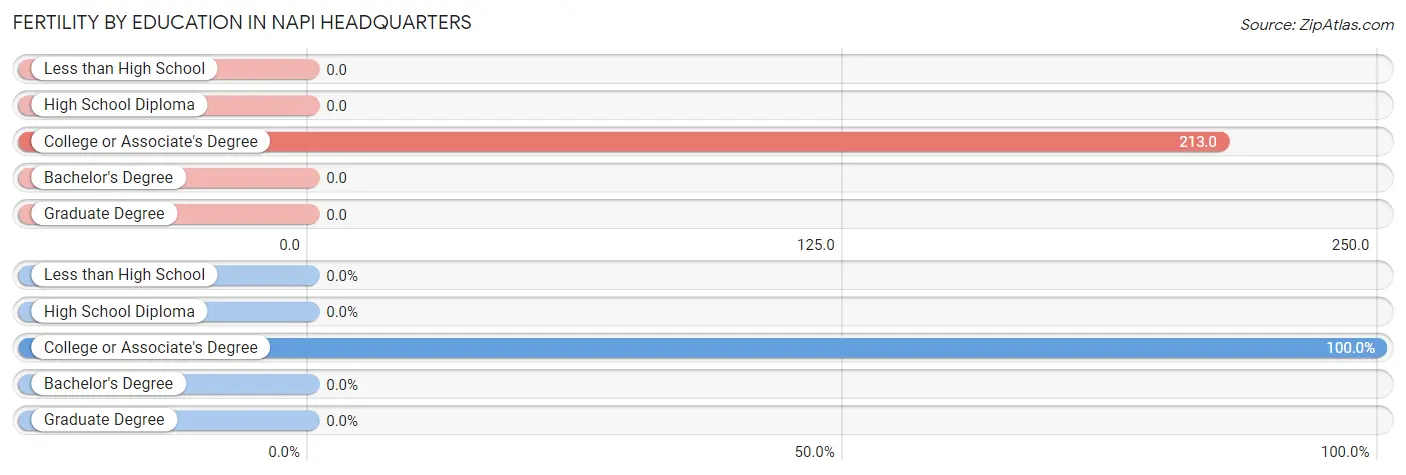
| Educational Attainment | Women with Births | Births / 1,000 Women |
| Less than High School | 0 (0.0%) | 0.0 |
| High School Diploma | 0 (0.0%) | 0.0 |
| College or Associate's Degree | 19 (100.0%) | 213.0 |
| Bachelor's Degree | 0 (0.0%) | 0.0 |
| Graduate Degree | 0 (0.0%) | 0.0 |
| Total | 19 (100.0%) | 98.0 |
Fertility by Education by Marriage Status in Napi Headquarters
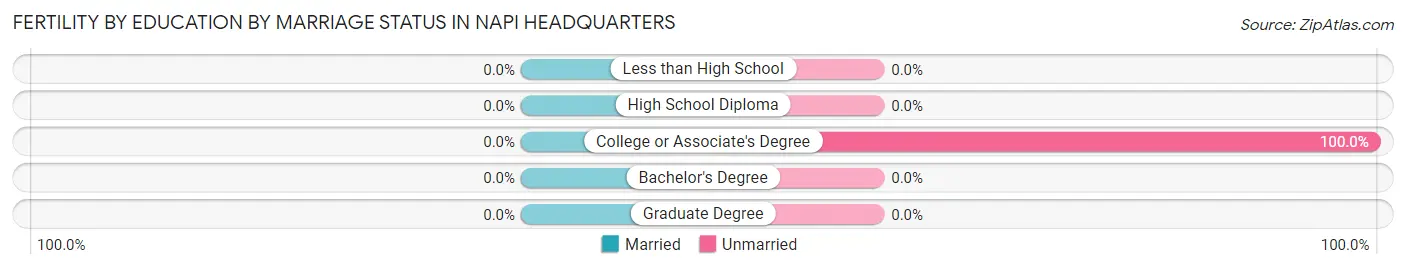
| Educational Attainment | Married | Unmarried |
| Less than High School | 0 (0.0%) | 0 (0.0%) |
| High School Diploma | 0 (0.0%) | 0 (0.0%) |
| College or Associate's Degree | 0 (0.0%) | 19 (100.0%) |
| Bachelor's Degree | 0 (0.0%) | 0 (0.0%) |
| Graduate Degree | 0 (0.0%) | 0 (0.0%) |
| Total | 0 (0.0%) | 19 (100.0%) |
Employment Characteristics in Napi Headquarters
Employment by Class of Employer in Napi Headquarters
Among the 256 employed individuals in Napi Headquarters, private company employees (168 | 65.6%), not-for-profit organizations (80 | 31.2%), and local government employees (8 | 3.1%) make up the most common classes of employment.
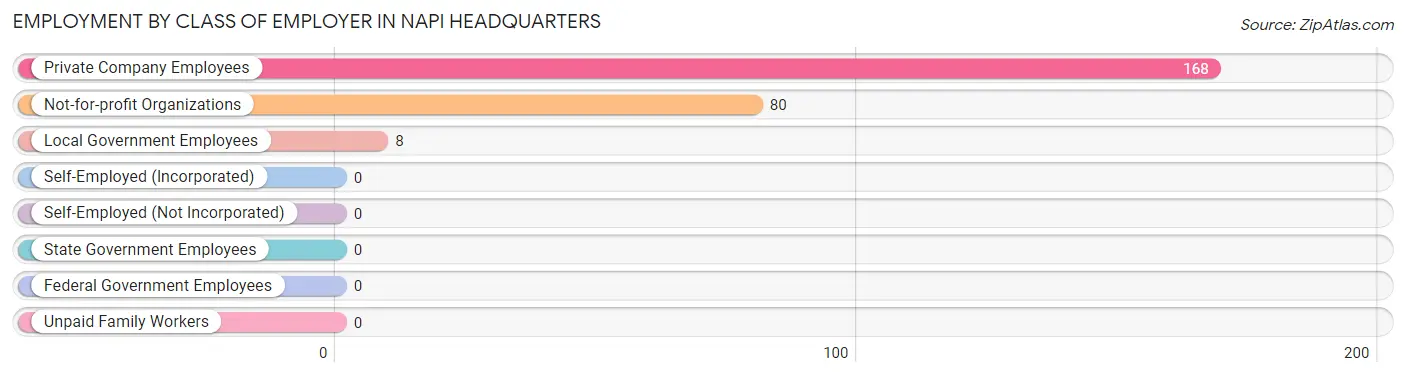
| Employer Class | # Employees | % Employees |
| Private Company Employees | 168 | 65.6% |
| Self-Employed (Incorporated) | 0 | 0.0% |
| Self-Employed (Not Incorporated) | 0 | 0.0% |
| Not-for-profit Organizations | 80 | 31.2% |
| Local Government Employees | 8 | 3.1% |
| State Government Employees | 0 | 0.0% |
| Federal Government Employees | 0 | 0.0% |
| Unpaid Family Workers | 0 | 0.0% |
| Total | 256 | 100.0% |
Employment Status by Age in Napi Headquarters
According to the labor force statistics for Napi Headquarters, out of the total population over 16 years of age (505), 57.2% or 289 individuals are in the labor force, with 4.8% or 14 of them unemployed. The age group with the highest labor force participation rate is 30 to 34 years, with 87.9% or 29 individuals in the labor force. Within the labor force, the 60 to 64 years age range has the highest percentage of unemployed individuals, with 25.0% or 3 of them being unemployed.
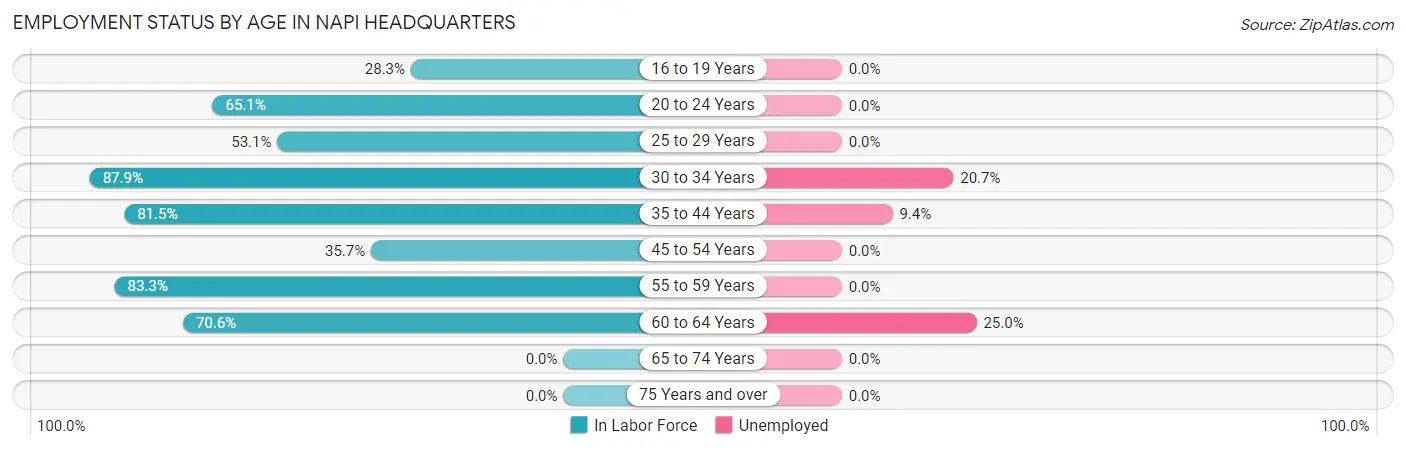
| Age Bracket | In Labor Force | Unemployed |
| 16 to 19 Years | 15 (28.3%) | 0 (0.0%) |
| 20 to 24 Years | 28 (65.1%) | 0 (0.0%) |
| 25 to 29 Years | 52 (53.1%) | 0 (0.0%) |
| 30 to 34 Years | 29 (87.9%) | 6 (20.7%) |
| 35 to 44 Years | 53 (81.5%) | 5 (9.4%) |
| 45 to 54 Years | 10 (35.7%) | 0 (0.0%) |
| 55 to 59 Years | 90 (83.3%) | 0 (0.0%) |
| 60 to 64 Years | 12 (70.6%) | 3 (25.0%) |
| 65 to 74 Years | 0 (0.0%) | 0 (0.0%) |
| 75 Years and over | 0 (0.0%) | 0 (0.0%) |
| Total | 289 (57.2%) | 14 (4.8%) |
Employment Status by Educational Attainment in Napi Headquarters
According to labor force statistics for Napi Headquarters, 70.5% of individuals (246) out of the total population between 25 and 64 years of age (349) are in the labor force, with 5.7% or 14 of them being unemployed. The group with the highest labor force participation rate are those with the educational attainment of bachelor's degree or higher, with 100.0% or 10 individuals in the labor force. Within the labor force, individuals with bachelor's degree or higher education have the highest percentage of unemployment, with 60.0% or 6 of them being unemployed.
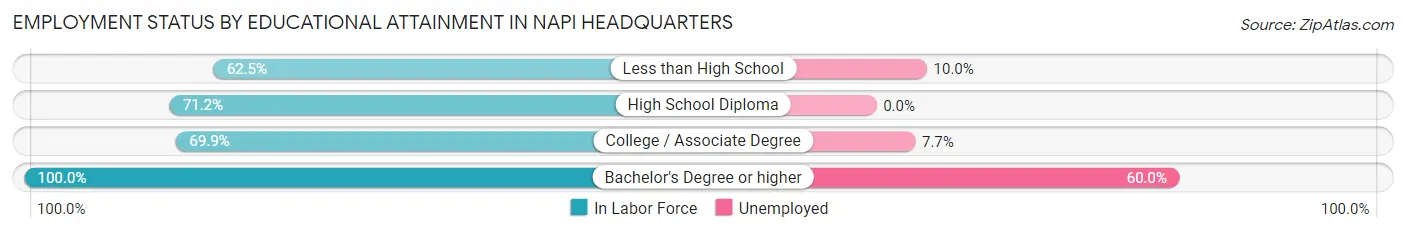
| Educational Attainment | In Labor Force | Unemployed |
| Less than High School | 30 (62.5%) | 5 (10.0%) |
| High School Diploma | 141 (71.2%) | 0 (0.0%) |
| College / Associate Degree | 65 (69.9%) | 7 (7.7%) |
| Bachelor's Degree or higher | 10 (100.0%) | 6 (60.0%) |
| Total | 246 (70.5%) | 20 (5.7%) |
Employment Occupations by Sex in Napi Headquarters
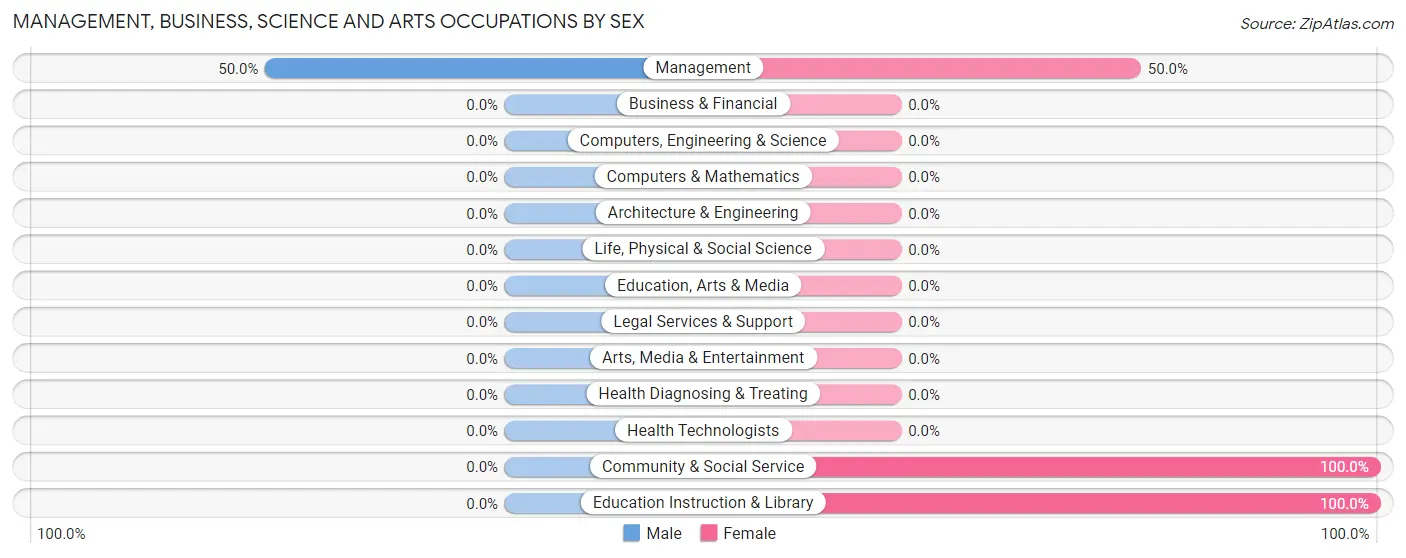
Management, Business, Science and Arts Occupations
The most common Management, Business, Science and Arts occupations in Napi Headquarters are Management (12 | 4.4%), Community & Social Service (8 | 2.9%), and Education Instruction & Library (8 | 2.9%).
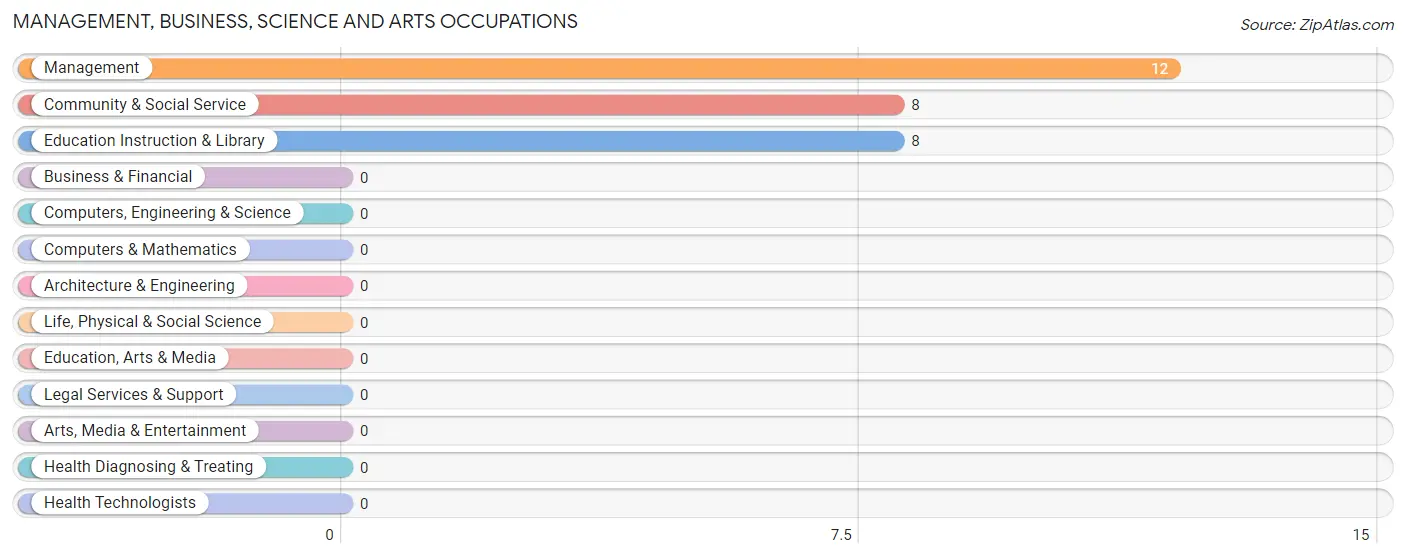
Management, Business, Science and Arts Occupations by Sex
| Occupation | Male | Female |
| Management | 6 (50.0%) | 6 (50.0%) |
| Business & Financial | 0 (0.0%) | 0 (0.0%) |
| Computers, Engineering & Science | 0 (0.0%) | 0 (0.0%) |
| Computers & Mathematics | 0 (0.0%) | 0 (0.0%) |
| Architecture & Engineering | 0 (0.0%) | 0 (0.0%) |
| Life, Physical & Social Science | 0 (0.0%) | 0 (0.0%) |
| Community & Social Service | 0 (0.0%) | 8 (100.0%) |
| Education, Arts & Media | 0 (0.0%) | 0 (0.0%) |
| Legal Services & Support | 0 (0.0%) | 0 (0.0%) |
| Education Instruction & Library | 0 (0.0%) | 8 (100.0%) |
| Arts, Media & Entertainment | 0 (0.0%) | 0 (0.0%) |
| Health Diagnosing & Treating | 0 (0.0%) | 0 (0.0%) |
| Health Technologists | 0 (0.0%) | 0 (0.0%) |
| Total (Category) | 6 (30.0%) | 14 (70.0%) |
| Total (Overall) | 70 (25.5%) | 205 (74.6%) |
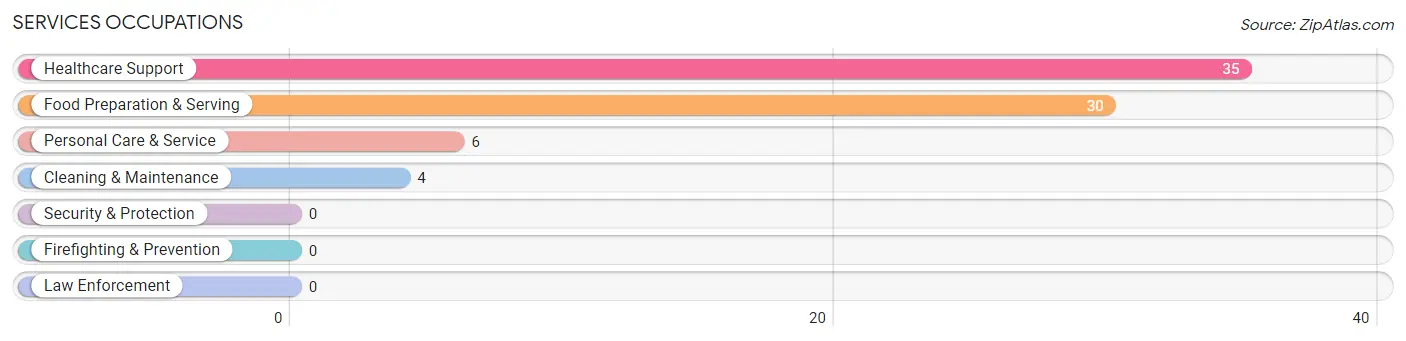
Services Occupations
The most common Services occupations in Napi Headquarters are Healthcare Support (35 | 12.7%), Food Preparation & Serving (30 | 10.9%), Personal Care & Service (6 | 2.2%), and Cleaning & Maintenance (4 | 1.5%).
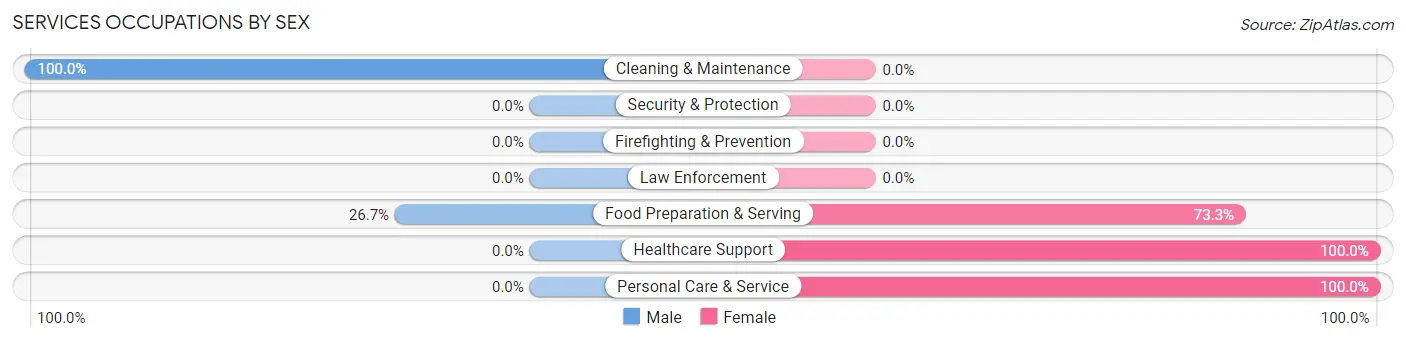
Services Occupations by Sex
Within the Services occupations in Napi Headquarters, the most male-oriented occupations are Cleaning & Maintenance (100.0%), and Food Preparation & Serving (26.7%), while the most female-oriented occupations are Healthcare Support (100.0%), Personal Care & Service (100.0%), and Food Preparation & Serving (73.3%).
| Occupation | Male | Female |
| Healthcare Support | 0 (0.0%) | 35 (100.0%) |
| Security & Protection | 0 (0.0%) | 0 (0.0%) |
| Firefighting & Prevention | 0 (0.0%) | 0 (0.0%) |
| Law Enforcement | 0 (0.0%) | 0 (0.0%) |
| Food Preparation & Serving | 8 (26.7%) | 22 (73.3%) |
| Cleaning & Maintenance | 4 (100.0%) | 0 (0.0%) |
| Personal Care & Service | 0 (0.0%) | 6 (100.0%) |
| Total (Category) | 12 (16.0%) | 63 (84.0%) |
| Total (Overall) | 70 (25.5%) | 205 (74.6%) |
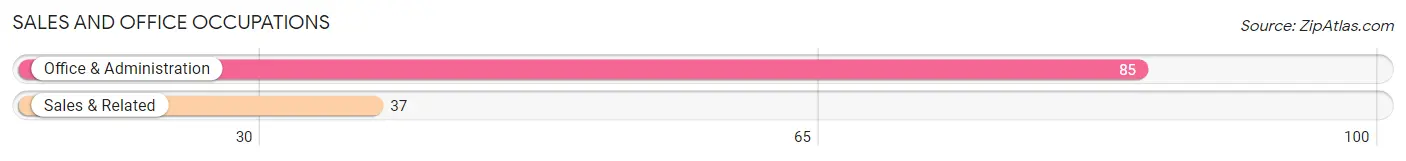
Sales and Office Occupations
The most common Sales and Office occupations in Napi Headquarters are Office & Administration (85 | 30.9%), and Sales & Related (37 | 13.5%).
Sales and Office Occupations by Sex
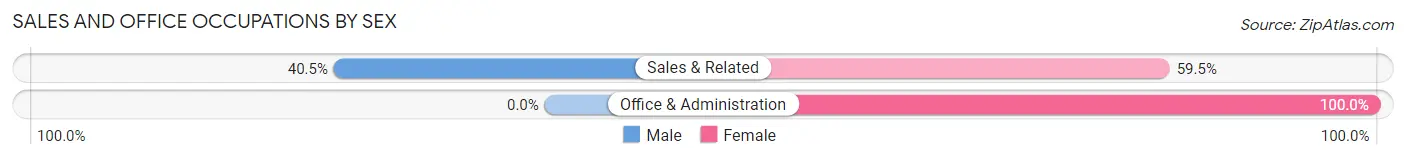
| Occupation | Male | Female |
| Sales & Related | 15 (40.5%) | 22 (59.5%) |
| Office & Administration | 0 (0.0%) | 85 (100.0%) |
| Total (Category) | 15 (12.3%) | 107 (87.7%) |
| Total (Overall) | 70 (25.5%) | 205 (74.6%) |
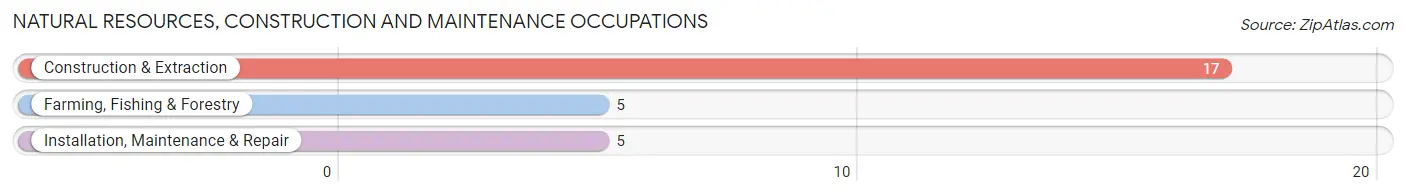
Natural Resources, Construction and Maintenance Occupations
The most common Natural Resources, Construction and Maintenance occupations in Napi Headquarters are Construction & Extraction (17 | 6.2%), Farming, Fishing & Forestry (5 | 1.8%), and Installation, Maintenance & Repair (5 | 1.8%).
Natural Resources, Construction and Maintenance Occupations by Sex
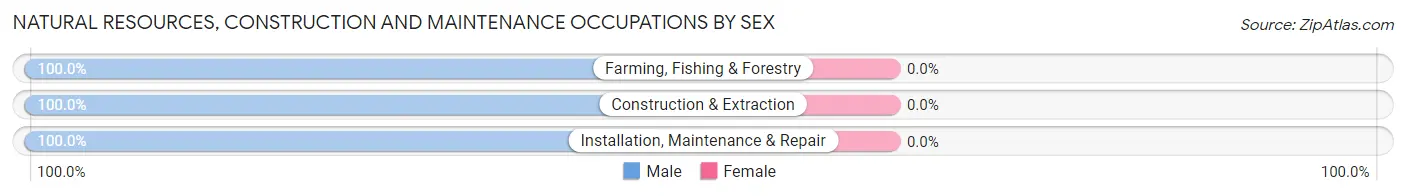
| Occupation | Male | Female |
| Farming, Fishing & Forestry | 5 (100.0%) | 0 (0.0%) |
| Construction & Extraction | 17 (100.0%) | 0 (0.0%) |
| Installation, Maintenance & Repair | 5 (100.0%) | 0 (0.0%) |
| Total (Category) | 27 (100.0%) | 0 (0.0%) |
| Total (Overall) | 70 (25.5%) | 205 (74.6%) |
Production, Transportation and Moving Occupations
The most common Production, Transportation and Moving occupations in Napi Headquarters are Material Moving (16 | 5.8%), and Production (15 | 5.4%).
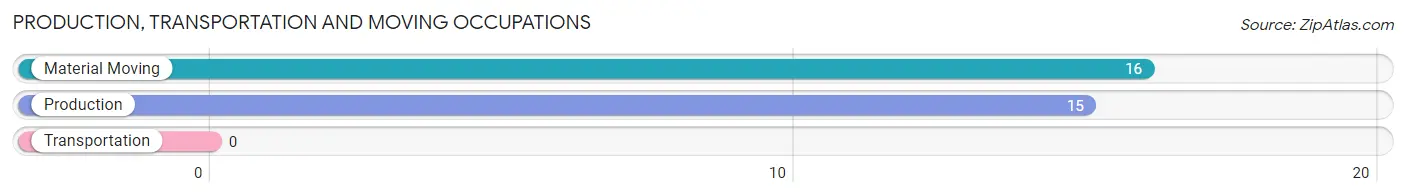
Production, Transportation and Moving Occupations by Sex
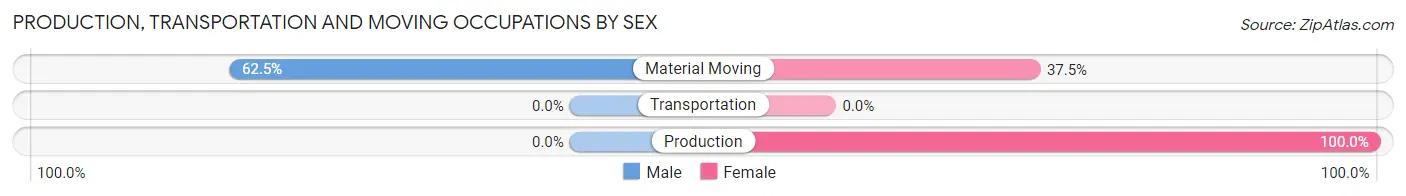
| Occupation | Male | Female |
| Production | 0 (0.0%) | 15 (100.0%) |
| Transportation | 0 (0.0%) | 0 (0.0%) |
| Material Moving | 10 (62.5%) | 6 (37.5%) |
| Total (Category) | 10 (32.3%) | 21 (67.7%) |
| Total (Overall) | 70 (25.5%) | 205 (74.6%) |
Employment Industries by Sex in Napi Headquarters
Employment Industries in Napi Headquarters
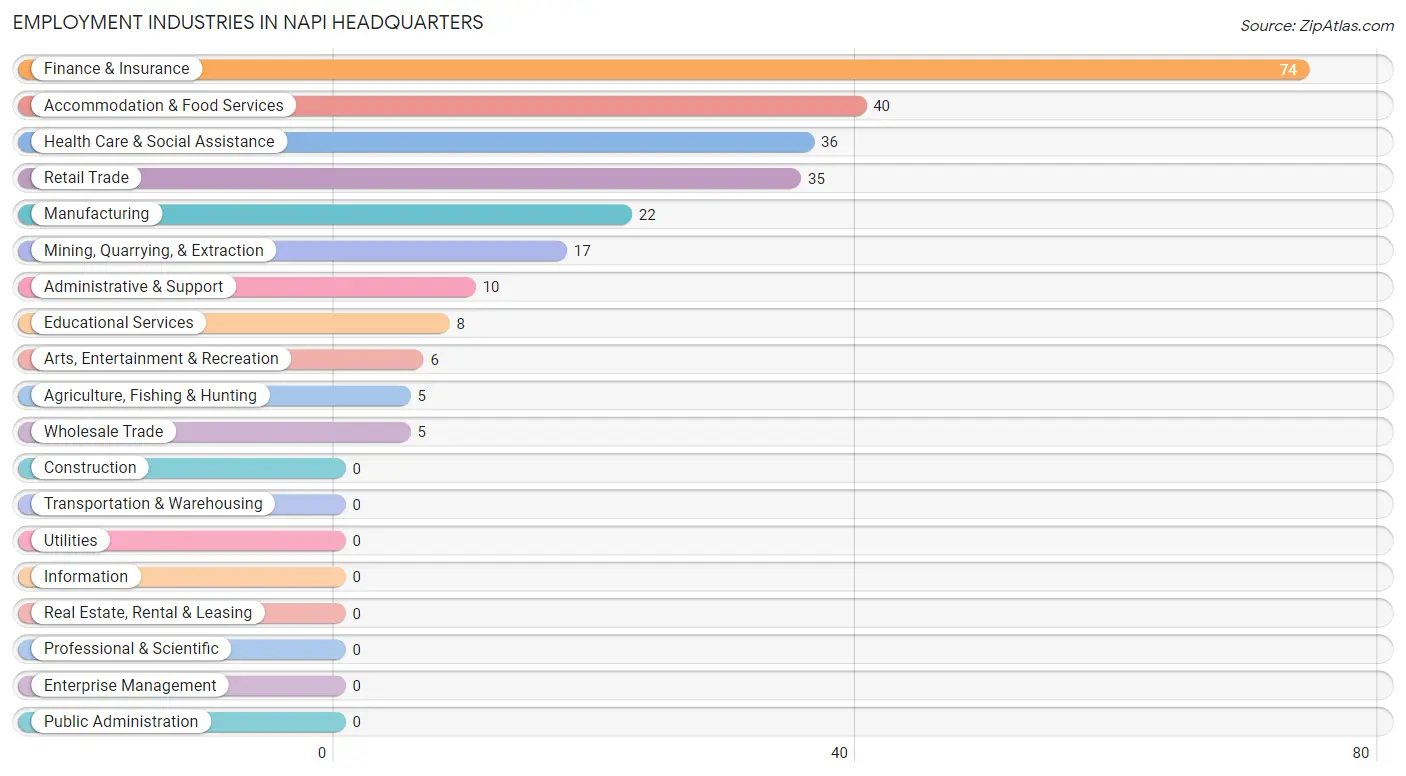
The major employment industries in Napi Headquarters include Finance & Insurance (74 | 26.9%), Accommodation & Food Services (40 | 14.5%), Health Care & Social Assistance (36 | 13.1%), Retail Trade (35 | 12.7%), and Manufacturing (22 | 8.0%).
Employment Industries by Sex in Napi Headquarters
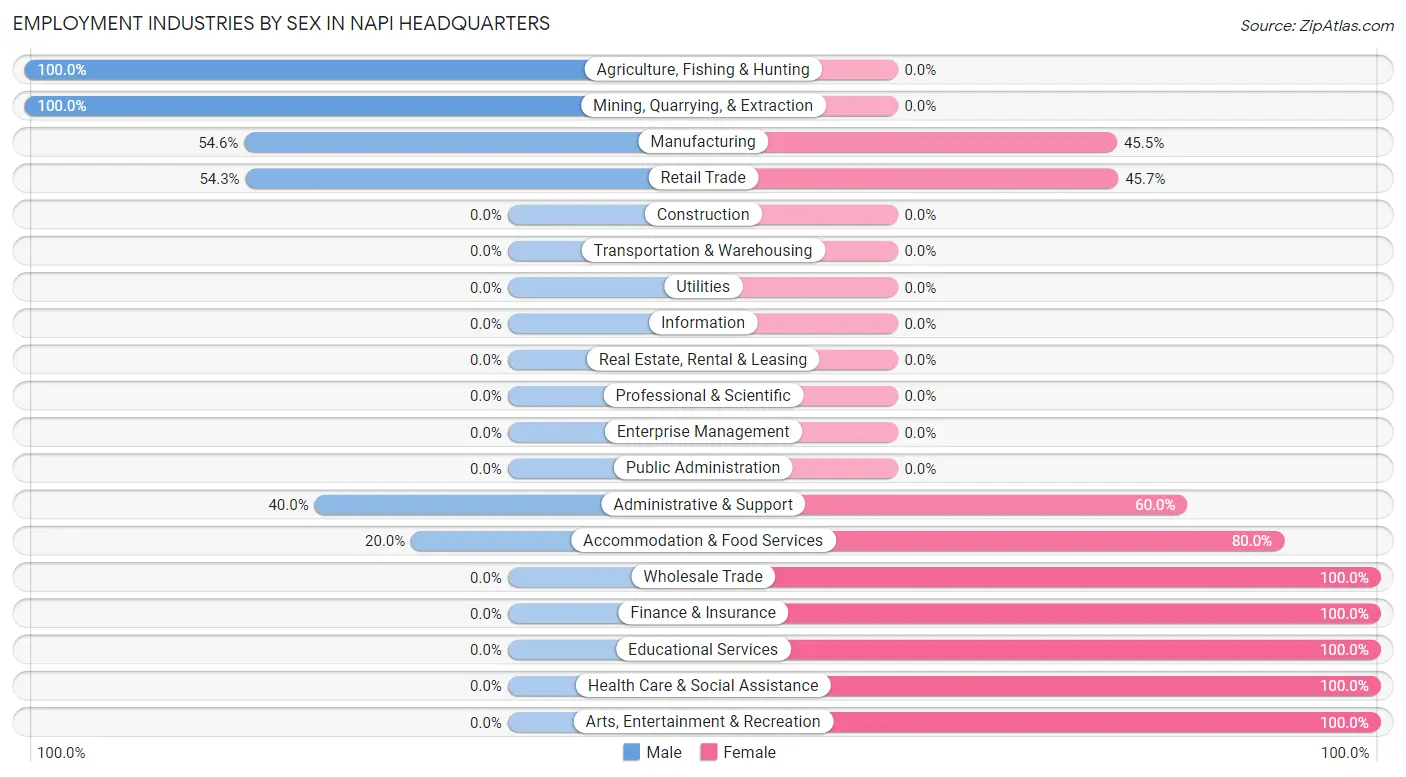
The Napi Headquarters industries that see more men than women are Agriculture, Fishing & Hunting (100.0%), Mining, Quarrying, & Extraction (100.0%), and Manufacturing (54.5%), whereas the industries that tend to have a higher number of women are Wholesale Trade (100.0%), Finance & Insurance (100.0%), and Educational Services (100.0%).
| Industry | Male | Female |
| Agriculture, Fishing & Hunting | 5 (100.0%) | 0 (0.0%) |
| Mining, Quarrying, & Extraction | 17 (100.0%) | 0 (0.0%) |
| Construction | 0 (0.0%) | 0 (0.0%) |
| Manufacturing | 12 (54.5%) | 10 (45.5%) |
| Wholesale Trade | 0 (0.0%) | 5 (100.0%) |
| Retail Trade | 19 (54.3%) | 16 (45.7%) |
| Transportation & Warehousing | 0 (0.0%) | 0 (0.0%) |
| Utilities | 0 (0.0%) | 0 (0.0%) |
| Information | 0 (0.0%) | 0 (0.0%) |
| Finance & Insurance | 0 (0.0%) | 74 (100.0%) |
| Real Estate, Rental & Leasing | 0 (0.0%) | 0 (0.0%) |
| Professional & Scientific | 0 (0.0%) | 0 (0.0%) |
| Enterprise Management | 0 (0.0%) | 0 (0.0%) |
| Administrative & Support | 4 (40.0%) | 6 (60.0%) |
| Educational Services | 0 (0.0%) | 8 (100.0%) |
| Health Care & Social Assistance | 0 (0.0%) | 36 (100.0%) |
| Arts, Entertainment & Recreation | 0 (0.0%) | 6 (100.0%) |
| Accommodation & Food Services | 8 (20.0%) | 32 (80.0%) |
| Public Administration | 0 (0.0%) | 0 (0.0%) |
| Total | 70 (25.5%) | 205 (74.6%) |
Education in Napi Headquarters
School Enrollment in Napi Headquarters
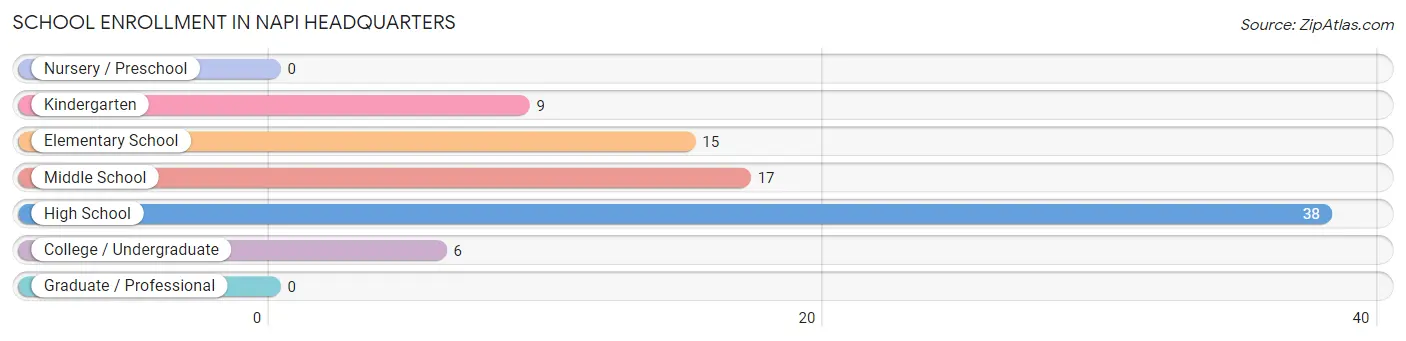
The most common levels of schooling among the 85 students in Napi Headquarters are high school (38 | 44.7%), middle school (17 | 20.0%), and elementary school (15 | 17.6%).
| School Level | # Students | % Students |
| Nursery / Preschool | 0 | 0.0% |
| Kindergarten | 9 | 10.6% |
| Elementary School | 15 | 17.6% |
| Middle School | 17 | 20.0% |
| High School | 38 | 44.7% |
| College / Undergraduate | 6 | 7.1% |
| Graduate / Professional | 0 | 0.0% |
| Total | 85 | 100.0% |
School Enrollment by Age by Funding Source in Napi Headquarters
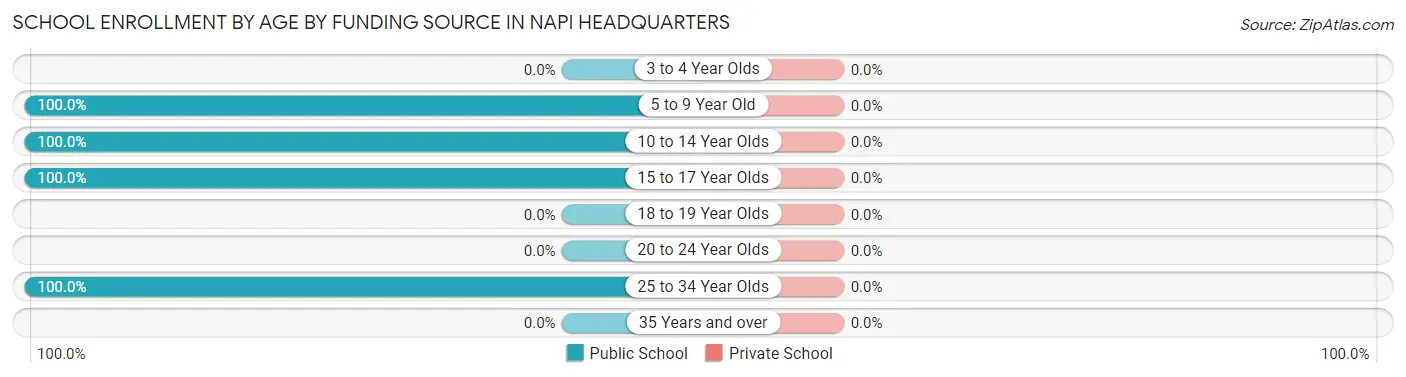
| Age Bracket | Public School | Private School |
| 3 to 4 Year Olds | 0 (0.0%) | 0 (0.0%) |
| 5 to 9 Year Old | 21 (100.0%) | 0 (0.0%) |
| 10 to 14 Year Olds | 20 (100.0%) | 0 (0.0%) |
| 15 to 17 Year Olds | 38 (100.0%) | 0 (0.0%) |
| 18 to 19 Year Olds | 0 (0.0%) | 0 (0.0%) |
| 20 to 24 Year Olds | 0 (0.0%) | 0 (0.0%) |
| 25 to 34 Year Olds | 6 (100.0%) | 0 (0.0%) |
| 35 Years and over | 0 (0.0%) | 0 (0.0%) |
| Total | 85 (100.0%) | 0 (0.0%) |
Educational Attainment by Field of Study in Napi Headquarters
Bio, nature & agricultural (6 | 37.5%), psychology (6 | 37.5%), and education (4 | 25.0%) are the most common fields of study among 16 individuals in Napi Headquarters who have obtained a bachelor's degree or higher.
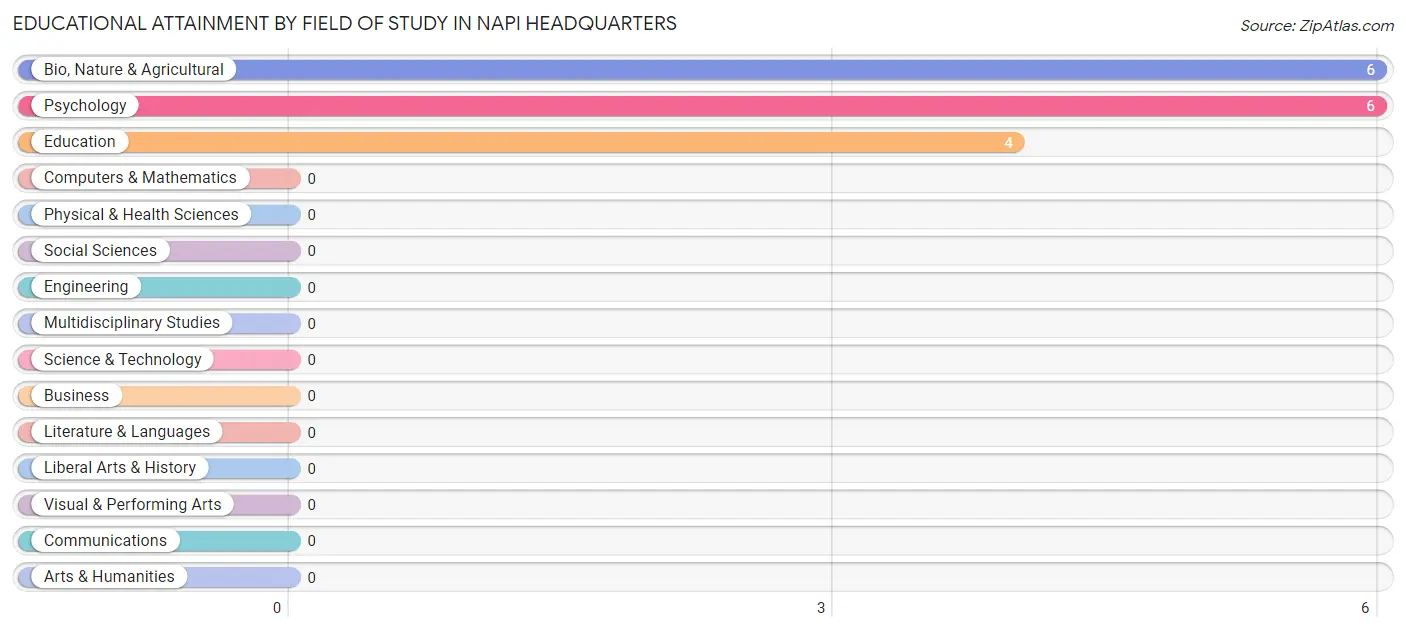
| Field of Study | # Graduates | % Graduates |
| Computers & Mathematics | 0 | 0.0% |
| Bio, Nature & Agricultural | 6 | 37.5% |
| Physical & Health Sciences | 0 | 0.0% |
| Psychology | 6 | 37.5% |
| Social Sciences | 0 | 0.0% |
| Engineering | 0 | 0.0% |
| Multidisciplinary Studies | 0 | 0.0% |
| Science & Technology | 0 | 0.0% |
| Business | 0 | 0.0% |
| Education | 4 | 25.0% |
| Literature & Languages | 0 | 0.0% |
| Liberal Arts & History | 0 | 0.0% |
| Visual & Performing Arts | 0 | 0.0% |
| Communications | 0 | 0.0% |
| Arts & Humanities | 0 | 0.0% |
| Total | 16 | 100.0% |
Transportation & Commute in Napi Headquarters
Vehicle Availability by Sex in Napi Headquarters
The most prevalent vehicle ownership categories in Napi Headquarters are males with 1 vehicle (24, accounting for 34.3%) and females with 1 vehicle (123, making up 12.9%).
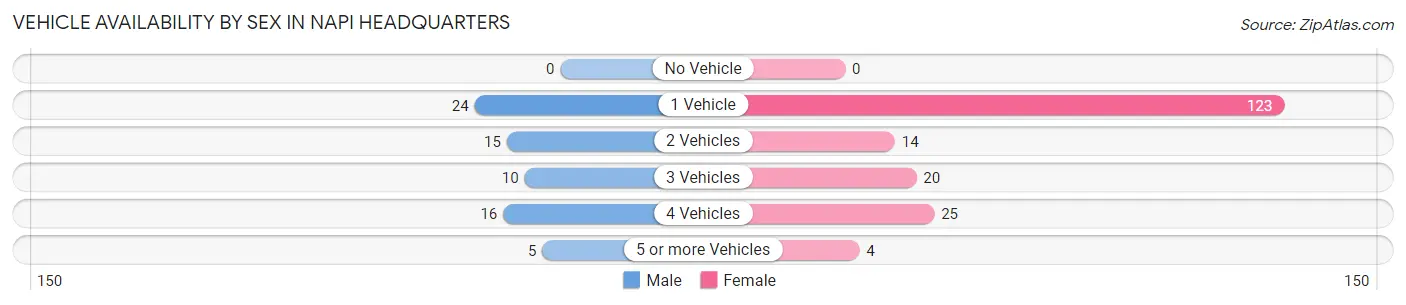
| Vehicles Available | Male | Female |
| No Vehicle | 0 (0.0%) | 0 (0.0%) |
| 1 Vehicle | 24 (34.3%) | 123 (66.1%) |
| 2 Vehicles | 15 (21.4%) | 14 (7.5%) |
| 3 Vehicles | 10 (14.3%) | 20 (10.7%) |
| 4 Vehicles | 16 (22.9%) | 25 (13.4%) |
| 5 or more Vehicles | 5 (7.1%) | 4 (2.1%) |
| Total | 70 (100.0%) | 186 (100.0%) |
Commute Time in Napi Headquarters
The most frequently occuring commute durations in Napi Headquarters are 20 to 24 minutes (104 commuters, 42.3%), 30 to 34 minutes (42 commuters, 17.1%), and 15 to 19 minutes (37 commuters, 15.0%).
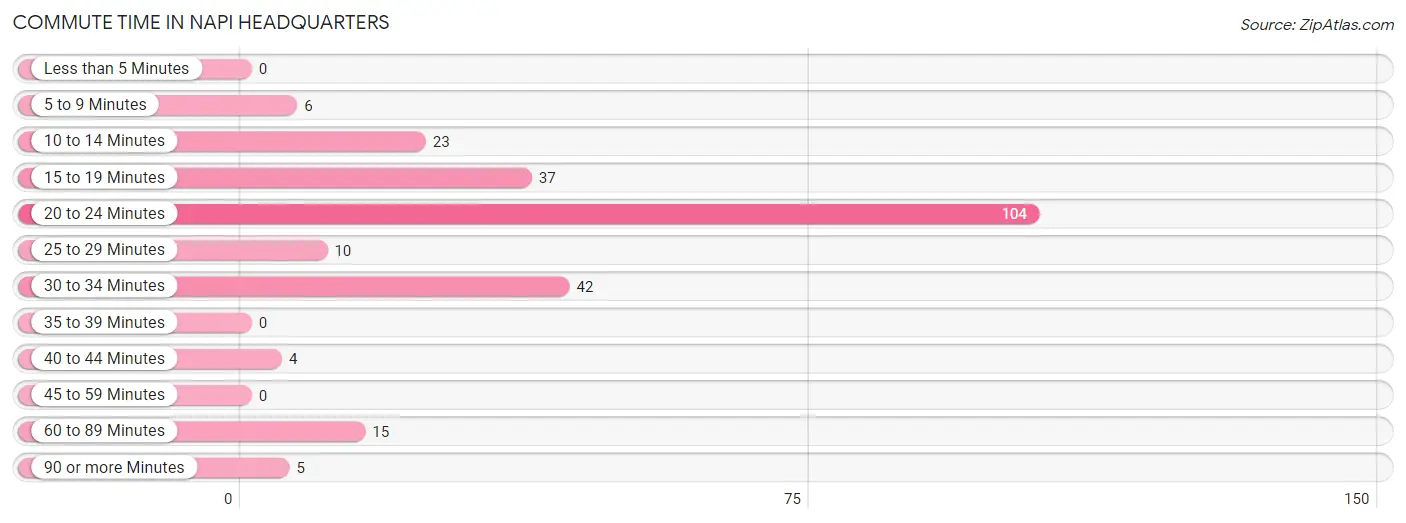
| Commute Time | # Commuters | % Commuters |
| Less than 5 Minutes | 0 | 0.0% |
| 5 to 9 Minutes | 6 | 2.4% |
| 10 to 14 Minutes | 23 | 9.3% |
| 15 to 19 Minutes | 37 | 15.0% |
| 20 to 24 Minutes | 104 | 42.3% |
| 25 to 29 Minutes | 10 | 4.1% |
| 30 to 34 Minutes | 42 | 17.1% |
| 35 to 39 Minutes | 0 | 0.0% |
| 40 to 44 Minutes | 4 | 1.6% |
| 45 to 59 Minutes | 0 | 0.0% |
| 60 to 89 Minutes | 15 | 6.1% |
| 90 or more Minutes | 5 | 2.0% |
Commute Time by Sex in Napi Headquarters
The most common commute times in Napi Headquarters are 15 to 19 minutes (26 commuters, 37.1%) for males and 20 to 24 minutes (104 commuters, 59.1%) for females.
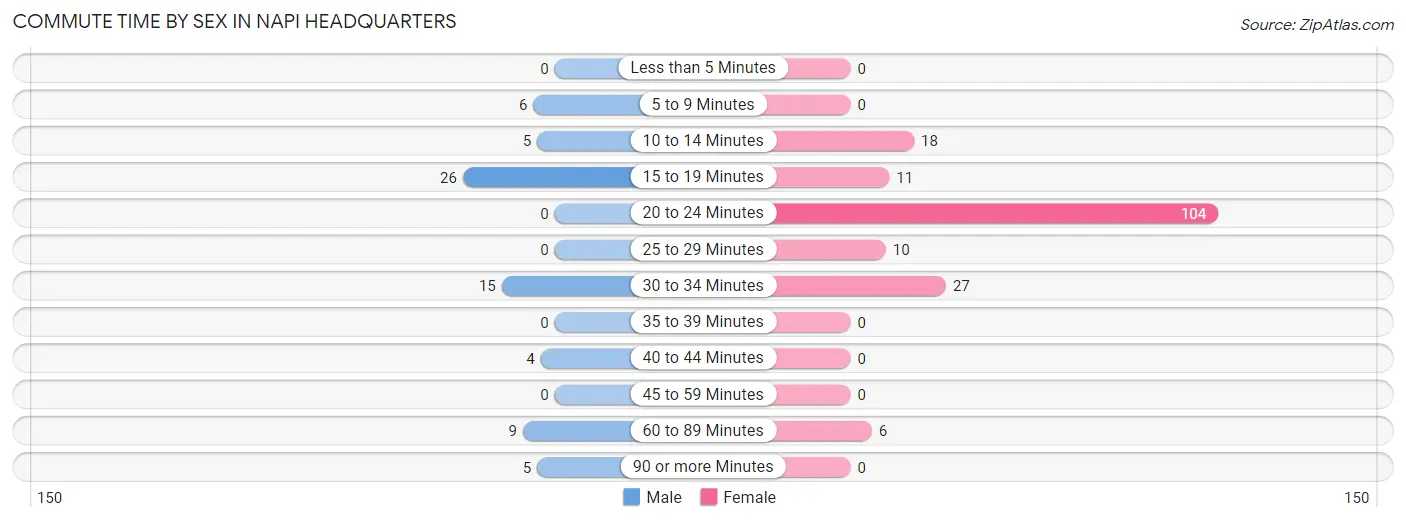
| Commute Time | Male | Female |
| Less than 5 Minutes | 0 (0.0%) | 0 (0.0%) |
| 5 to 9 Minutes | 6 (8.6%) | 0 (0.0%) |
| 10 to 14 Minutes | 5 (7.1%) | 18 (10.2%) |
| 15 to 19 Minutes | 26 (37.1%) | 11 (6.2%) |
| 20 to 24 Minutes | 0 (0.0%) | 104 (59.1%) |
| 25 to 29 Minutes | 0 (0.0%) | 10 (5.7%) |
| 30 to 34 Minutes | 15 (21.4%) | 27 (15.3%) |
| 35 to 39 Minutes | 0 (0.0%) | 0 (0.0%) |
| 40 to 44 Minutes | 4 (5.7%) | 0 (0.0%) |
| 45 to 59 Minutes | 0 (0.0%) | 0 (0.0%) |
| 60 to 89 Minutes | 9 (12.9%) | 6 (3.4%) |
| 90 or more Minutes | 5 (7.1%) | 0 (0.0%) |
Time of Departure to Work by Sex in Napi Headquarters
The most frequent times of departure to work in Napi Headquarters are 8:00 AM to 8:29 AM (21, 30.0%) for males and 7:30 AM to 7:59 AM (78, 44.3%) for females.
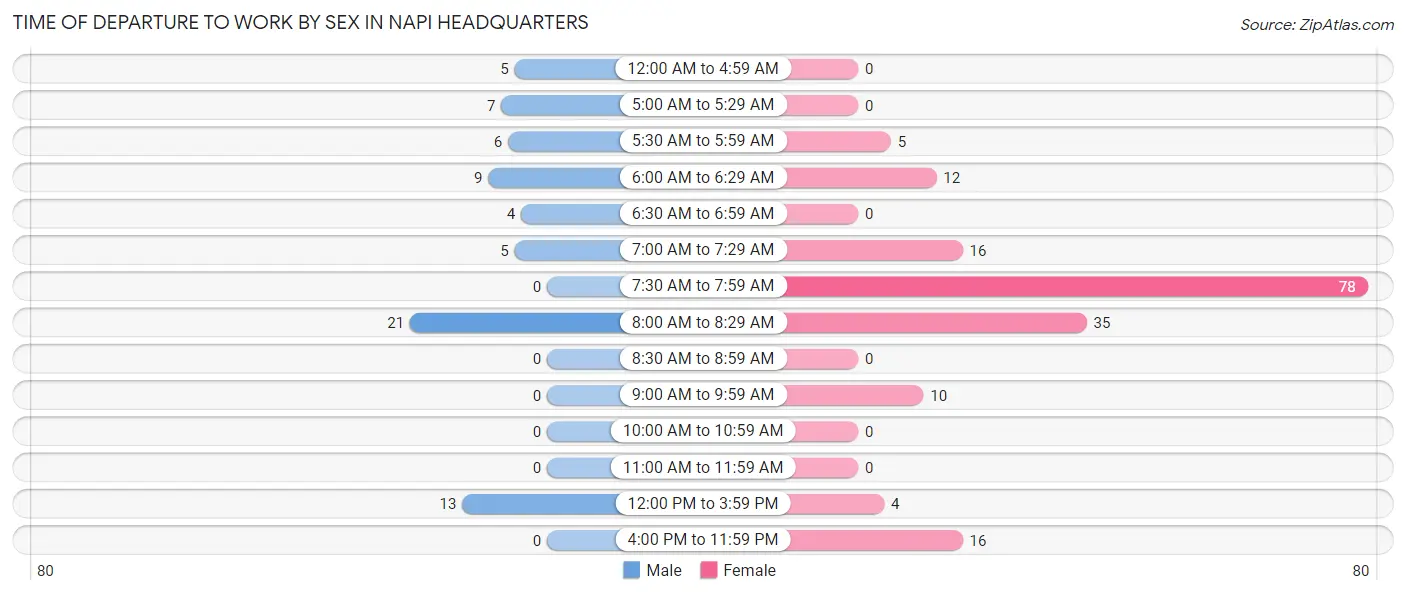
| Time of Departure | Male | Female |
| 12:00 AM to 4:59 AM | 5 (7.1%) | 0 (0.0%) |
| 5:00 AM to 5:29 AM | 7 (10.0%) | 0 (0.0%) |
| 5:30 AM to 5:59 AM | 6 (8.6%) | 5 (2.8%) |
| 6:00 AM to 6:29 AM | 9 (12.9%) | 12 (6.8%) |
| 6:30 AM to 6:59 AM | 4 (5.7%) | 0 (0.0%) |
| 7:00 AM to 7:29 AM | 5 (7.1%) | 16 (9.1%) |
| 7:30 AM to 7:59 AM | 0 (0.0%) | 78 (44.3%) |
| 8:00 AM to 8:29 AM | 21 (30.0%) | 35 (19.9%) |
| 8:30 AM to 8:59 AM | 0 (0.0%) | 0 (0.0%) |
| 9:00 AM to 9:59 AM | 0 (0.0%) | 10 (5.7%) |
| 10:00 AM to 10:59 AM | 0 (0.0%) | 0 (0.0%) |
| 11:00 AM to 11:59 AM | 0 (0.0%) | 0 (0.0%) |
| 12:00 PM to 3:59 PM | 13 (18.6%) | 4 (2.3%) |
| 4:00 PM to 11:59 PM | 0 (0.0%) | 16 (9.1%) |
| Total | 70 (100.0%) | 176 (100.0%) |
Housing Occupancy in Napi Headquarters
Occupancy by Ownership in Napi Headquarters
Of the total 233 dwellings in Napi Headquarters, owner-occupied units account for 57 (24.5%), while renter-occupied units make up 176 (75.5%).
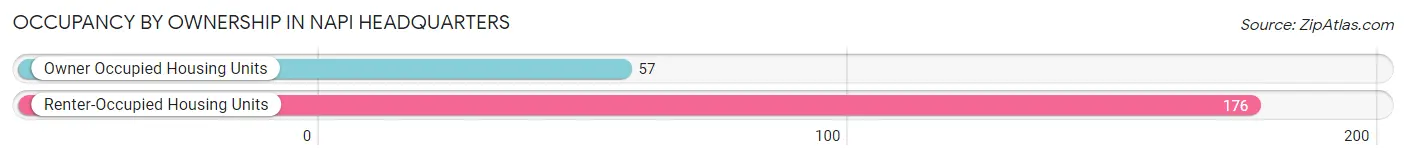
| Occupancy | # Housing Units | % Housing Units |
| Owner Occupied Housing Units | 57 | 24.5% |
| Renter-Occupied Housing Units | 176 | 75.5% |
| Total Occupied Housing Units | 233 | 100.0% |
Occupancy by Household Size in Napi Headquarters
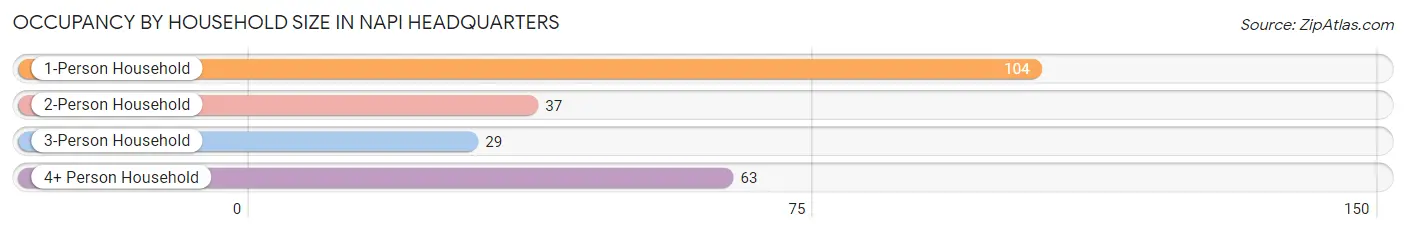
| Household Size | # Housing Units | % Housing Units |
| 1-Person Household | 104 | 44.6% |
| 2-Person Household | 37 | 15.9% |
| 3-Person Household | 29 | 12.4% |
| 4+ Person Household | 63 | 27.0% |
| Total Housing Units | 233 | 100.0% |
Occupancy by Ownership by Household Size in Napi Headquarters
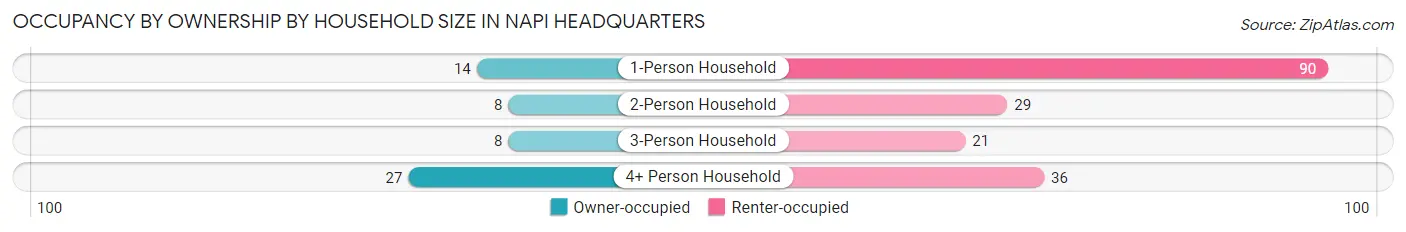
| Household Size | Owner-occupied | Renter-occupied |
| 1-Person Household | 14 (13.5%) | 90 (86.5%) |
| 2-Person Household | 8 (21.6%) | 29 (78.4%) |
| 3-Person Household | 8 (27.6%) | 21 (72.4%) |
| 4+ Person Household | 27 (42.9%) | 36 (57.1%) |
| Total Housing Units | 57 (24.5%) | 176 (75.5%) |
Occupancy by Educational Attainment in Napi Headquarters
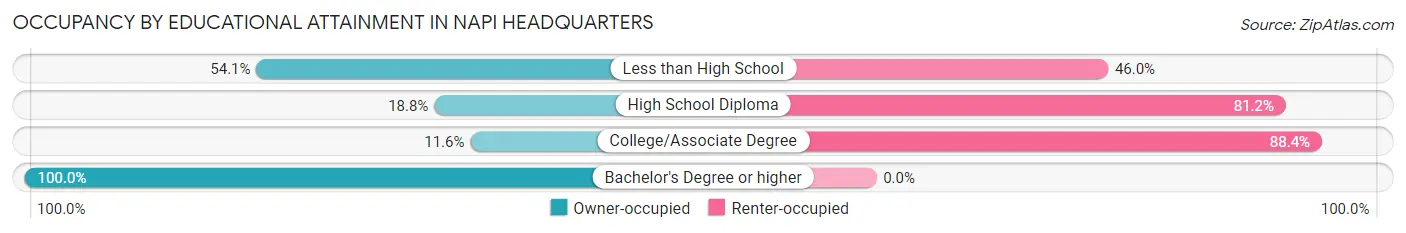
| Household Size | Owner-occupied | Renter-occupied |
| Less than High School | 20 (54.0%) | 17 (46.0%) |
| High School Diploma | 28 (18.8%) | 121 (81.2%) |
| College/Associate Degree | 5 (11.6%) | 38 (88.4%) |
| Bachelor's Degree or higher | 4 (100.0%) | 0 (0.0%) |
Occupancy by Age of Householder in Napi Headquarters
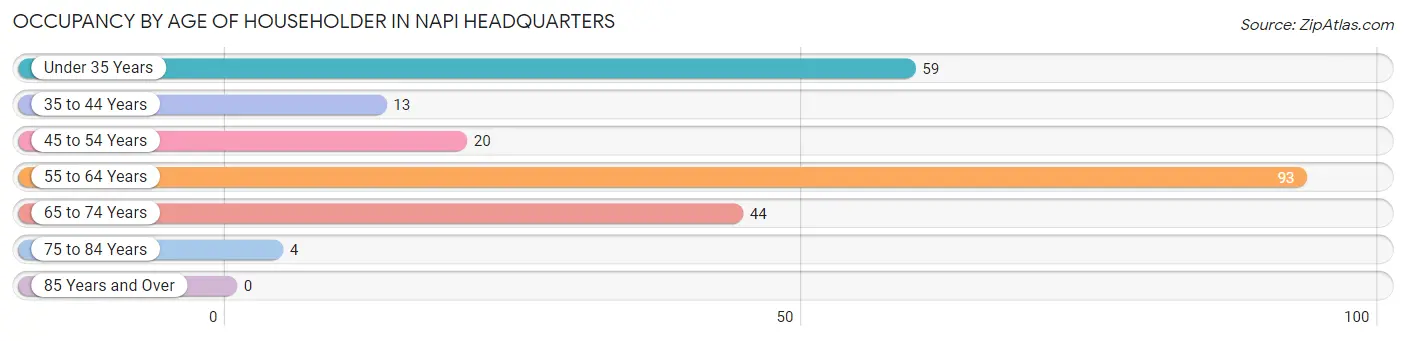
| Age Bracket | # Households | % Households |
| Under 35 Years | 59 | 25.3% |
| 35 to 44 Years | 13 | 5.6% |
| 45 to 54 Years | 20 | 8.6% |
| 55 to 64 Years | 93 | 39.9% |
| 65 to 74 Years | 44 | 18.9% |
| 75 to 84 Years | 4 | 1.7% |
| 85 Years and Over | 0 | 0.0% |
| Total | 233 | 100.0% |
Housing Finances in Napi Headquarters
Median Income by Occupancy in Napi Headquarters
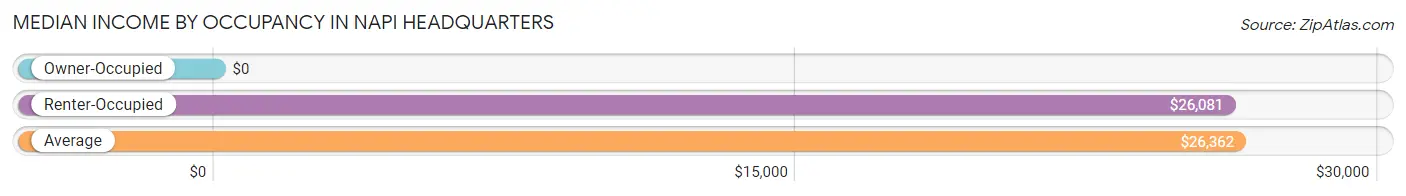
| Occupancy Type | # Households | Median Income |
| Owner-Occupied | 57 (24.5%) | $0 |
| Renter-Occupied | 176 (75.5%) | $26,081 |
| Average | 233 (100.0%) | $26,362 |
Occupancy by Householder Income Bracket in Napi Headquarters
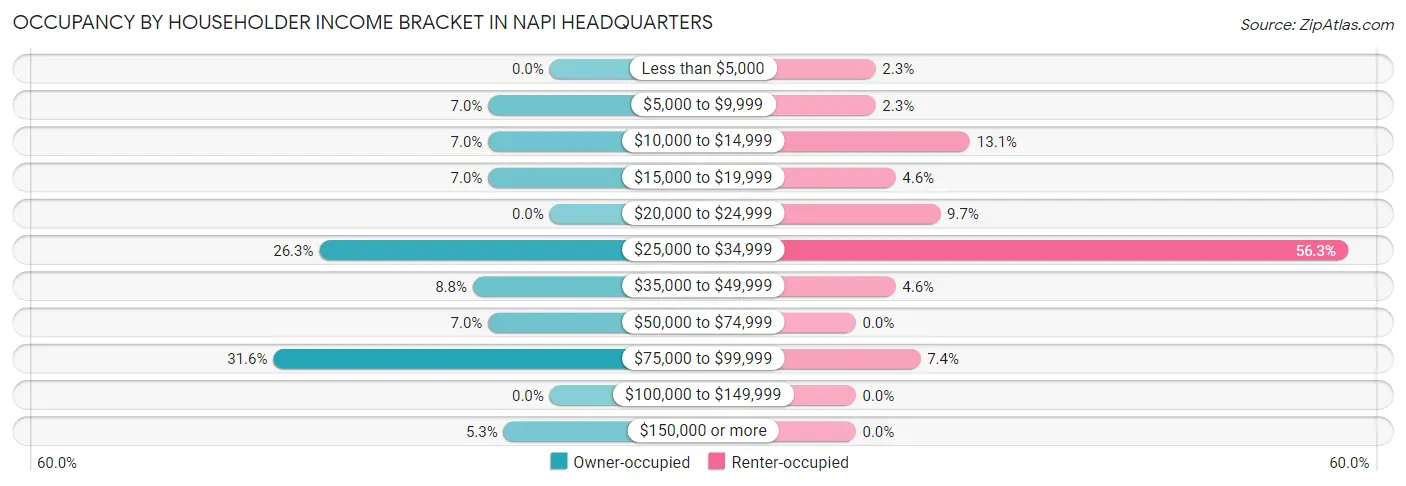
| Income Bracket | Owner-occupied | Renter-occupied |
| Less than $5,000 | 0 (0.0%) | 4 (2.3%) |
| $5,000 to $9,999 | 4 (7.0%) | 4 (2.3%) |
| $10,000 to $14,999 | 4 (7.0%) | 23 (13.1%) |
| $15,000 to $19,999 | 4 (7.0%) | 8 (4.5%) |
| $20,000 to $24,999 | 0 (0.0%) | 17 (9.7%) |
| $25,000 to $34,999 | 15 (26.3%) | 99 (56.2%) |
| $35,000 to $49,999 | 5 (8.8%) | 8 (4.5%) |
| $50,000 to $74,999 | 4 (7.0%) | 0 (0.0%) |
| $75,000 to $99,999 | 18 (31.6%) | 13 (7.4%) |
| $100,000 to $149,999 | 0 (0.0%) | 0 (0.0%) |
| $150,000 or more | 3 (5.3%) | 0 (0.0%) |
| Total | 57 (100.0%) | 176 (100.0%) |
Monthly Housing Cost Tiers in Napi Headquarters
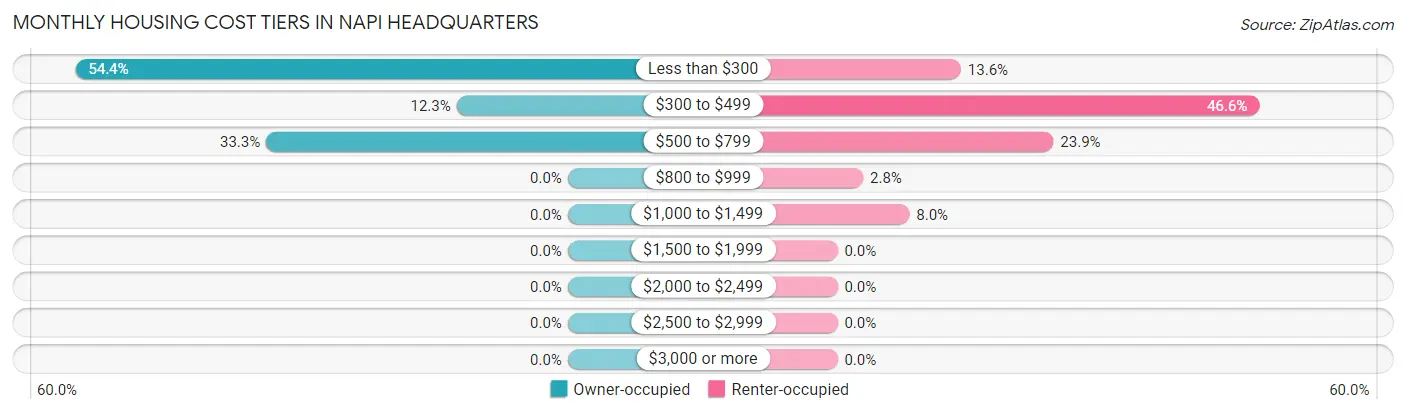
| Monthly Cost | Owner-occupied | Renter-occupied |
| Less than $300 | 31 (54.4%) | 24 (13.6%) |
| $300 to $499 | 7 (12.3%) | 82 (46.6%) |
| $500 to $799 | 19 (33.3%) | 42 (23.9%) |
| $800 to $999 | 0 (0.0%) | 5 (2.8%) |
| $1,000 to $1,499 | 0 (0.0%) | 14 (8.0%) |
| $1,500 to $1,999 | 0 (0.0%) | 0 (0.0%) |
| $2,000 to $2,499 | 0 (0.0%) | 0 (0.0%) |
| $2,500 to $2,999 | 0 (0.0%) | 0 (0.0%) |
| $3,000 or more | 0 (0.0%) | 0 (0.0%) |
| Total | 57 (100.0%) | 176 (100.0%) |
Physical Housing Characteristics in Napi Headquarters
Housing Structures in Napi Headquarters
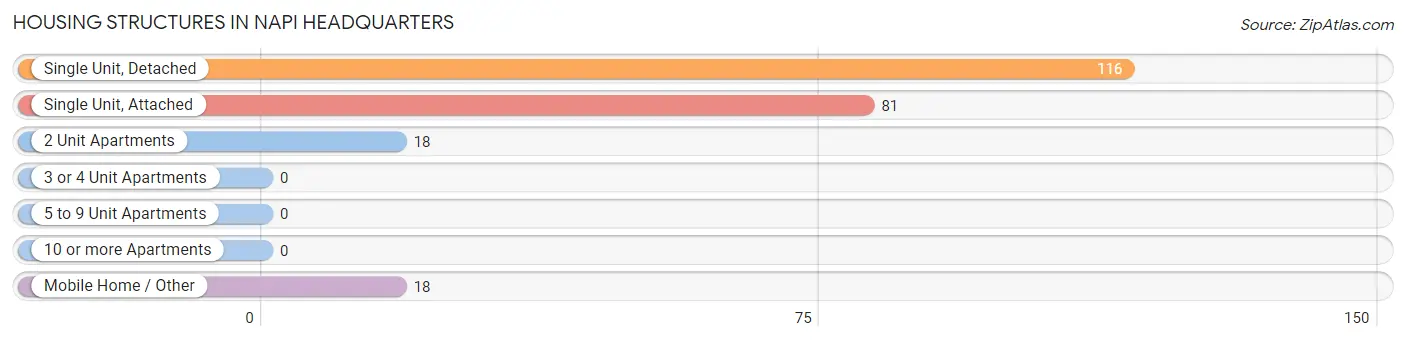
| Structure Type | # Housing Units | % Housing Units |
| Single Unit, Detached | 116 | 49.8% |
| Single Unit, Attached | 81 | 34.8% |
| 2 Unit Apartments | 18 | 7.7% |
| 3 or 4 Unit Apartments | 0 | 0.0% |
| 5 to 9 Unit Apartments | 0 | 0.0% |
| 10 or more Apartments | 0 | 0.0% |
| Mobile Home / Other | 18 | 7.7% |
| Total | 233 | 100.0% |
Housing Structures by Occupancy in Napi Headquarters
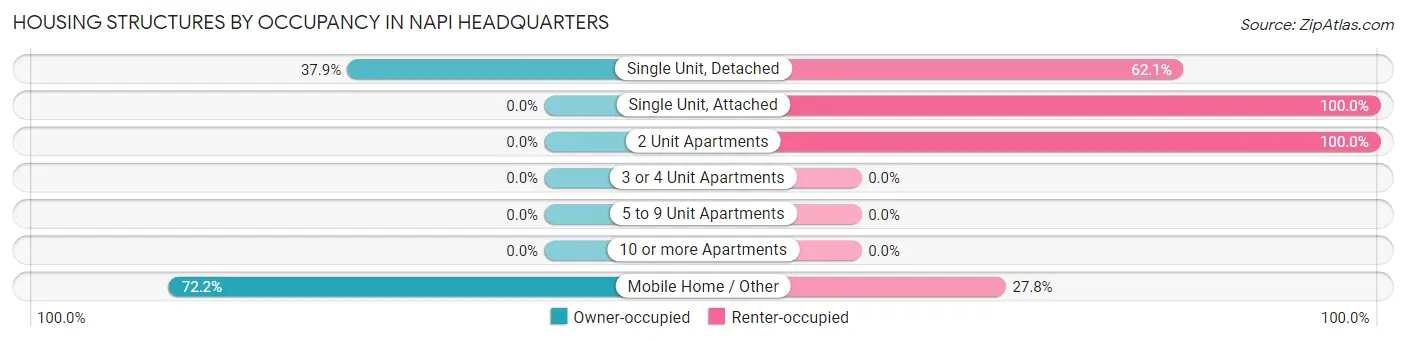
| Structure Type | Owner-occupied | Renter-occupied |
| Single Unit, Detached | 44 (37.9%) | 72 (62.1%) |
| Single Unit, Attached | 0 (0.0%) | 81 (100.0%) |
| 2 Unit Apartments | 0 (0.0%) | 18 (100.0%) |
| 3 or 4 Unit Apartments | 0 (0.0%) | 0 (0.0%) |
| 5 to 9 Unit Apartments | 0 (0.0%) | 0 (0.0%) |
| 10 or more Apartments | 0 (0.0%) | 0 (0.0%) |
| Mobile Home / Other | 13 (72.2%) | 5 (27.8%) |
| Total | 57 (24.5%) | 176 (75.5%) |
Housing Structures by Number of Rooms in Napi Headquarters
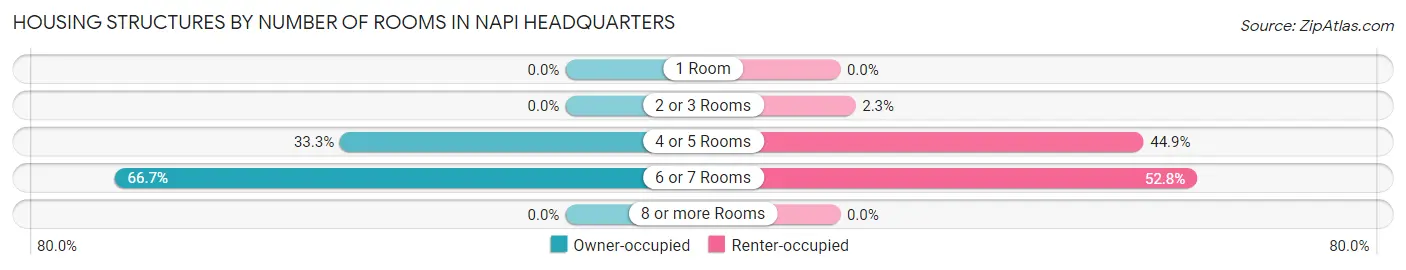
| Number of Rooms | Owner-occupied | Renter-occupied |
| 1 Room | 0 (0.0%) | 0 (0.0%) |
| 2 or 3 Rooms | 0 (0.0%) | 4 (2.3%) |
| 4 or 5 Rooms | 19 (33.3%) | 79 (44.9%) |
| 6 or 7 Rooms | 38 (66.7%) | 93 (52.8%) |
| 8 or more Rooms | 0 (0.0%) | 0 (0.0%) |
| Total | 57 (100.0%) | 176 (100.0%) |
Housing Structure by Heating Type in Napi Headquarters
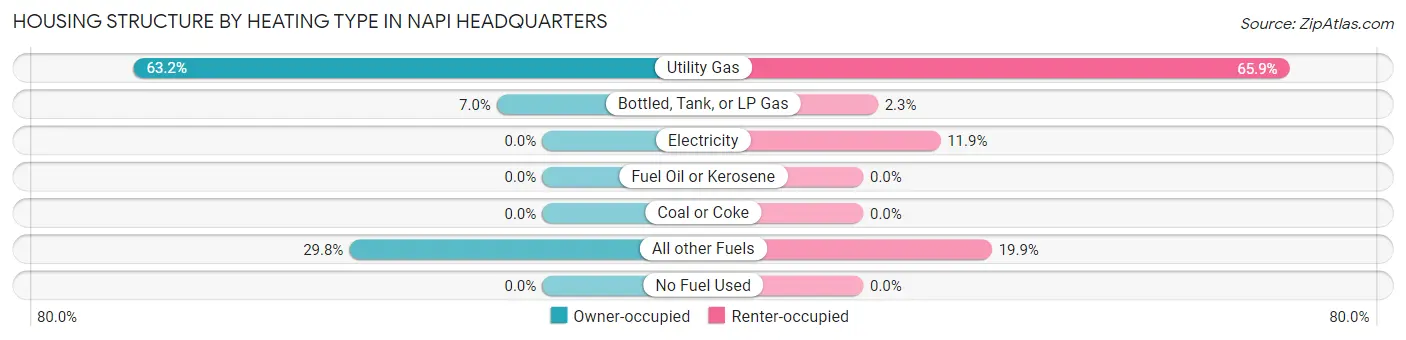
| Heating Type | Owner-occupied | Renter-occupied |
| Utility Gas | 36 (63.2%) | 116 (65.9%) |
| Bottled, Tank, or LP Gas | 4 (7.0%) | 4 (2.3%) |
| Electricity | 0 (0.0%) | 21 (11.9%) |
| Fuel Oil or Kerosene | 0 (0.0%) | 0 (0.0%) |
| Coal or Coke | 0 (0.0%) | 0 (0.0%) |
| All other Fuels | 17 (29.8%) | 35 (19.9%) |
| No Fuel Used | 0 (0.0%) | 0 (0.0%) |
| Total | 57 (100.0%) | 176 (100.0%) |
Household Vehicle Usage in Napi Headquarters
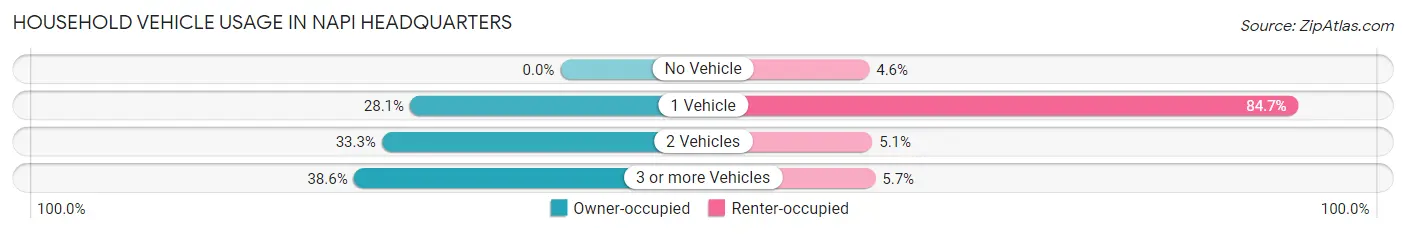
| Vehicles per Household | Owner-occupied | Renter-occupied |
| No Vehicle | 0 (0.0%) | 8 (4.5%) |
| 1 Vehicle | 16 (28.1%) | 149 (84.7%) |
| 2 Vehicles | 19 (33.3%) | 9 (5.1%) |
| 3 or more Vehicles | 22 (38.6%) | 10 (5.7%) |
| Total | 57 (100.0%) | 176 (100.0%) |
Real Estate & Mortgages in Napi Headquarters
Real Estate and Mortgage Overview in Napi Headquarters
| Characteristic | Without Mortgage | With Mortgage |
| Housing Units | 52 | 5 |
| Median Property Value | $53,000 | $0 |
| Median Household Income | - | - |
| Monthly Housing Costs | $238 | $0 |
| Real Estate Taxes | - | - |
Property Value by Mortgage Status in Napi Headquarters
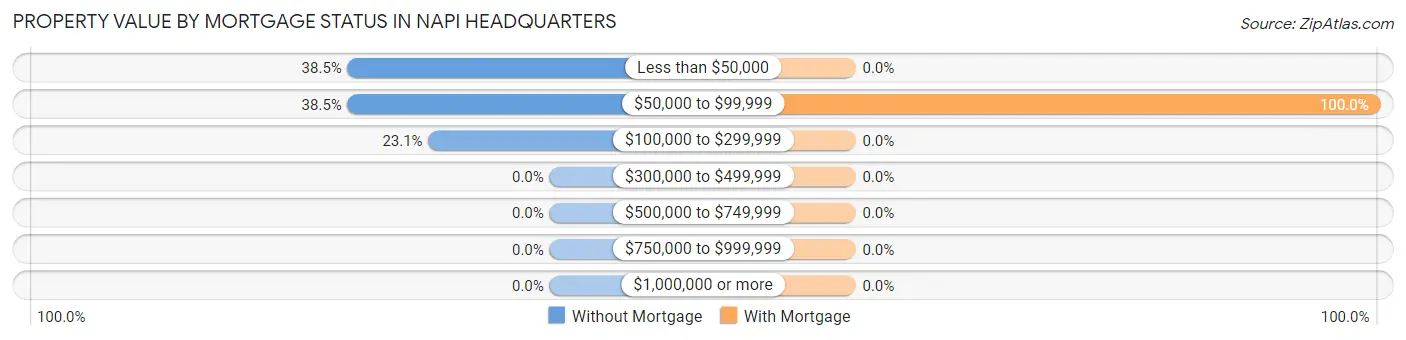
| Property Value | Without Mortgage | With Mortgage |
| Less than $50,000 | 20 (38.5%) | 0 (0.0%) |
| $50,000 to $99,999 | 20 (38.5%) | 5 (100.0%) |
| $100,000 to $299,999 | 12 (23.1%) | 0 (0.0%) |
| $300,000 to $499,999 | 0 (0.0%) | 0 (0.0%) |
| $500,000 to $749,999 | 0 (0.0%) | 0 (0.0%) |
| $750,000 to $999,999 | 0 (0.0%) | 0 (0.0%) |
| $1,000,000 or more | 0 (0.0%) | 0 (0.0%) |
| Total | 52 (100.0%) | 5 (100.0%) |
Household Income by Mortgage Status in Napi Headquarters
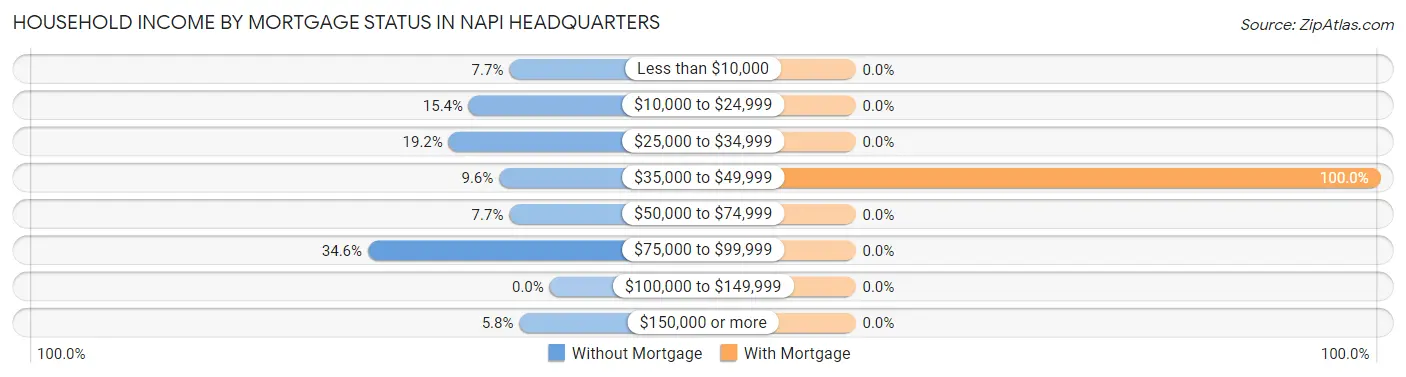
| Household Income | Without Mortgage | With Mortgage |
| Less than $10,000 | 4 (7.7%) | 0 (0.0%) |
| $10,000 to $24,999 | 8 (15.4%) | 0 (0.0%) |
| $25,000 to $34,999 | 10 (19.2%) | 0 (0.0%) |
| $35,000 to $49,999 | 5 (9.6%) | 5 (100.0%) |
| $50,000 to $74,999 | 4 (7.7%) | 0 (0.0%) |
| $75,000 to $99,999 | 18 (34.6%) | 0 (0.0%) |
| $100,000 to $149,999 | 0 (0.0%) | 0 (0.0%) |
| $150,000 or more | 3 (5.8%) | 0 (0.0%) |
| Total | 52 (100.0%) | 5 (100.0%) |
Property Value to Household Income Ratio in Napi Headquarters
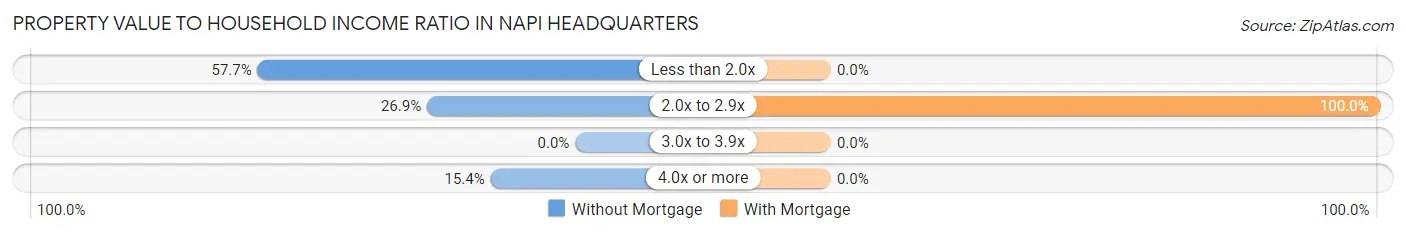
| Value-to-Income Ratio | Without Mortgage | With Mortgage |
| Less than 2.0x | 30 (57.7%) | 0 (0.0%) |
| 2.0x to 2.9x | 14 (26.9%) | 5 (100.0%) |
| 3.0x to 3.9x | 0 (0.0%) | 0 (0.0%) |
| 4.0x or more | 8 (15.4%) | 0 (0.0%) |
| Total | 52 (100.0%) | 5 (100.0%) |
Real Estate Taxes by Mortgage Status in Napi Headquarters
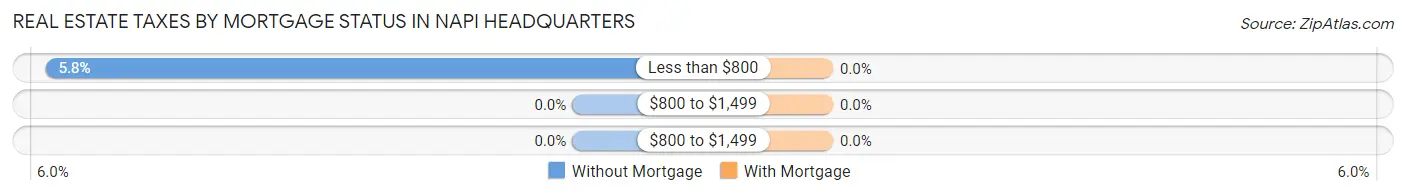
| Property Taxes | Without Mortgage | With Mortgage |
| Less than $800 | 3 (5.8%) | 0 (0.0%) |
| $800 to $1,499 | 0 (0.0%) | 0 (0.0%) |
| $800 to $1,499 | 0 (0.0%) | 0 (0.0%) |
| Total | 52 (100.0%) | 5 (100.0%) |
Health & Disability in Napi Headquarters
Health Insurance Coverage by Age in Napi Headquarters
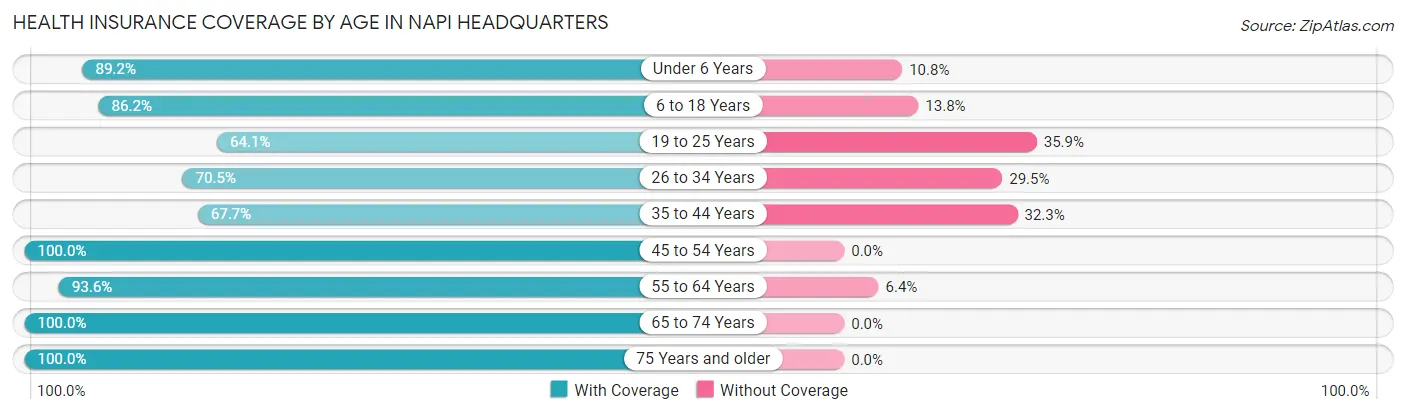
| Age Bracket | With Coverage | Without Coverage |
| Under 6 Years | 33 (89.2%) | 4 (10.8%) |
| 6 to 18 Years | 106 (86.2%) | 17 (13.8%) |
| 19 to 25 Years | 50 (64.1%) | 28 (35.9%) |
| 26 to 34 Years | 79 (70.5%) | 33 (29.5%) |
| 35 to 44 Years | 44 (67.7%) | 21 (32.3%) |
| 45 to 54 Years | 28 (100.0%) | 0 (0.0%) |
| 55 to 64 Years | 117 (93.6%) | 8 (6.4%) |
| 65 to 74 Years | 53 (100.0%) | 0 (0.0%) |
| 75 Years and older | 7 (100.0%) | 0 (0.0%) |
| Total | 517 (82.3%) | 111 (17.7%) |
Health Insurance Coverage by Citizenship Status in Napi Headquarters
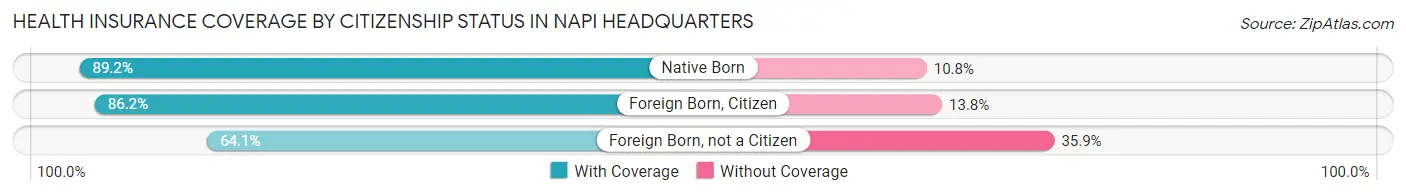
| Citizenship Status | With Coverage | Without Coverage |
| Native Born | 33 (89.2%) | 4 (10.8%) |
| Foreign Born, Citizen | 106 (86.2%) | 17 (13.8%) |
| Foreign Born, not a Citizen | 50 (64.1%) | 28 (35.9%) |
Health Insurance Coverage by Household Income in Napi Headquarters
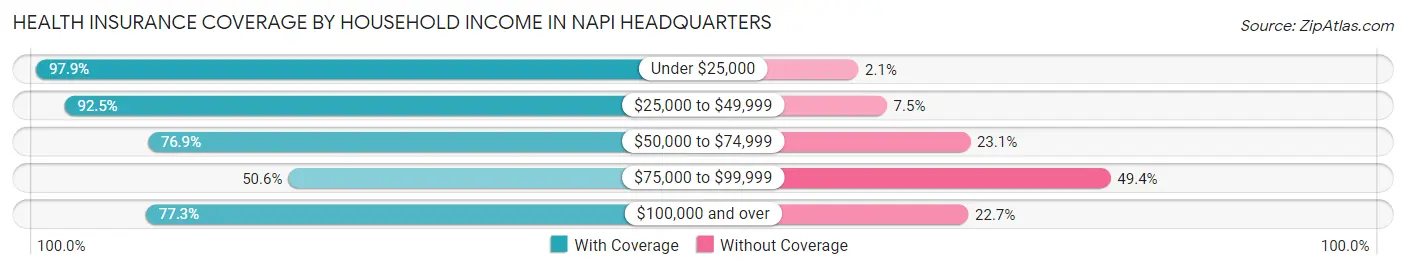
| Household Income | With Coverage | Without Coverage |
| Under $25,000 | 184 (97.9%) | 4 (2.1%) |
| $25,000 to $49,999 | 223 (92.5%) | 18 (7.5%) |
| $50,000 to $74,999 | 10 (76.9%) | 3 (23.1%) |
| $75,000 to $99,999 | 83 (50.6%) | 81 (49.4%) |
| $100,000 and over | 17 (77.3%) | 5 (22.7%) |
Public vs Private Health Insurance Coverage by Age in Napi Headquarters
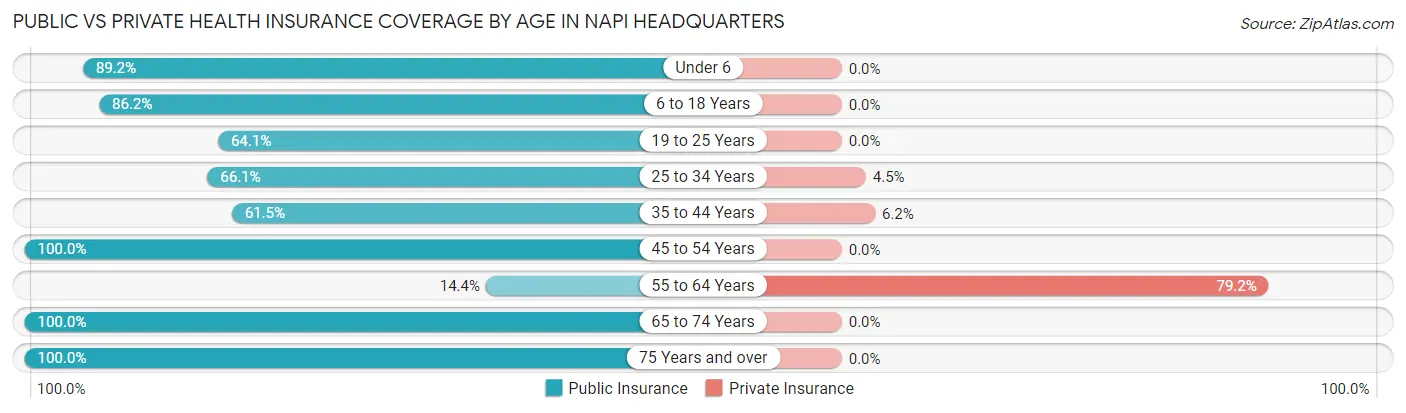
| Age Bracket | Public Insurance | Private Insurance |
| Under 6 | 33 (89.2%) | 0 (0.0%) |
| 6 to 18 Years | 106 (86.2%) | 0 (0.0%) |
| 19 to 25 Years | 50 (64.1%) | 0 (0.0%) |
| 25 to 34 Years | 74 (66.1%) | 5 (4.5%) |
| 35 to 44 Years | 40 (61.5%) | 4 (6.1%) |
| 45 to 54 Years | 28 (100.0%) | 0 (0.0%) |
| 55 to 64 Years | 18 (14.4%) | 99 (79.2%) |
| 65 to 74 Years | 53 (100.0%) | 0 (0.0%) |
| 75 Years and over | 7 (100.0%) | 0 (0.0%) |
| Total | 409 (65.1%) | 108 (17.2%) |
Disability Status by Sex by Age in Napi Headquarters
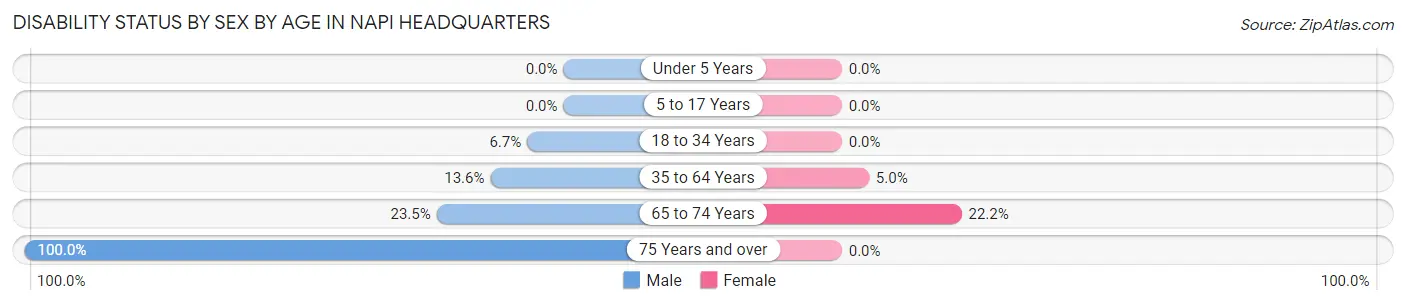
| Age Bracket | Male | Female |
| Under 5 Years | 0 (0.0%) | 0 (0.0%) |
| 5 to 17 Years | 0 (0.0%) | 0 (0.0%) |
| 18 to 34 Years | 6 (6.7%) | 0 (0.0%) |
| 35 to 64 Years | 8 (13.6%) | 8 (5.0%) |
| 65 to 74 Years | 4 (23.5%) | 8 (22.2%) |
| 75 Years and over | 7 (100.0%) | 0 (0.0%) |
Disability Class by Sex by Age in Napi Headquarters
Disability Class: Hearing Difficulty
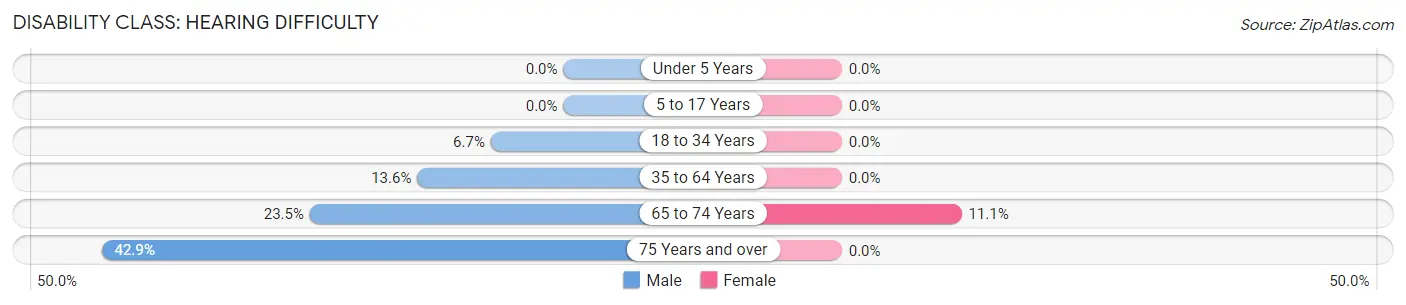
| Age Bracket | Male | Female |
| Under 5 Years | 0 (0.0%) | 0 (0.0%) |
| 5 to 17 Years | 0 (0.0%) | 0 (0.0%) |
| 18 to 34 Years | 6 (6.7%) | 0 (0.0%) |
| 35 to 64 Years | 8 (13.6%) | 0 (0.0%) |
| 65 to 74 Years | 4 (23.5%) | 4 (11.1%) |
| 75 Years and over | 3 (42.9%) | 0 (0.0%) |
Disability Class: Vision Difficulty
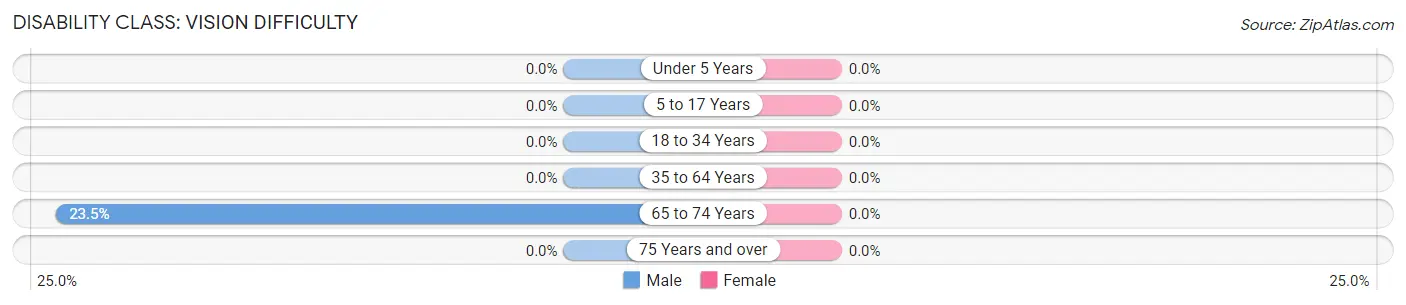
| Age Bracket | Male | Female |
| Under 5 Years | 0 (0.0%) | 0 (0.0%) |
| 5 to 17 Years | 0 (0.0%) | 0 (0.0%) |
| 18 to 34 Years | 0 (0.0%) | 0 (0.0%) |
| 35 to 64 Years | 0 (0.0%) | 0 (0.0%) |
| 65 to 74 Years | 4 (23.5%) | 0 (0.0%) |
| 75 Years and over | 0 (0.0%) | 0 (0.0%) |
Disability Class: Cognitive Difficulty
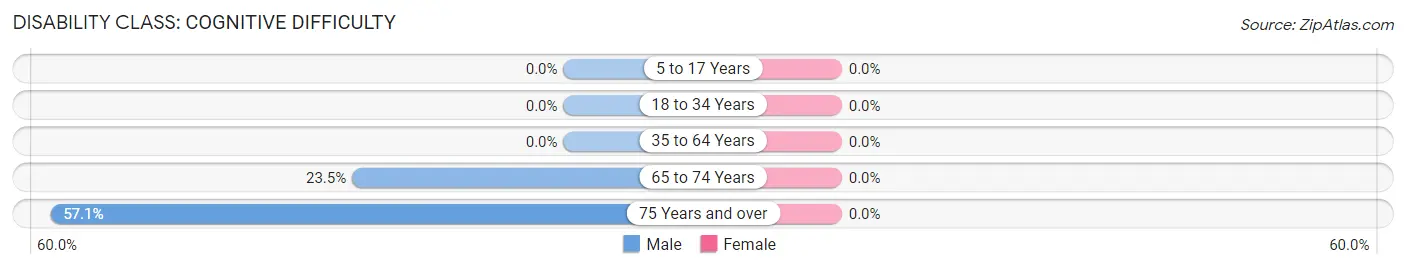
| Age Bracket | Male | Female |
| 5 to 17 Years | 0 (0.0%) | 0 (0.0%) |
| 18 to 34 Years | 0 (0.0%) | 0 (0.0%) |
| 35 to 64 Years | 0 (0.0%) | 0 (0.0%) |
| 65 to 74 Years | 4 (23.5%) | 0 (0.0%) |
| 75 Years and over | 4 (57.1%) | 0 (0.0%) |
Disability Class: Ambulatory Difficulty
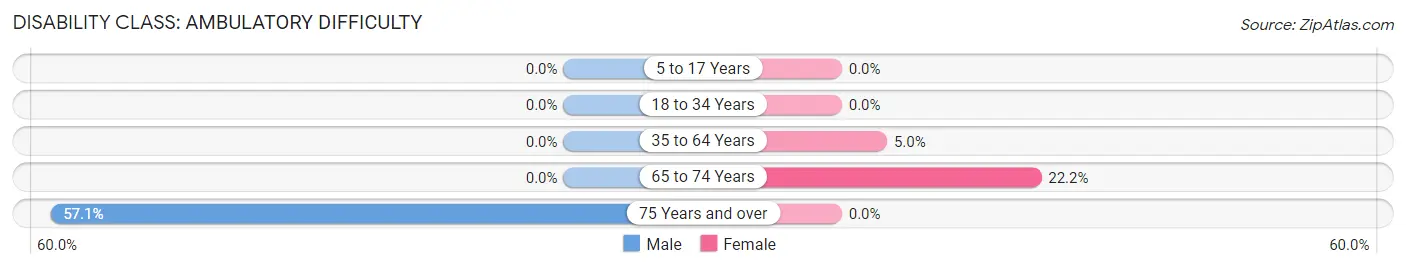
| Age Bracket | Male | Female |
| 5 to 17 Years | 0 (0.0%) | 0 (0.0%) |
| 18 to 34 Years | 0 (0.0%) | 0 (0.0%) |
| 35 to 64 Years | 0 (0.0%) | 8 (5.0%) |
| 65 to 74 Years | 0 (0.0%) | 8 (22.2%) |
| 75 Years and over | 4 (57.1%) | 0 (0.0%) |
Disability Class: Self-Care Difficulty
| Age Bracket | Male | Female |
| 5 to 17 Years | 0 (0.0%) | 0 (0.0%) |
| 18 to 34 Years | 0 (0.0%) | 0 (0.0%) |
| 35 to 64 Years | 0 (0.0%) | 0 (0.0%) |
| 65 to 74 Years | 0 (0.0%) | 0 (0.0%) |
| 75 Years and over | 0 (0.0%) | 0 (0.0%) |
Technology Access in Napi Headquarters
Computing Device Access in Napi Headquarters
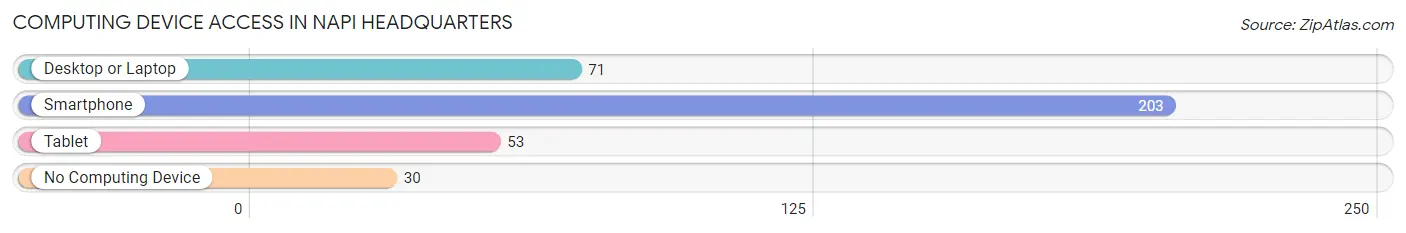
| Device Type | # Households | % Households |
| Desktop or Laptop | 71 | 30.5% |
| Smartphone | 203 | 87.1% |
| Tablet | 53 | 22.8% |
| No Computing Device | 30 | 12.9% |
| Total | 233 | 100.0% |
Internet Access in Napi Headquarters
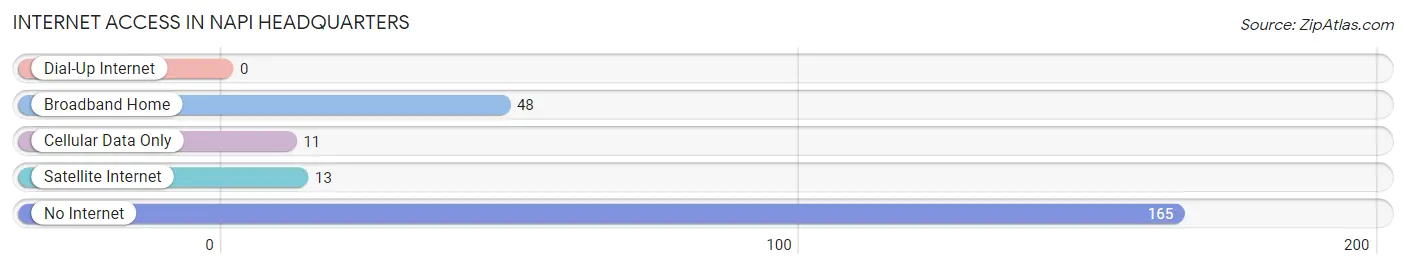
| Internet Type | # Households | % Households |
| Dial-Up Internet | 0 | 0.0% |
| Broadband Home | 48 | 20.6% |
| Cellular Data Only | 11 | 4.7% |
| Satellite Internet | 13 | 5.6% |
| No Internet | 165 | 70.8% |
| Total | 233 | 100.0% |
Napi Headquarters Summary
Napi Headquarters is a census-designated place (CDP) located in McKinley County, New Mexico. It is located on the Navajo Nation, the largest Native American reservation in the United States. As of the 2010 census, the population of Napi Headquarters was 1,845.
History
The area that is now Napi Headquarters has been inhabited by the Navajo people for centuries. The Navajo Nation was established in 1868, and the area was officially recognized as part of the Navajo Nation in 1934. The name “Napi Headquarters” was given to the area in the 1950s, when the Navajo Nation established a headquarters in the area.
Geography
Napi Headquarters is located in the northwestern corner of McKinley County, New Mexico. It is situated at an elevation of 6,400 feet above sea level. The area is characterized by rolling hills and mesas, with the Chuska Mountains to the east and the San Juan Mountains to the west. The climate is semi-arid, with hot summers and cold winters.
Economy
The economy of Napi Headquarters is largely based on agriculture and tourism. The area is home to several farms and ranches, which produce a variety of crops and livestock. Tourism is also an important part of the local economy, with visitors coming to the area to explore the nearby Navajo Nation and to take part in outdoor activities such as hiking, camping, and fishing.
Demographics
As of the 2010 census, the population of Napi Headquarters was 1,845. The population is predominantly Native American, with 95.3% of the population identifying as Native American. The median household income is $25,938, and the median age is 33.7 years.
Conclusion
Napi Headquarters is a census-designated place located in McKinley County, New Mexico. It is situated on the Navajo Nation, the largest Native American reservation in the United States. The area has a long history of inhabitation by the Navajo people, and the name “Napi Headquarters” was given to the area in the 1950s. The economy of Napi Headquarters is largely based on agriculture and tourism, and the population is predominantly Native American.
Common Questions
What is Per Capita Income in Napi Headquarters?
Per Capita income in Napi Headquarters is $13,915.
What is the Median Family Income in Napi Headquarters?
Median Family Income in Napi Headquarters is $26,875.
What is the Median Household income in Napi Headquarters?
Median Household Income in Napi Headquarters is $26,362.
What is Income or Wage Gap in Napi Headquarters?
Income or Wage Gap in Napi Headquarters is 9.3%.
Women in Napi Headquarters earn 90.7 cents for every dollar earned by a man.
What is Inequality or Gini Index in Napi Headquarters?
Inequality or Gini Index in Napi Headquarters is 0.36.
What is the Total Population of Napi Headquarters?
Total Population of Napi Headquarters is 628.
What is the Total Male Population of Napi Headquarters?
Total Male Population of Napi Headquarters is 227.
What is the Total Female Population of Napi Headquarters?
Total Female Population of Napi Headquarters is 401.
What is the Ratio of Males per 100 Females in Napi Headquarters?
There are 56.61 Males per 100 Females in Napi Headquarters.
What is the Ratio of Females per 100 Males in Napi Headquarters?
There are 176.65 Females per 100 Males in Napi Headquarters.
What is the Median Population Age in Napi Headquarters?
Median Population Age in Napi Headquarters is 29.8 Years.
What is the Average Family Size in Napi Headquarters
Average Family Size in Napi Headquarters is 4.4 People.
What is the Average Household Size in Napi Headquarters
Average Household Size in Napi Headquarters is 2.7 People.
How Large is the Labor Force in Napi Headquarters?
There are 289 People in the Labor Forcein in Napi Headquarters.
What is the Percentage of People in the Labor Force in Napi Headquarters?
57.2% of People are in the Labor Force in Napi Headquarters.
What is the Unemployment Rate in Napi Headquarters?
Unemployment Rate in Napi Headquarters is 4.8%.