Zip Codes with the Highest Percentage of Population Employed in Food Preparation & Serving in Roswell, NM
RELATED REPORTS & OPTIONS
Food Preparation & Serving
Roswell
Compare Zip Codes
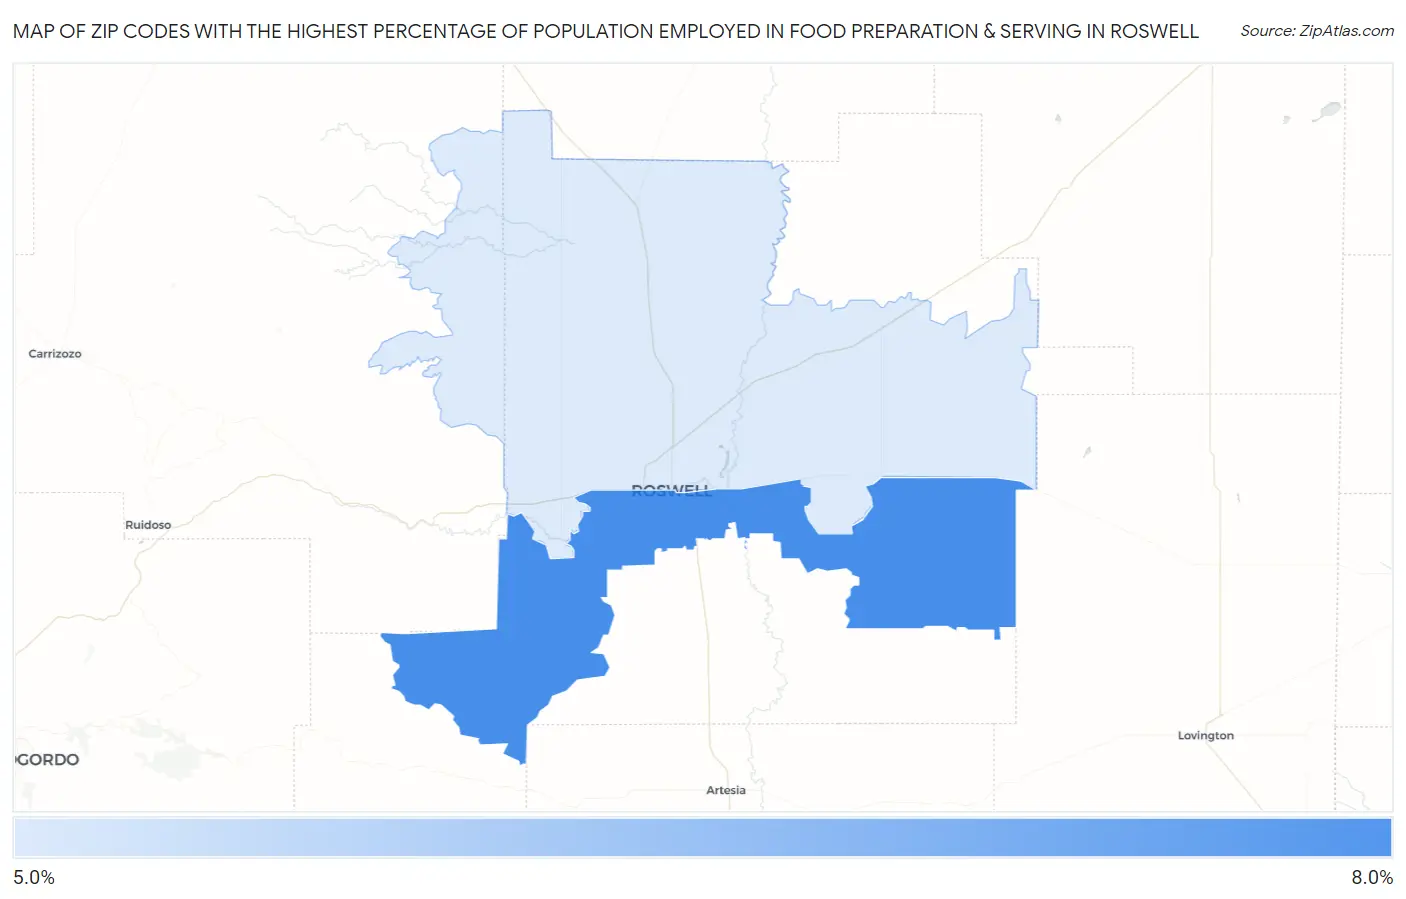
Map of Zip Codes with the Highest Percentage of Population Employed in Food Preparation & Serving in Roswell
5.1%
7.6%
Zip Codes with the Highest Percentage of Population Employed in Food Preparation & Serving in Roswell, NM
| Zip Code | % Employed | vs State | vs National | |
| 1. | 88203 | 7.6% | 5.8%(+1.84)#67 | 5.3%(+2.31)#5,389 |
| 2. | 88201 | 5.1% | 5.8%(-0.626)#131 | 5.3%(-0.156)#12,426 |
1
Common Questions
What are the Top Zip Codes with the Highest Percentage of Population Employed in Food Preparation & Serving in Roswell, NM?
Top Zip Codes with the Highest Percentage of Population Employed in Food Preparation & Serving in Roswell, NM are:
What zip code has the Highest Percentage of Population Employed in Food Preparation & Serving in Roswell, NM?
88203 has the Highest Percentage of Population Employed in Food Preparation & Serving in Roswell, NM with 7.6%.
What is the Percentage of Population Employed in Food Preparation & Serving in Roswell, NM?
Percentage of Population Employed in Food Preparation & Serving in Roswell is 6.9%.
What is the Percentage of Population Employed in Food Preparation & Serving in New Mexico?
Percentage of Population Employed in Food Preparation & Serving in New Mexico is 5.8%.
What is the Percentage of Population Employed in Food Preparation & Serving in the United States?
Percentage of Population Employed in Food Preparation & Serving in the United States is 5.3%.