Zip Codes with the Highest Percentage of Population Employed in Food Preparation & Serving in Santa Fe, NM
RELATED REPORTS & OPTIONS
Food Preparation & Serving
Santa Fe
Compare Zip Codes
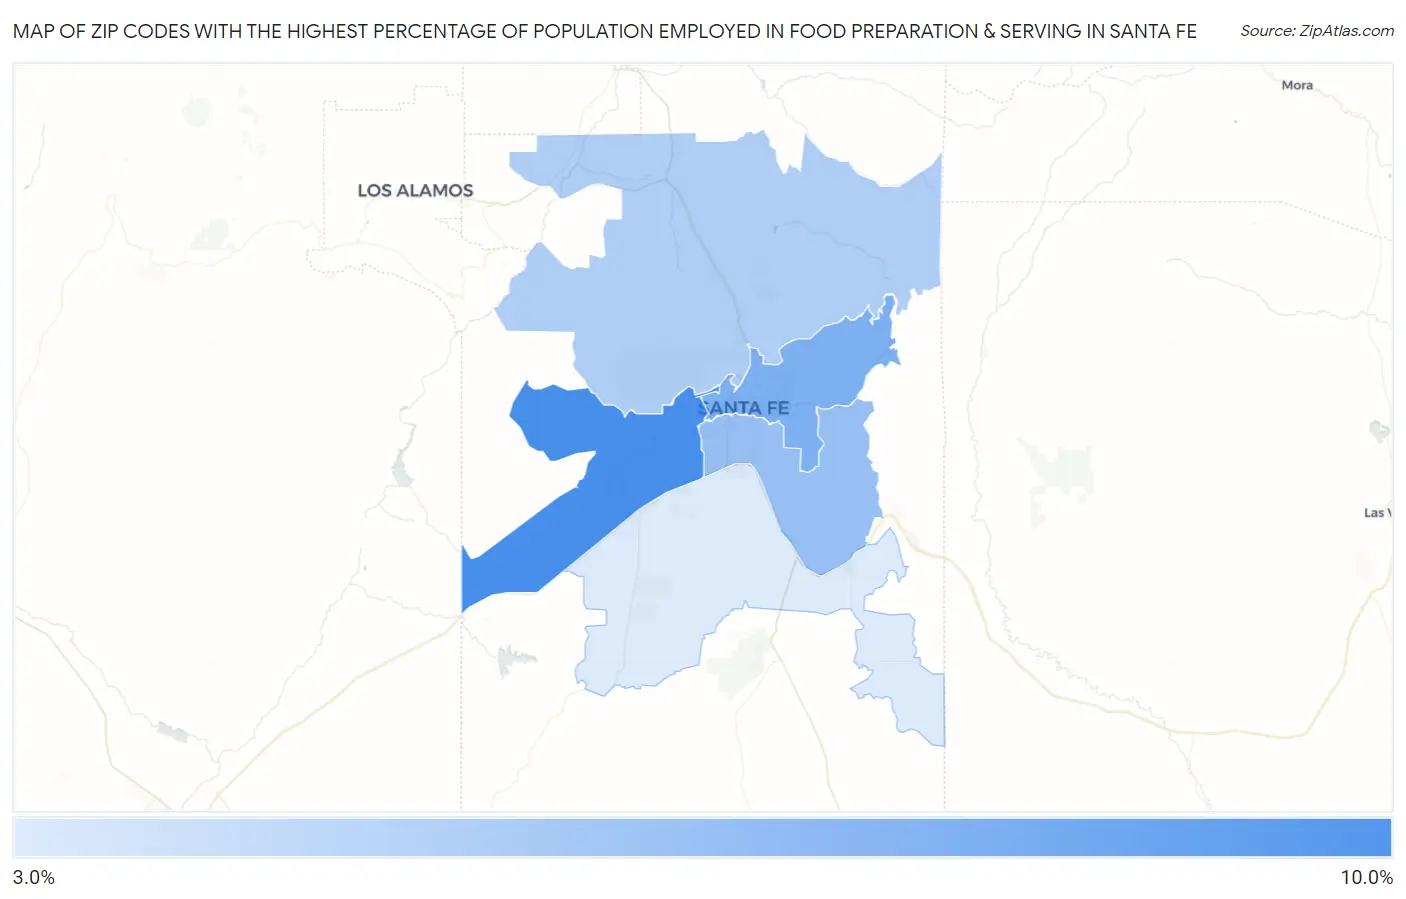
Map of Zip Codes with the Highest Percentage of Population Employed in Food Preparation & Serving in Santa Fe
3.2%
8.4%
Zip Codes with the Highest Percentage of Population Employed in Food Preparation & Serving in Santa Fe, NM
| Zip Code | % Employed | vs State | vs National | |
| 1. | 87507 | 8.4% | 5.8%(+2.66)#59 | 5.3%(+3.13)#4,151 |
| 2. | 87501 | 6.6% | 5.8%(+0.831)#92 | 5.3%(+1.30)#7,639 |
| 3. | 87505 | 5.6% | 5.8%(-0.167)#123 | 5.3%(+0.303)#10,746 |
| 4. | 87506 | 4.8% | 5.8%(-0.972)#139 | 5.3%(-0.502)#13,813 |
| 5. | 87508 | 3.2% | 5.8%(-2.53)#174 | 5.3%(-2.06)#20,406 |
1
Common Questions
What are the Top 3 Zip Codes with the Highest Percentage of Population Employed in Food Preparation & Serving in Santa Fe, NM?
Top 3 Zip Codes with the Highest Percentage of Population Employed in Food Preparation & Serving in Santa Fe, NM are:
What zip code has the Highest Percentage of Population Employed in Food Preparation & Serving in Santa Fe, NM?
87507 has the Highest Percentage of Population Employed in Food Preparation & Serving in Santa Fe, NM with 8.4%.
What is the Percentage of Population Employed in Food Preparation & Serving in Santa Fe, NM?
Percentage of Population Employed in Food Preparation & Serving in Santa Fe is 7.2%.
What is the Percentage of Population Employed in Food Preparation & Serving in New Mexico?
Percentage of Population Employed in Food Preparation & Serving in New Mexico is 5.8%.
What is the Percentage of Population Employed in Food Preparation & Serving in the United States?
Percentage of Population Employed in Food Preparation & Serving in the United States is 5.3%.