Hurley, NM Map & Demographics
Hurley Map
Hurley Overview
$20,940
PER CAPITA INCOME
$52,348
AVG FAMILY INCOME
$39,313
AVG HOUSEHOLD INCOME
41.6%
WAGE / INCOME GAP [ % ]
58.4¢/ $1
WAGE / INCOME GAP [ $ ]
0.38
INEQUALITY / GINI INDEX
1,561
TOTAL POPULATION
824
MALE POPULATION
737
FEMALE POPULATION
111.80
MALES / 100 FEMALES
89.44
FEMALES / 100 MALES
42.5
MEDIAN AGE
3.5
AVG FAMILY SIZE
2.5
AVG HOUSEHOLD SIZE
675
LABOR FORCE [ PEOPLE ]
58.2%
PERCENT IN LABOR FORCE
5.9%
UNEMPLOYMENT RATE
Hurley Zip Codes
Hurley Area Codes
Income in Hurley
Income Overview in Hurley
Per Capita Income in Hurley is $20,940, while median incomes of families and households are $52,348 and $39,313 respectively.
| Characteristic | Number | Measure |
| Per Capita Income | 1,561 | $20,940 |
| Median Family Income | 312 | $52,348 |
| Mean Family Income | 312 | $58,163 |
| Median Household Income | 631 | $39,313 |
| Mean Household Income | 631 | $47,712 |
| Income Deficit | 312 | $0 |
| Wage / Income Gap (%) | 1,561 | 41.63% |
| Wage / Income Gap ($) | 1,561 | 58.37¢ per $1 |
| Gini / Inequality Index | 1,561 | 0.38 |
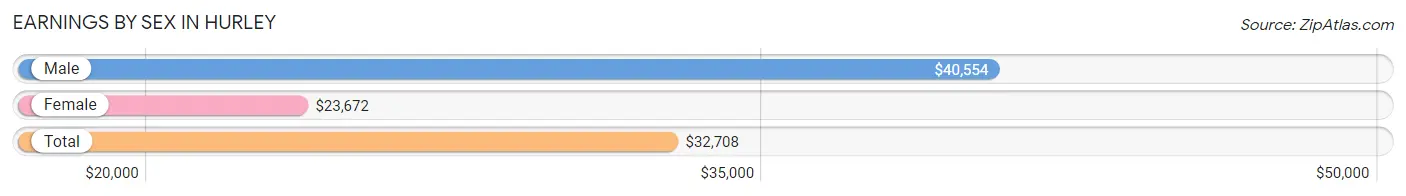
Earnings by Sex in Hurley
Average Earnings in Hurley are $32,708, $40,554 for men and $23,672 for women, a difference of 41.6%.
| Sex | Number | Average Earnings |
| Male | 333 (48.6%) | $40,554 |
| Female | 352 (51.4%) | $23,672 |
| Total | 685 (100.0%) | $32,708 |
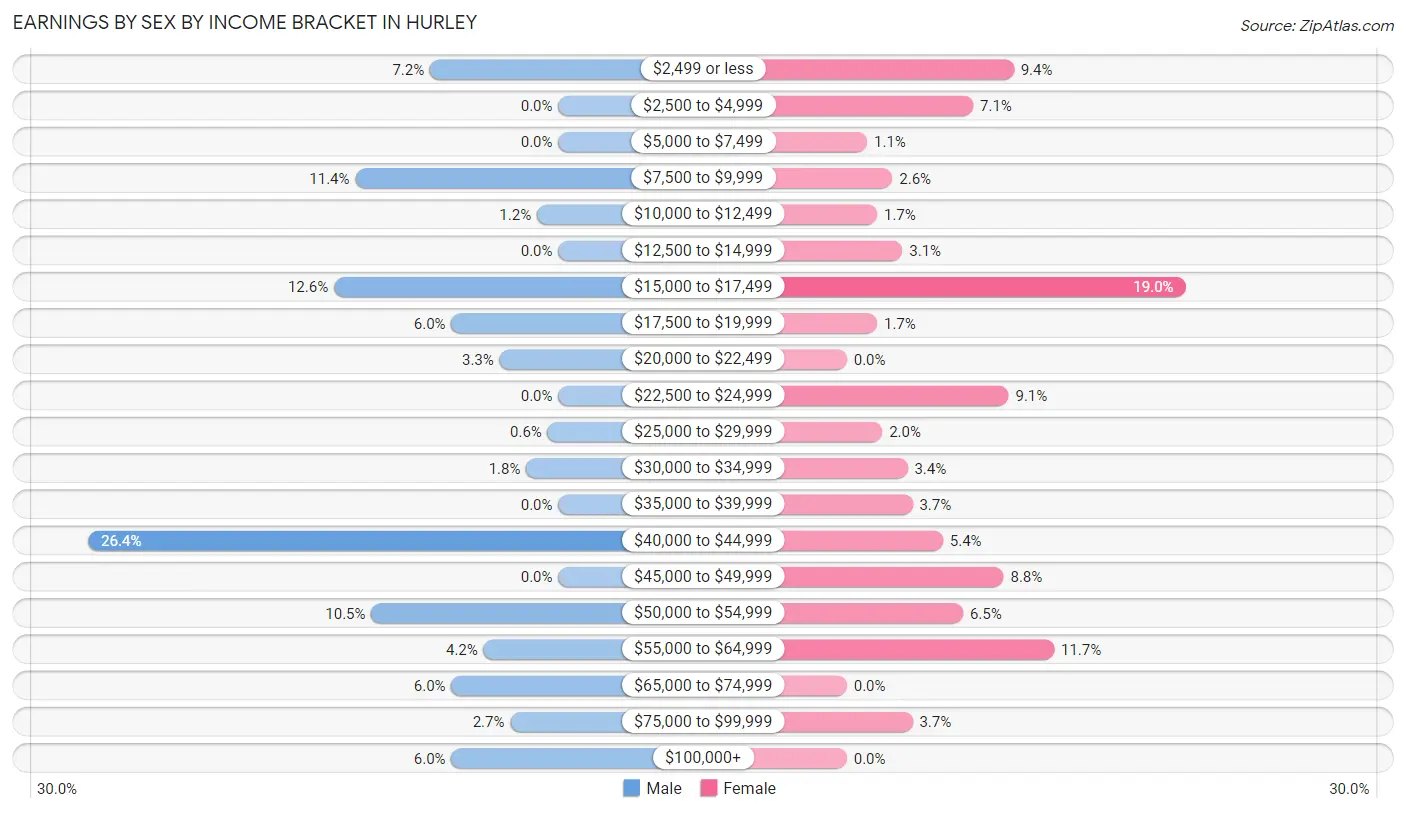
Earnings by Sex by Income Bracket in Hurley
The most common earnings brackets in Hurley are $40,000 to $44,999 for men (88 | 26.4%) and $15,000 to $17,499 for women (67 | 19.0%).
| Income | Male | Female |
| $2,499 or less | 24 (7.2%) | 33 (9.4%) |
| $2,500 to $4,999 | 0 (0.0%) | 25 (7.1%) |
| $5,000 to $7,499 | 0 (0.0%) | 4 (1.1%) |
| $7,500 to $9,999 | 38 (11.4%) | 9 (2.6%) |
| $10,000 to $12,499 | 4 (1.2%) | 6 (1.7%) |
| $12,500 to $14,999 | 0 (0.0%) | 11 (3.1%) |
| $15,000 to $17,499 | 42 (12.6%) | 67 (19.0%) |
| $17,500 to $19,999 | 20 (6.0%) | 6 (1.7%) |
| $20,000 to $22,499 | 11 (3.3%) | 0 (0.0%) |
| $22,500 to $24,999 | 0 (0.0%) | 32 (9.1%) |
| $25,000 to $29,999 | 2 (0.6%) | 7 (2.0%) |
| $30,000 to $34,999 | 6 (1.8%) | 12 (3.4%) |
| $35,000 to $39,999 | 0 (0.0%) | 13 (3.7%) |
| $40,000 to $44,999 | 88 (26.4%) | 19 (5.4%) |
| $45,000 to $49,999 | 0 (0.0%) | 31 (8.8%) |
| $50,000 to $54,999 | 35 (10.5%) | 23 (6.5%) |
| $55,000 to $64,999 | 14 (4.2%) | 41 (11.7%) |
| $65,000 to $74,999 | 20 (6.0%) | 0 (0.0%) |
| $75,000 to $99,999 | 9 (2.7%) | 13 (3.7%) |
| $100,000+ | 20 (6.0%) | 0 (0.0%) |
| Total | 333 (100.0%) | 352 (100.0%) |
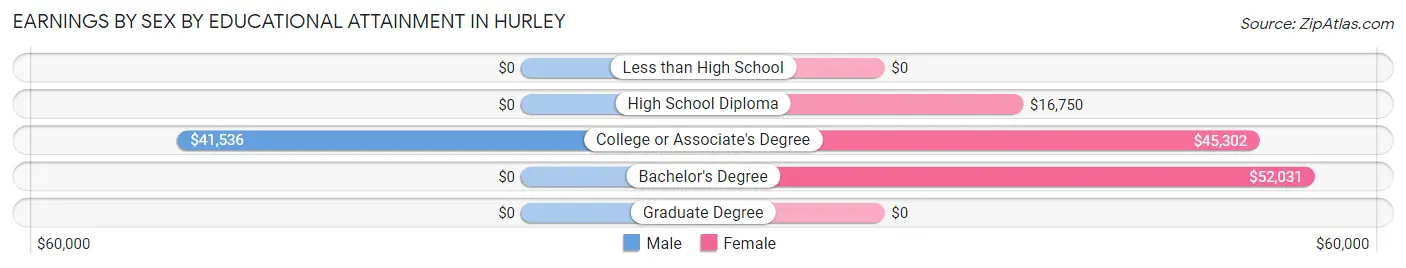
Earnings by Sex by Educational Attainment in Hurley
Average earnings in Hurley are $41,804 for men and $36,346 for women, a difference of 13.1%. Men with an educational attainment of college or associate's degree enjoy the highest average annual earnings of $41,536, while those with college or associate's degree education earn the least with $41,536. Women with an educational attainment of bachelor's degree earn the most with the average annual earnings of $52,031, while those with high school diploma education have the smallest earnings of $16,750.
| Educational Attainment | Male Income | Female Income |
| Less than High School | - | - |
| High School Diploma | - | - |
| College or Associate's Degree | $41,536 | $45,302 |
| Bachelor's Degree | - | - |
| Graduate Degree | - | - |
| Total | $41,804 | $36,346 |
Family Income in Hurley
Family Income Brackets in Hurley
According to the Hurley family income data, there are 88 families falling into the $75,000 to $99,999 income range, which is the most common income bracket and makes up 28.2% of all families.
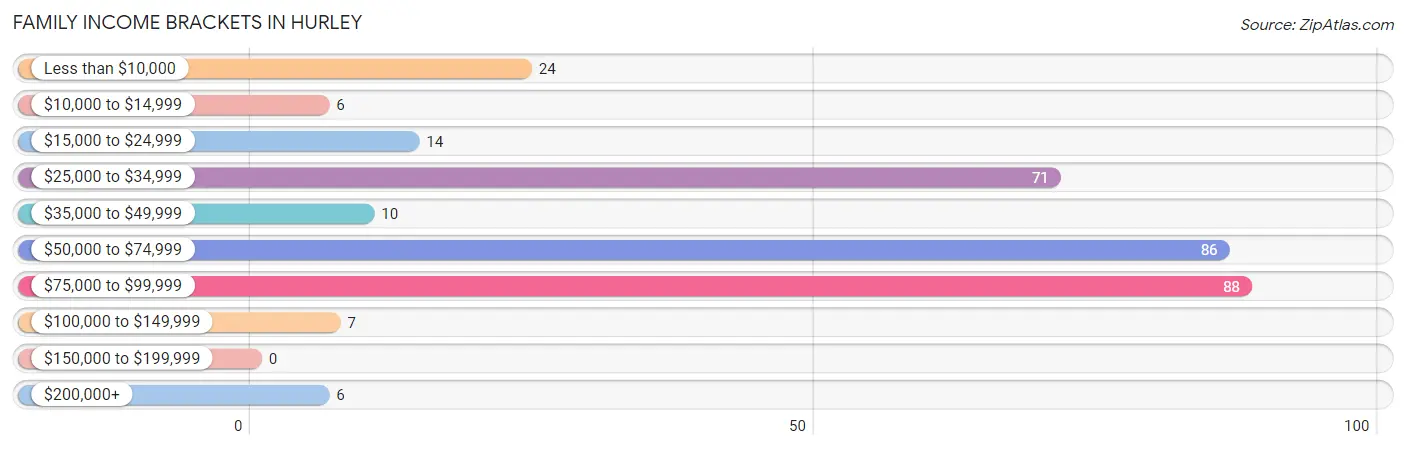
| Income Bracket | # Families | % Families |
| Less than $10,000 | 24 | 7.7% |
| $10,000 to $14,999 | 6 | 1.9% |
| $15,000 to $24,999 | 14 | 4.5% |
| $25,000 to $34,999 | 71 | 22.8% |
| $35,000 to $49,999 | 10 | 3.2% |
| $50,000 to $74,999 | 86 | 27.6% |
| $75,000 to $99,999 | 88 | 28.2% |
| $100,000 to $149,999 | 7 | 2.2% |
| $150,000 to $199,999 | 0 | 0.0% |
| $200,000+ | 6 | 1.9% |
Family Income by Famaliy Size in Hurley
3-person families (38 | 12.2%) account for the highest median family income in Hurley with $51,875 per family, while 2-person families (193 | 61.9%) have the highest median income of $19,792 per family member.
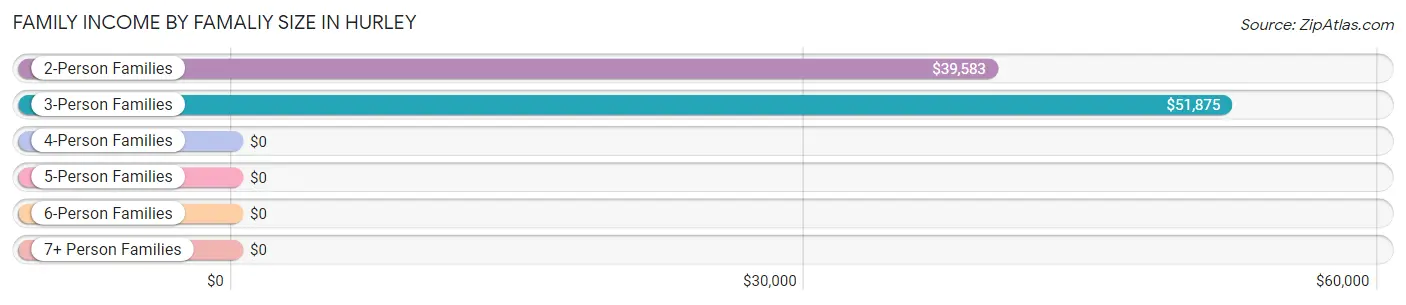
| Income Bracket | # Families | Median Income |
| 2-Person Families | 193 (61.9%) | $39,583 |
| 3-Person Families | 38 (12.2%) | $51,875 |
| 4-Person Families | 24 (7.7%) | $0 |
| 5-Person Families | 34 (10.9%) | $0 |
| 6-Person Families | 5 (1.6%) | $0 |
| 7+ Person Families | 18 (5.8%) | $0 |
| Total | 312 (100.0%) | $52,348 |
Family Income by Number of Earners in Hurley
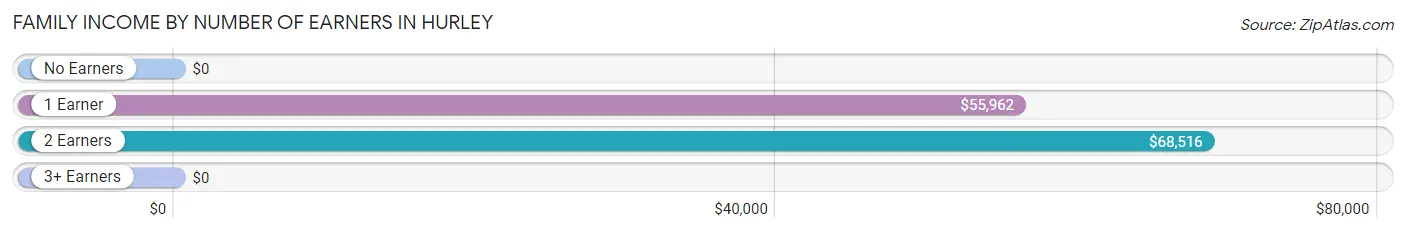
| Number of Earners | # Families | Median Income |
| No Earners | 78 (25.0%) | $0 |
| 1 Earner | 88 (28.2%) | $55,962 |
| 2 Earners | 117 (37.5%) | $68,516 |
| 3+ Earners | 29 (9.3%) | $0 |
| Total | 312 (100.0%) | $52,348 |
Household Income in Hurley
Household Income Brackets in Hurley
With 143 households falling in the category, the $50,000 to $74,999 income range is the most frequent in Hurley, accounting for 22.7% of all households.
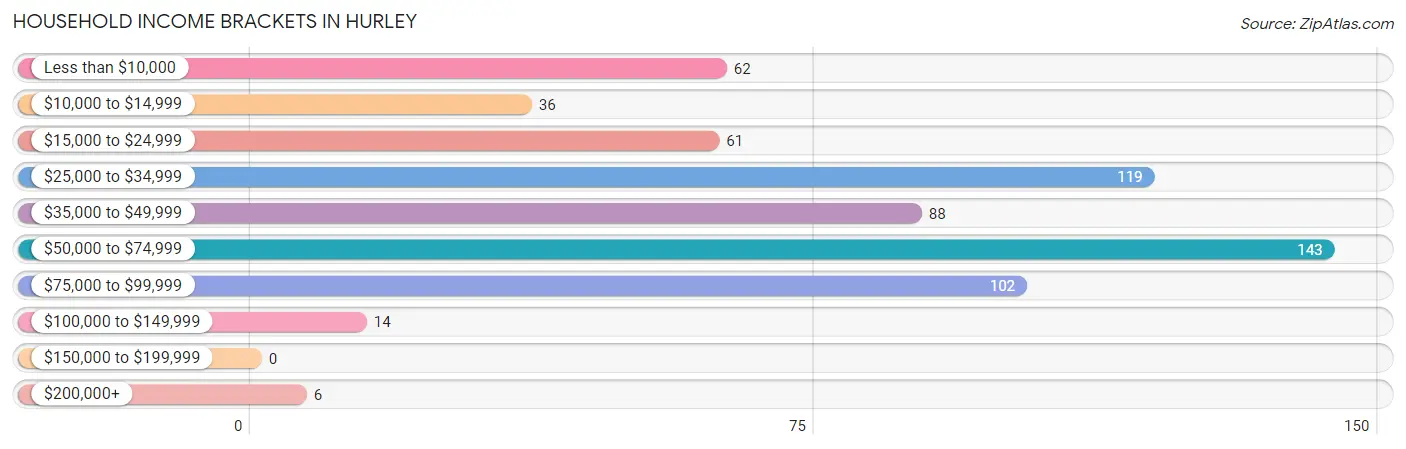
| Income Bracket | # Households | % Households |
| Less than $10,000 | 62 | 9.8% |
| $10,000 to $14,999 | 36 | 5.7% |
| $15,000 to $24,999 | 61 | 9.7% |
| $25,000 to $34,999 | 119 | 18.9% |
| $35,000 to $49,999 | 88 | 13.9% |
| $50,000 to $74,999 | 143 | 22.7% |
| $75,000 to $99,999 | 102 | 16.2% |
| $100,000 to $149,999 | 14 | 2.2% |
| $150,000 to $199,999 | 0 | 0.0% |
| $200,000+ | 6 | 1.0% |
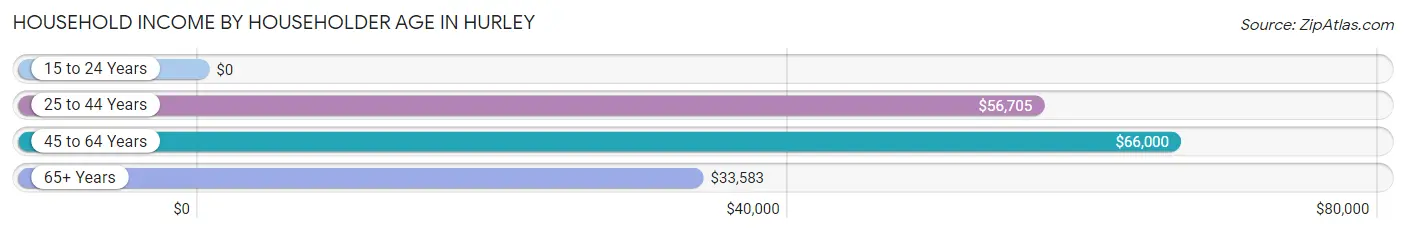
Household Income by Householder Age in Hurley
The median household income in Hurley is $39,313, with the highest median household income of $66,000 found in the 45 to 64 years age bracket for the primary householder. A total of 254 households (40.3%) fall into this category. Meanwhile, the 15 to 24 years age bracket for the primary householder has the lowest median household income of $0, with 51 households (8.1%) in this group.
| Income Bracket | # Households | Median Income |
| 15 to 24 Years | 51 (8.1%) | $0 |
| 25 to 44 Years | 105 (16.6%) | $56,705 |
| 45 to 64 Years | 254 (40.3%) | $66,000 |
| 65+ Years | 221 (35.0%) | $33,583 |
| Total | 631 (100.0%) | $39,313 |
Poverty in Hurley
Income Below Poverty by Sex and Age in Hurley
With 22.1% poverty level for males and 23.0% for females among the residents of Hurley, 25 to 34 year old males and 25 to 34 year old females are the most vulnerable to poverty, with 9 males (60.0%) and 6 females (54.5%) in their respective age groups living below the poverty level.
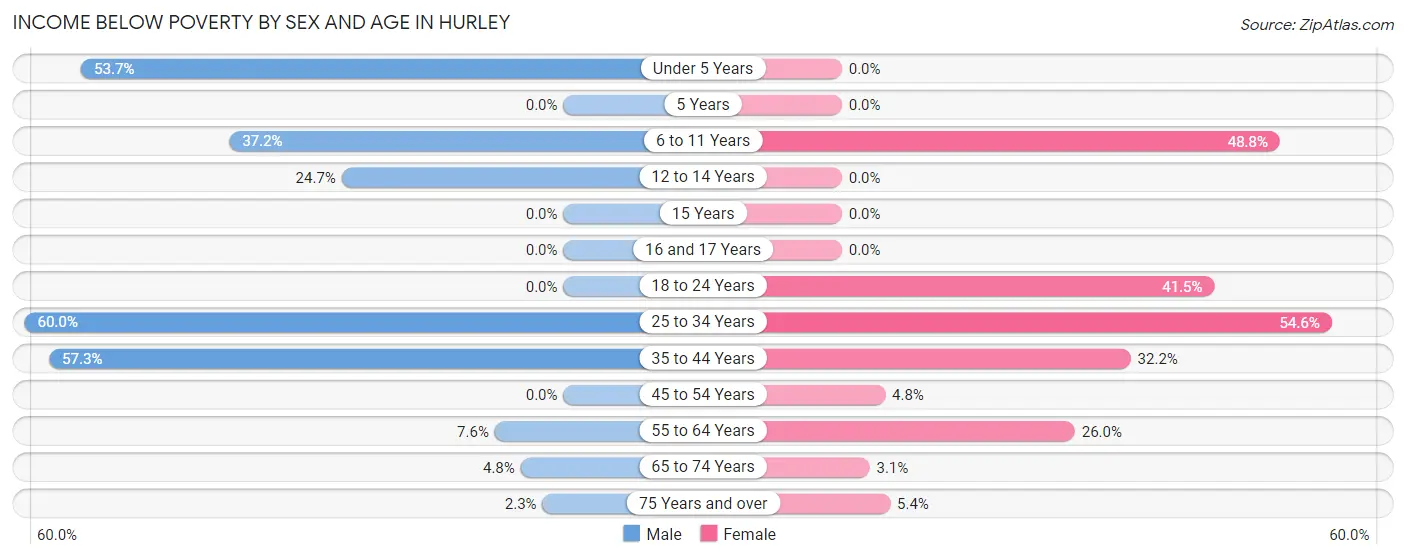
| Age Bracket | Male | Female |
| Under 5 Years | 29 (53.7%) | 0 (0.0%) |
| 5 Years | 0 (0.0%) | 0 (0.0%) |
| 6 to 11 Years | 32 (37.2%) | 40 (48.8%) |
| 12 to 14 Years | 20 (24.7%) | 0 (0.0%) |
| 15 Years | 0 (0.0%) | 0 (0.0%) |
| 16 and 17 Years | 0 (0.0%) | 0 (0.0%) |
| 18 to 24 Years | 0 (0.0%) | 39 (41.5%) |
| 25 to 34 Years | 9 (60.0%) | 6 (54.5%) |
| 35 to 44 Years | 67 (57.3%) | 37 (32.2%) |
| 45 to 54 Years | 0 (0.0%) | 4 (4.8%) |
| 55 to 64 Years | 11 (7.6%) | 34 (26.0%) |
| 65 to 74 Years | 4 (4.8%) | 3 (3.1%) |
| 75 Years and over | 1 (2.3%) | 5 (5.4%) |
| Total | 173 (22.1%) | 168 (23.0%) |
Income Above Poverty by Sex and Age in Hurley
According to the poverty statistics in Hurley, males aged 5 years and females aged under 5 years are the age groups that are most secure financially, with 100.0% of males and 100.0% of females in these age groups living above the poverty line.
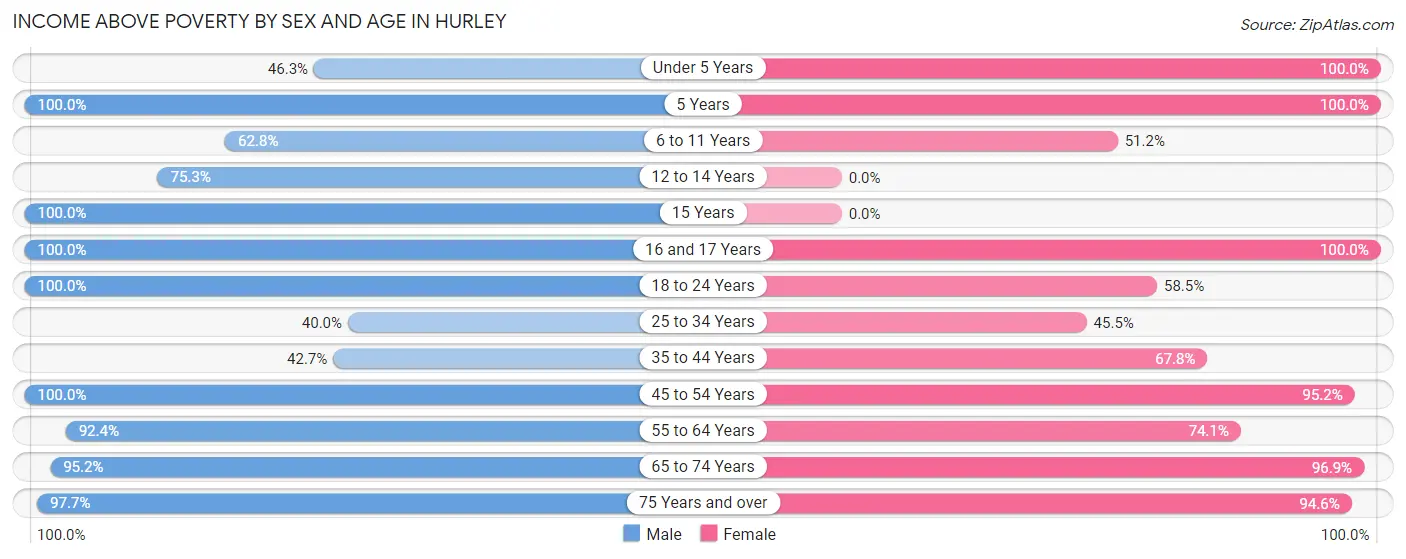
| Age Bracket | Male | Female |
| Under 5 Years | 25 (46.3%) | 10 (100.0%) |
| 5 Years | 13 (100.0%) | 6 (100.0%) |
| 6 to 11 Years | 54 (62.8%) | 42 (51.2%) |
| 12 to 14 Years | 61 (75.3%) | 0 (0.0%) |
| 15 Years | 22 (100.0%) | 0 (0.0%) |
| 16 and 17 Years | 25 (100.0%) | 9 (100.0%) |
| 18 to 24 Years | 74 (100.0%) | 55 (58.5%) |
| 25 to 34 Years | 6 (40.0%) | 5 (45.5%) |
| 35 to 44 Years | 50 (42.7%) | 78 (67.8%) |
| 45 to 54 Years | 25 (100.0%) | 79 (95.2%) |
| 55 to 64 Years | 133 (92.4%) | 97 (74.1%) |
| 65 to 74 Years | 80 (95.2%) | 94 (96.9%) |
| 75 Years and over | 42 (97.7%) | 88 (94.6%) |
| Total | 610 (77.9%) | 563 (77.0%) |
Income Below Poverty Among Married-Couple Families in Hurley
The poverty statistics for married-couple families in Hurley show that 4.4% or 8 of the total 180 families live below the poverty line. Families with no children have the highest poverty rate of 6.2%, comprising of 8 families. On the other hand, families with 1 or 2 children have the lowest poverty rate of 0.0%, which includes 0 families.
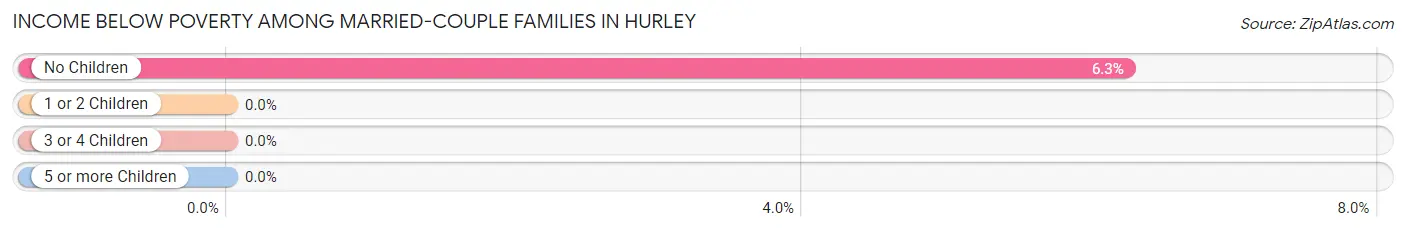
| Children | Above Poverty | Below Poverty |
| No Children | 120 (93.8%) | 8 (6.2%) |
| 1 or 2 Children | 8 (100.0%) | 0 (0.0%) |
| 3 or 4 Children | 39 (100.0%) | 0 (0.0%) |
| 5 or more Children | 5 (100.0%) | 0 (0.0%) |
| Total | 172 (95.6%) | 8 (4.4%) |
Income Below Poverty Among Single-Parent Households in Hurley
According to the poverty data in Hurley, 44.8% or 13 single-father households and 22.3% or 23 single-mother households are living below the poverty line. Among single-father households, those with 5 or more children have the highest poverty rate, with 13 households (100.0%) experiencing poverty. Likewise, among single-mother households, those with 1 or 2 children have the highest poverty rate, with 23 households (44.2%) falling below the poverty line.
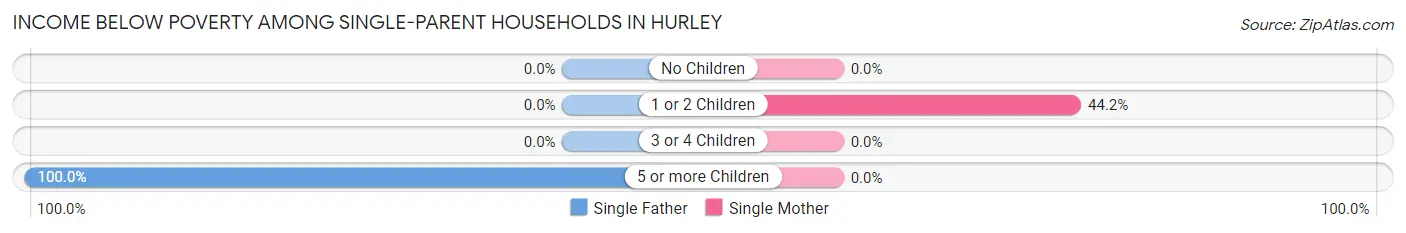
| Children | Single Father | Single Mother |
| No Children | 0 (0.0%) | 0 (0.0%) |
| 1 or 2 Children | 0 (0.0%) | 23 (44.2%) |
| 3 or 4 Children | 0 (0.0%) | 0 (0.0%) |
| 5 or more Children | 13 (100.0%) | 0 (0.0%) |
| Total | 13 (44.8%) | 23 (22.3%) |
Income Below Poverty Among Married-Couple vs Single-Parent Households in Hurley
The poverty data for Hurley shows that 8 of the married-couple family households (4.4%) and 36 of the single-parent households (27.3%) are living below the poverty level. Within the married-couple family households, those with no children have the highest poverty rate, with 8 households (6.2%) falling below the poverty line. Among the single-parent households, those with 5 or more children have the highest poverty rate, with 13 household (100.0%) living below poverty.
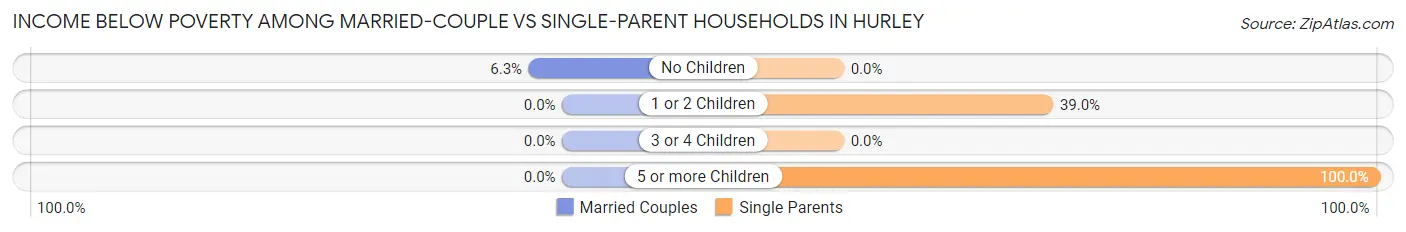
| Children | Married-Couple Families | Single-Parent Households |
| No Children | 8 (6.2%) | 0 (0.0%) |
| 1 or 2 Children | 0 (0.0%) | 23 (39.0%) |
| 3 or 4 Children | 0 (0.0%) | 0 (0.0%) |
| 5 or more Children | 0 (0.0%) | 13 (100.0%) |
| Total | 8 (4.4%) | 36 (27.3%) |
Race in Hurley
The most populous races in Hurley are Hispanic or Latino (1,176 | 75.3%), White / Caucasian (822 | 52.7%), and Two or more Races (634 | 40.6%).
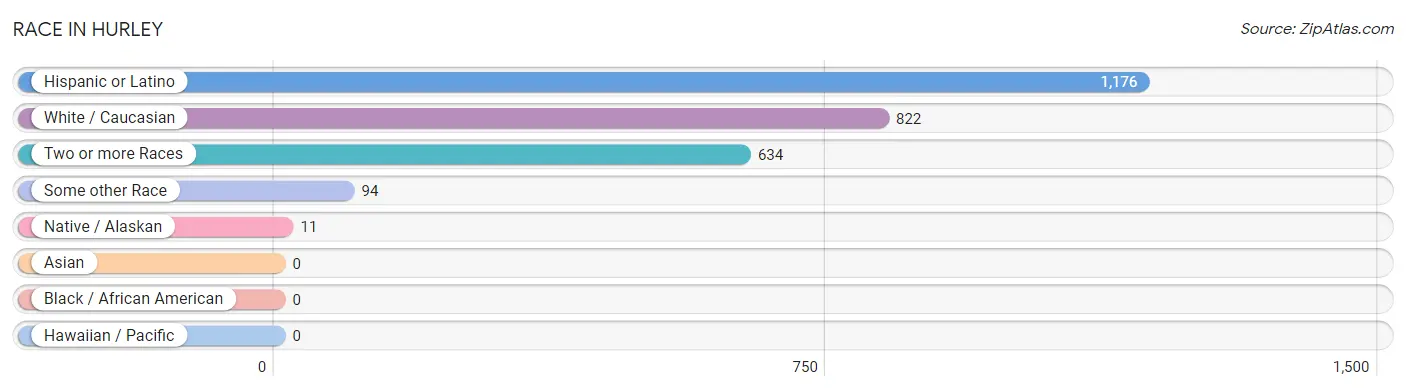
| Race | # Population | % Population |
| Asian | 0 | 0.0% |
| Black / African American | 0 | 0.0% |
| Hawaiian / Pacific | 0 | 0.0% |
| Hispanic or Latino | 1,176 | 75.3% |
| Native / Alaskan | 11 | 0.7% |
| White / Caucasian | 822 | 52.7% |
| Two or more Races | 634 | 40.6% |
| Some other Race | 94 | 6.0% |
| Total | 1,561 | 100.0% |
Ancestry in Hurley
The most populous ancestries reported in Hurley are Mexican (1,082 | 69.3%), German (161 | 10.3%), Irish (70 | 4.5%), French (40 | 2.6%), and Blackfeet (34 | 2.2%), together accounting for 88.8% of all Hurley residents.
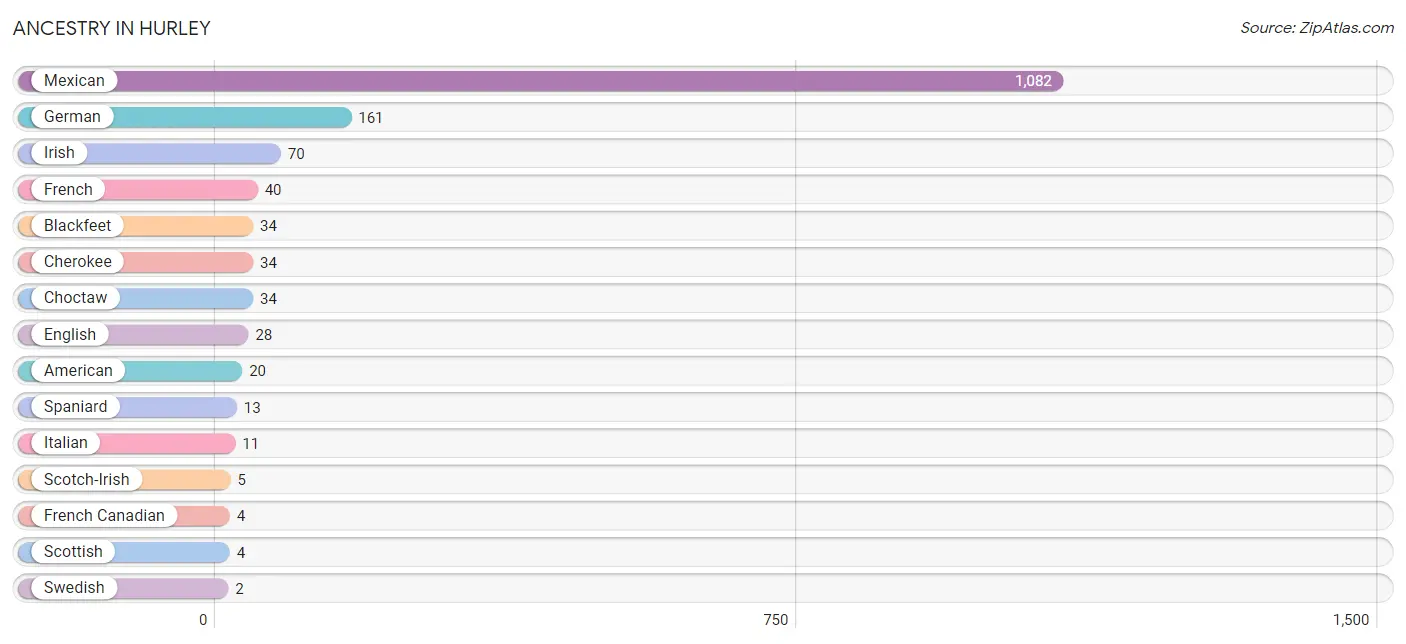
| Ancestry | # Population | % Population |
| American | 20 | 1.3% |
| Blackfeet | 34 | 2.2% |
| Cherokee | 34 | 2.2% |
| Choctaw | 34 | 2.2% |
| English | 28 | 1.8% |
| French | 40 | 2.6% |
| French Canadian | 4 | 0.3% |
| German | 161 | 10.3% |
| Irish | 70 | 4.5% |
| Italian | 11 | 0.7% |
| Mexican | 1,082 | 69.3% |
| Scotch-Irish | 5 | 0.3% |
| Scottish | 4 | 0.3% |
| Spaniard | 13 | 0.8% |
| Swedish | 2 | 0.1% | View All 15 Rows |
Immigrants in Hurley
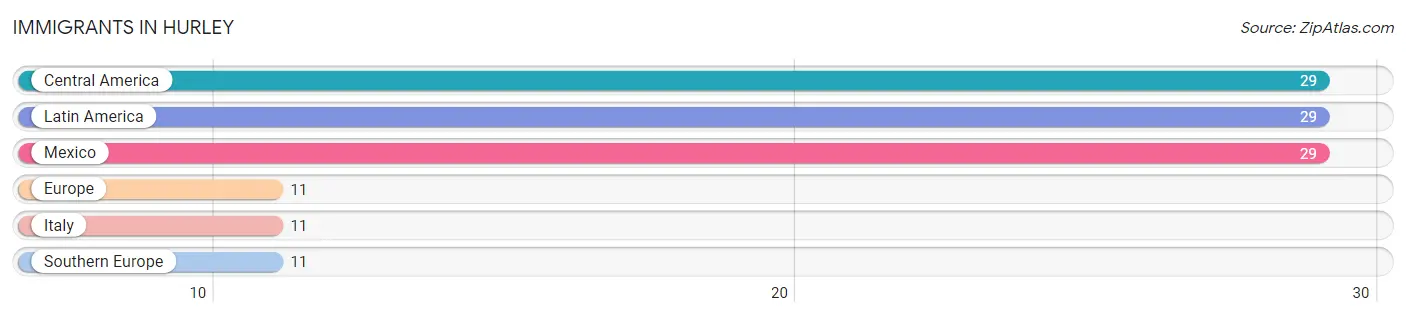
The most numerous immigrant groups reported in Hurley came from Central America (29 | 1.9%), Latin America (29 | 1.9%), Mexico (29 | 1.9%), Europe (11 | 0.7%), and Italy (11 | 0.7%), together accounting for 7.0% of all Hurley residents.
| Immigration Origin | # Population | % Population |
| Central America | 29 | 1.9% |
| Europe | 11 | 0.7% |
| Italy | 11 | 0.7% |
| Latin America | 29 | 1.9% |
| Mexico | 29 | 1.9% |
| Southern Europe | 11 | 0.7% | View All 6 Rows |
Sex and Age in Hurley
Sex and Age in Hurley
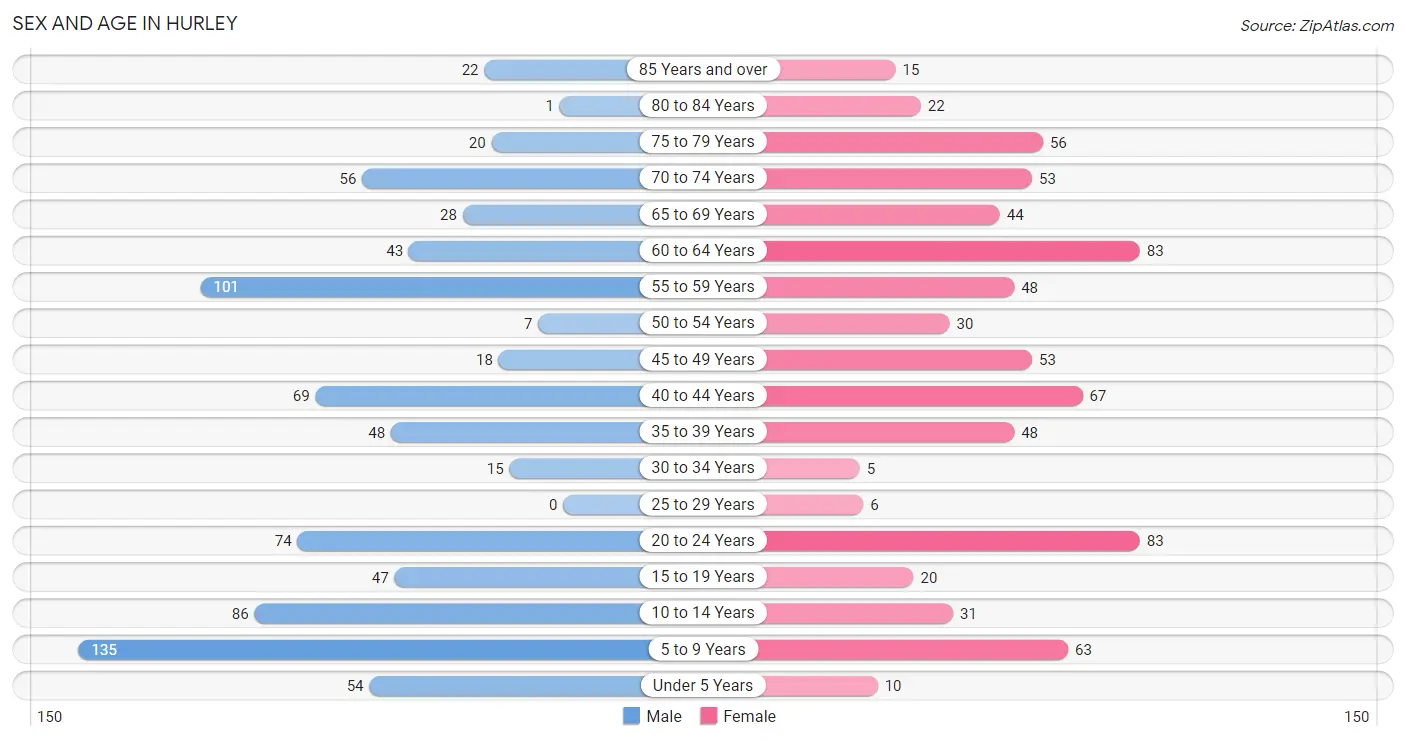
The most populous age groups in Hurley are 5 to 9 Years (135 | 16.4%) for men and 20 to 24 Years (83 | 11.3%) for women.
| Age Bracket | Male | Female |
| Under 5 Years | 54 (6.6%) | 10 (1.4%) |
| 5 to 9 Years | 135 (16.4%) | 63 (8.6%) |
| 10 to 14 Years | 86 (10.4%) | 31 (4.2%) |
| 15 to 19 Years | 47 (5.7%) | 20 (2.7%) |
| 20 to 24 Years | 74 (9.0%) | 83 (11.3%) |
| 25 to 29 Years | 0 (0.0%) | 6 (0.8%) |
| 30 to 34 Years | 15 (1.8%) | 5 (0.7%) |
| 35 to 39 Years | 48 (5.8%) | 48 (6.5%) |
| 40 to 44 Years | 69 (8.4%) | 67 (9.1%) |
| 45 to 49 Years | 18 (2.2%) | 53 (7.2%) |
| 50 to 54 Years | 7 (0.9%) | 30 (4.1%) |
| 55 to 59 Years | 101 (12.3%) | 48 (6.5%) |
| 60 to 64 Years | 43 (5.2%) | 83 (11.3%) |
| 65 to 69 Years | 28 (3.4%) | 44 (6.0%) |
| 70 to 74 Years | 56 (6.8%) | 53 (7.2%) |
| 75 to 79 Years | 20 (2.4%) | 56 (7.6%) |
| 80 to 84 Years | 1 (0.1%) | 22 (3.0%) |
| 85 Years and over | 22 (2.7%) | 15 (2.0%) |
| Total | 824 (100.0%) | 737 (100.0%) |
Families and Households in Hurley
Median Family Size in Hurley
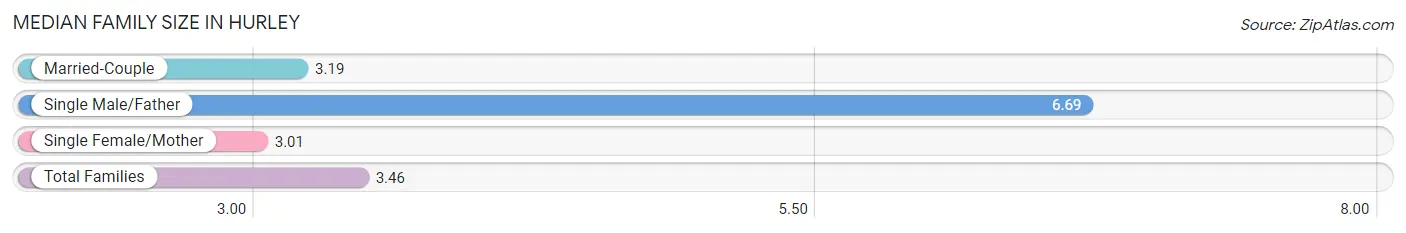
The median family size in Hurley is 3.46 persons per family, with single male/father families (29 | 9.3%) accounting for the largest median family size of 6.69 persons per family. On the other hand, single female/mother families (103 | 33.0%) represent the smallest median family size with 3.01 persons per family.
| Family Type | # Families | Family Size |
| Married-Couple | 180 (57.7%) | 3.19 |
| Single Male/Father | 29 (9.3%) | 6.69 |
| Single Female/Mother | 103 (33.0%) | 3.01 |
| Total Families | 312 (100.0%) | 3.46 |
Median Household Size in Hurley
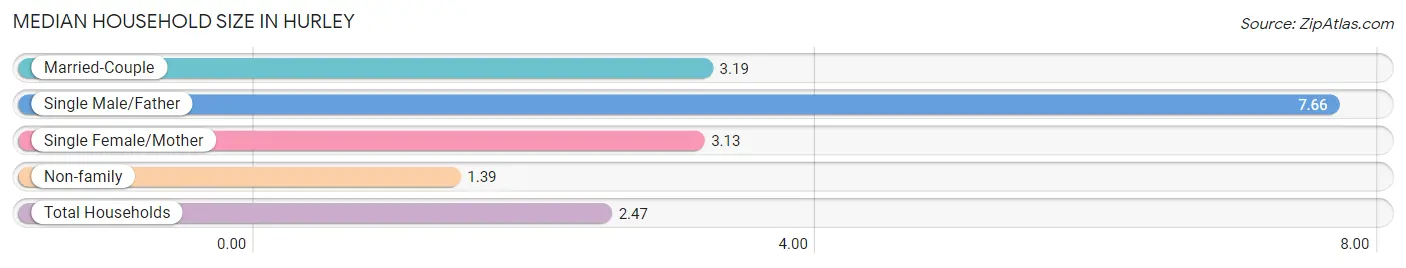
The median household size in Hurley is 2.47 persons per household, with single male/father households (29 | 4.6%) accounting for the largest median household size of 7.66 persons per household. non-family households (319 | 50.5%) represent the smallest median household size with 1.39 persons per household.
| Household Type | # Households | Household Size |
| Married-Couple | 180 (28.5%) | 3.19 |
| Single Male/Father | 29 (4.6%) | 7.66 |
| Single Female/Mother | 103 (16.3%) | 3.13 |
| Non-family | 319 (50.5%) | 1.39 |
| Total Households | 631 (100.0%) | 2.47 |
Household Size by Marriage Status in Hurley
Out of a total of 631 households in Hurley, 312 (49.4%) are family households, while 319 (50.5%) are nonfamily households. The most numerous type of family households are 2-person households, comprising 191, and the most common type of nonfamily households are 1-person households, comprising 246.
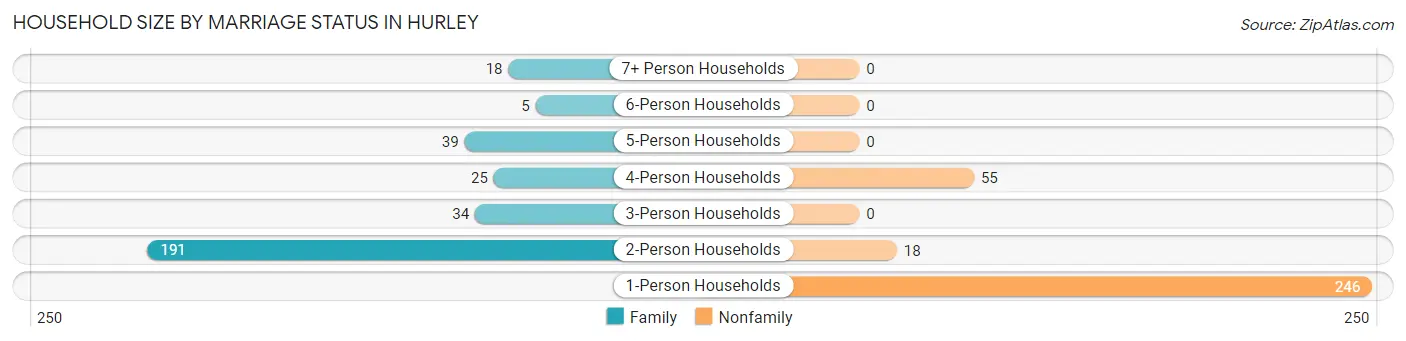
| Household Size | Family Households | Nonfamily Households |
| 1-Person Households | - | 246 (39.0%) |
| 2-Person Households | 191 (30.3%) | 18 (2.9%) |
| 3-Person Households | 34 (5.4%) | 0 (0.0%) |
| 4-Person Households | 25 (4.0%) | 55 (8.7%) |
| 5-Person Households | 39 (6.2%) | 0 (0.0%) |
| 6-Person Households | 5 (0.8%) | 0 (0.0%) |
| 7+ Person Households | 18 (2.9%) | 0 (0.0%) |
| Total | 312 (49.4%) | 319 (50.5%) |
Female Fertility in Hurley
Fertility by Age in Hurley
Average fertility rate in Hurley is 39.0 births per 1,000 women. Women in the age bracket of 20 to 34 years have the highest fertility rate with 64.0 births per 1,000 women. Women in the age bracket of 20 to 34 years acount for 54.5% of all women with births.
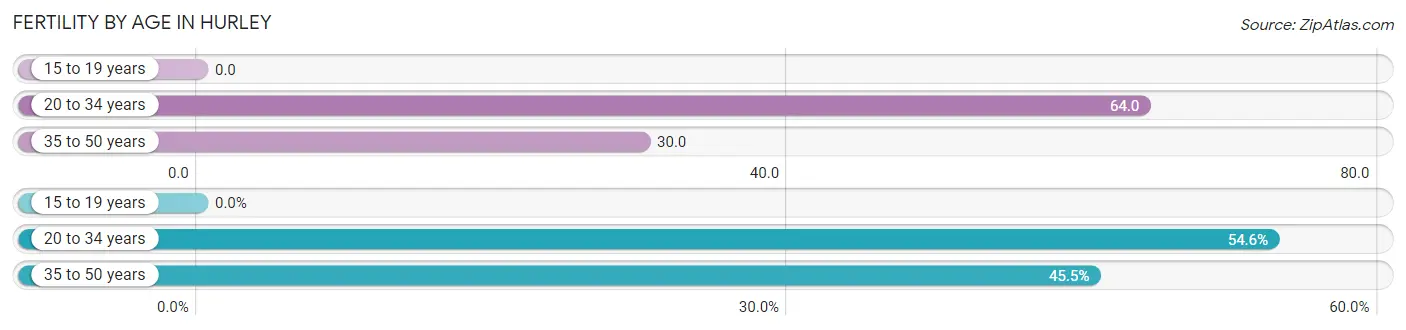
| Age Bracket | Women with Births | Births / 1,000 Women |
| 15 to 19 years | 0 (0.0%) | 0.0 |
| 20 to 34 years | 6 (54.5%) | 64.0 |
| 35 to 50 years | 5 (45.5%) | 30.0 |
| Total | 11 (100.0%) | 39.0 |
Fertility by Age by Marriage Status in Hurley
45.5% of women with births (11) in Hurley are married. The highest percentage of unmarried women with births falls into 20 to 34 years age bracket with 100.0% of them unmarried at the time of birth, while the lowest percentage of unmarried women with births belong to 35 to 50 years age bracket with 0.0% of them unmarried.
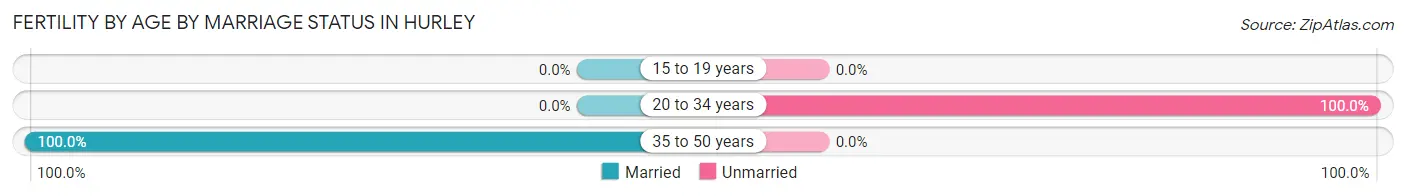
| Age Bracket | Married | Unmarried |
| 15 to 19 years | 0 (0.0%) | 0 (0.0%) |
| 20 to 34 years | 0 (0.0%) | 6 (100.0%) |
| 35 to 50 years | 5 (100.0%) | 0 (0.0%) |
| Total | 5 (45.5%) | 6 (54.5%) |
Fertility by Education in Hurley
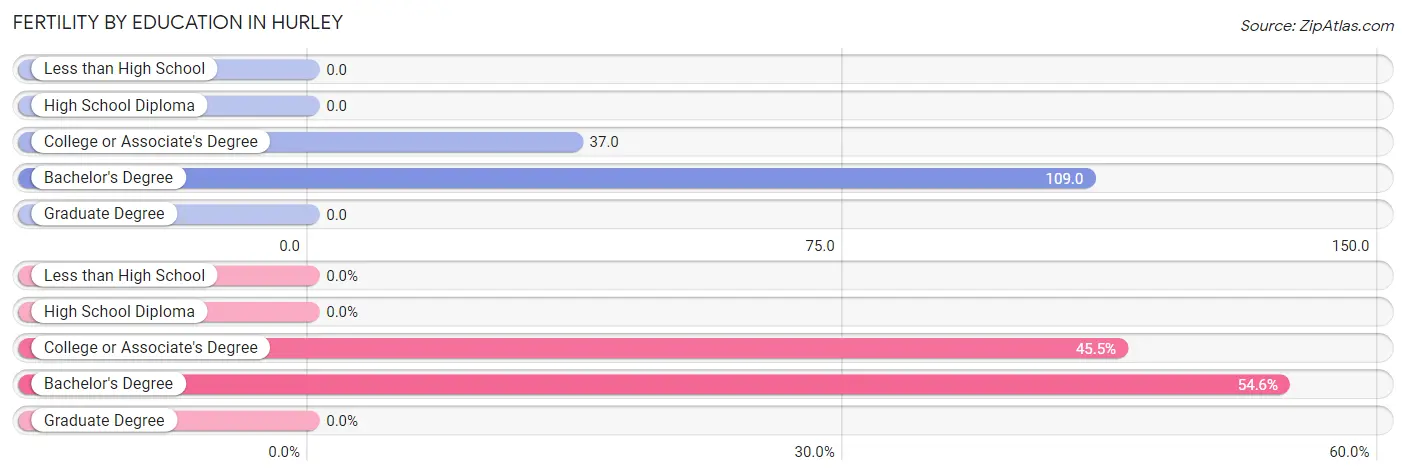
| Educational Attainment | Women with Births | Births / 1,000 Women |
| Less than High School | 0 (0.0%) | 0.0 |
| High School Diploma | 0 (0.0%) | 0.0 |
| College or Associate's Degree | 5 (45.5%) | 37.0 |
| Bachelor's Degree | 6 (54.5%) | 109.0 |
| Graduate Degree | 0 (0.0%) | 0.0 |
| Total | 11 (100.0%) | 39.0 |
Fertility by Education by Marriage Status in Hurley
54.5% of women with births in Hurley are unmarried. Women with the educational attainment of college or associate's degree are most likely to be married with 100.0% of them married at childbirth, while women with the educational attainment of bachelor's degree are least likely to be married with 100.0% of them unmarried at childbirth.
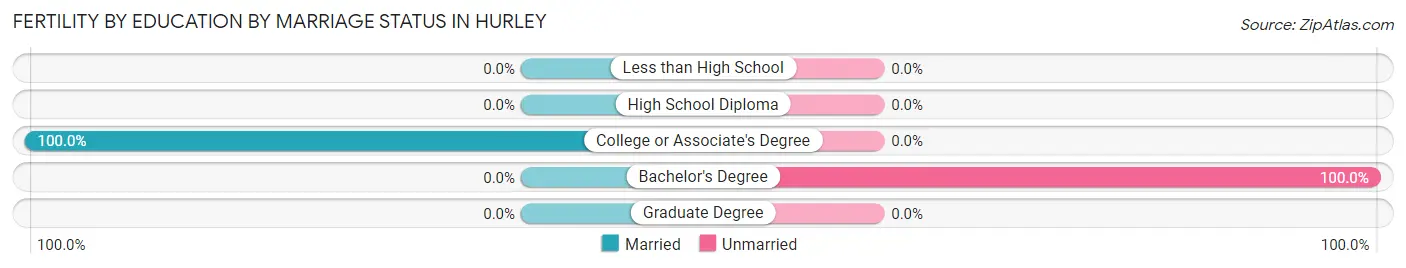
| Educational Attainment | Married | Unmarried |
| Less than High School | 0 (0.0%) | 0 (0.0%) |
| High School Diploma | 0 (0.0%) | 0 (0.0%) |
| College or Associate's Degree | 5 (100.0%) | 0 (0.0%) |
| Bachelor's Degree | 0 (0.0%) | 6 (100.0%) |
| Graduate Degree | 0 (0.0%) | 0 (0.0%) |
| Total | 5 (45.5%) | 6 (54.5%) |
Employment Characteristics in Hurley
Employment by Class of Employer in Hurley
Among the 635 employed individuals in Hurley, private company employees (302 | 47.6%), state government employees (203 | 32.0%), and local government employees (70 | 11.0%) make up the most common classes of employment.
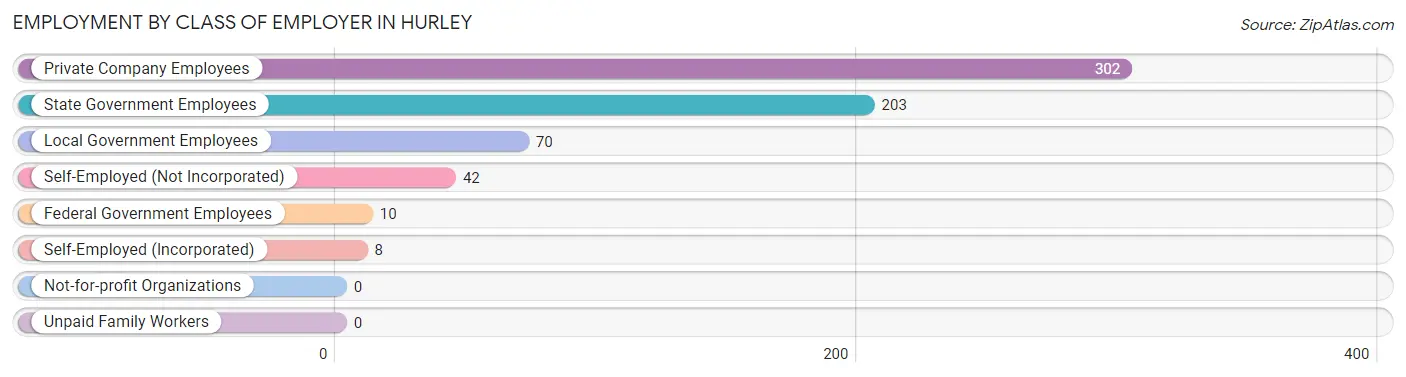
| Employer Class | # Employees | % Employees |
| Private Company Employees | 302 | 47.6% |
| Self-Employed (Incorporated) | 8 | 1.3% |
| Self-Employed (Not Incorporated) | 42 | 6.6% |
| Not-for-profit Organizations | 0 | 0.0% |
| Local Government Employees | 70 | 11.0% |
| State Government Employees | 203 | 32.0% |
| Federal Government Employees | 10 | 1.6% |
| Unpaid Family Workers | 0 | 0.0% |
| Total | 635 | 100.0% |
Employment Status by Age in Hurley
According to the labor force statistics for Hurley, out of the total population over 16 years of age (1,160), 58.2% or 675 individuals are in the labor force, with 5.9% or 40 of them unemployed. The age group with the highest labor force participation rate is 25 to 29 years, with 100.0% or 6 individuals in the labor force. Within the labor force, the 30 to 34 years age range has the highest percentage of unemployed individuals, with 45.0% or 9 of them being unemployed.
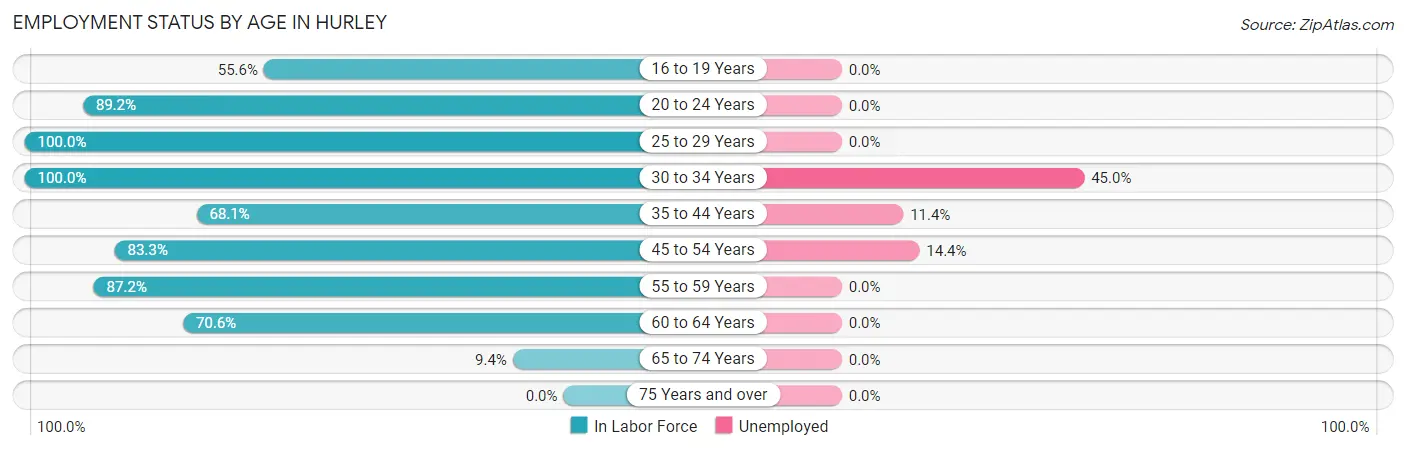
| Age Bracket | In Labor Force | Unemployed |
| 16 to 19 Years | 25 (55.6%) | 0 (0.0%) |
| 20 to 24 Years | 140 (89.2%) | 0 (0.0%) |
| 25 to 29 Years | 6 (100.0%) | 0 (0.0%) |
| 30 to 34 Years | 20 (100.0%) | 9 (45.0%) |
| 35 to 44 Years | 158 (68.1%) | 18 (11.4%) |
| 45 to 54 Years | 90 (83.3%) | 13 (14.4%) |
| 55 to 59 Years | 130 (87.2%) | 0 (0.0%) |
| 60 to 64 Years | 89 (70.6%) | 0 (0.0%) |
| 65 to 74 Years | 17 (9.4%) | 0 (0.0%) |
| 75 Years and over | 0 (0.0%) | 0 (0.0%) |
| Total | 675 (58.2%) | 40 (5.9%) |
Employment Status by Educational Attainment in Hurley
According to labor force statistics for Hurley, 76.9% of individuals (493) out of the total population between 25 and 64 years of age (641) are in the labor force, with 8.1% or 40 of them being unemployed. The group with the highest labor force participation rate are those with the educational attainment of bachelor's degree or higher, with 80.6% or 75 individuals in the labor force. Within the labor force, individuals with high school diploma education have the highest percentage of unemployment, with 13.5% or 27 of them being unemployed.
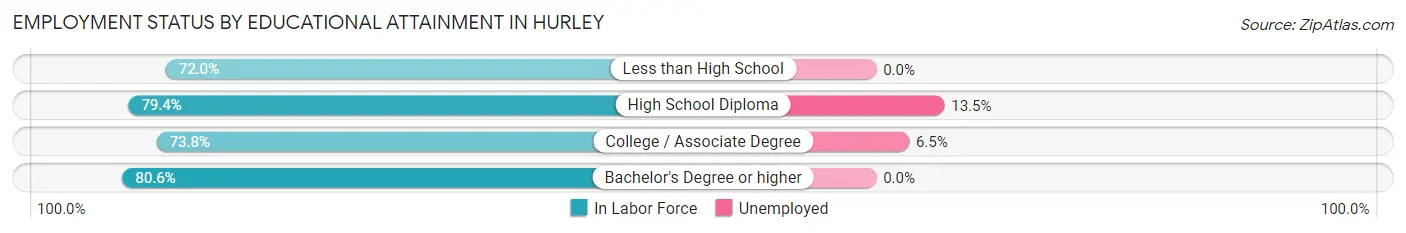
| Educational Attainment | In Labor Force | Unemployed |
| Less than High School | 18 (72.0%) | 0 (0.0%) |
| High School Diploma | 200 (79.4%) | 34 (13.5%) |
| College / Associate Degree | 200 (73.8%) | 18 (6.5%) |
| Bachelor's Degree or higher | 75 (80.6%) | 0 (0.0%) |
| Total | 493 (76.9%) | 52 (8.1%) |
Employment Occupations by Sex in Hurley
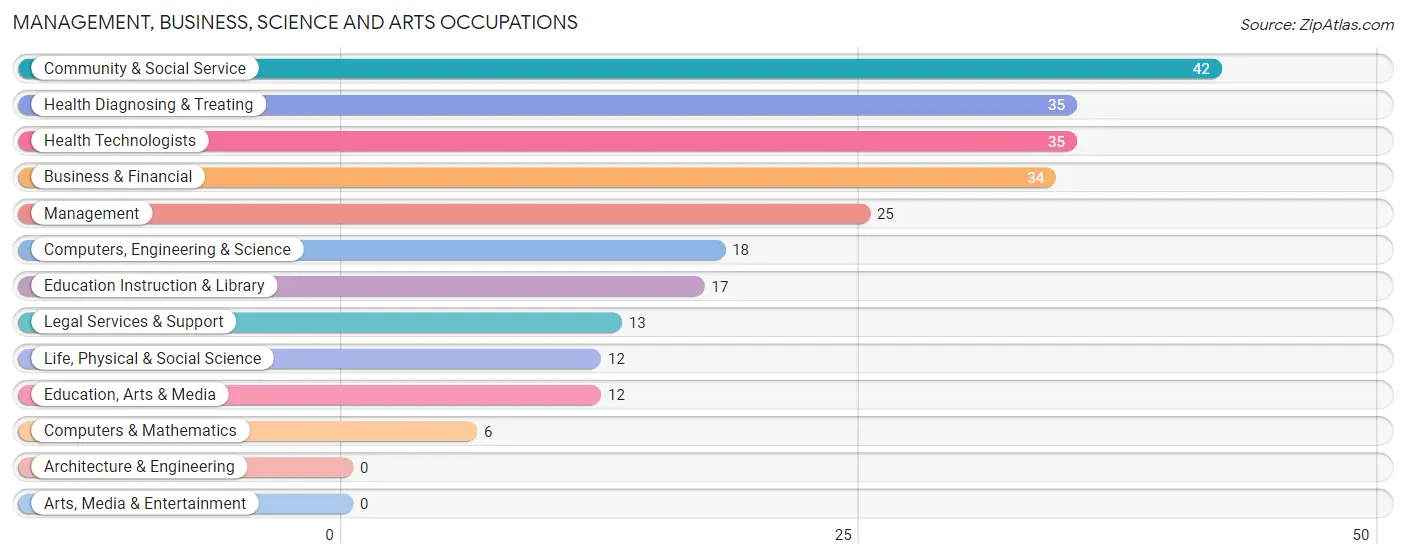
Management, Business, Science and Arts Occupations
The most common Management, Business, Science and Arts occupations in Hurley are Community & Social Service (42 | 6.6%), Health Diagnosing & Treating (35 | 5.5%), Health Technologists (35 | 5.5%), Business & Financial (34 | 5.3%), and Management (25 | 3.9%).
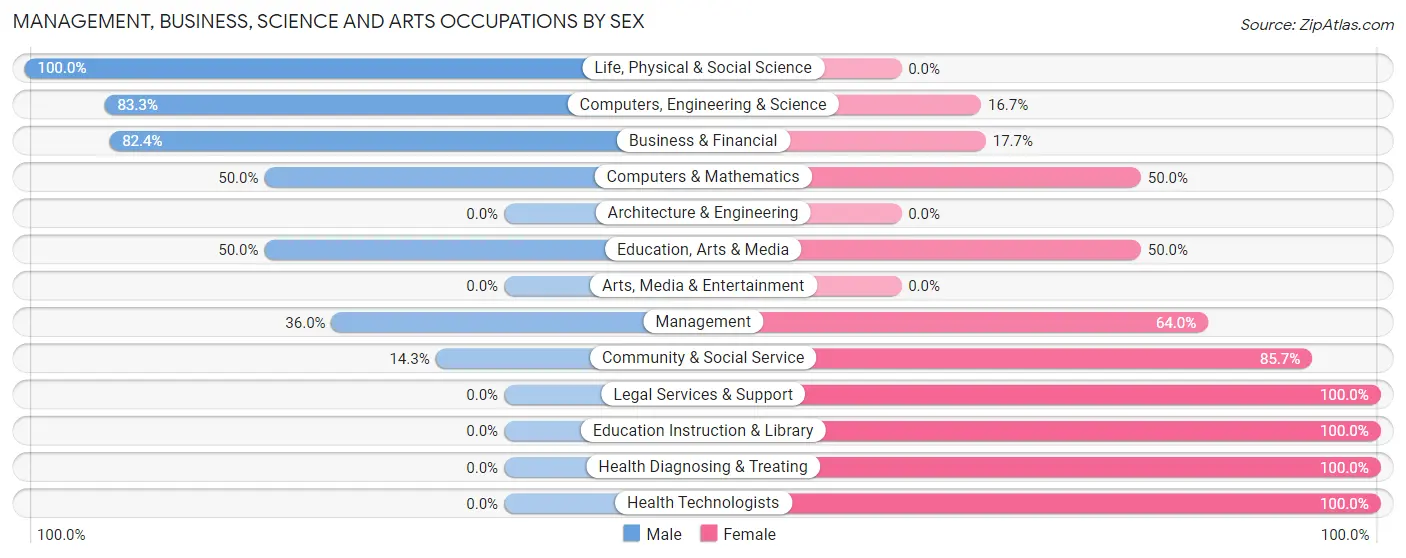
Management, Business, Science and Arts Occupations by Sex
Within the Management, Business, Science and Arts occupations in Hurley, the most male-oriented occupations are Life, Physical & Social Science (100.0%), Computers, Engineering & Science (83.3%), and Business & Financial (82.4%), while the most female-oriented occupations are Legal Services & Support (100.0%), Education Instruction & Library (100.0%), and Health Diagnosing & Treating (100.0%).
| Occupation | Male | Female |
| Management | 9 (36.0%) | 16 (64.0%) |
| Business & Financial | 28 (82.4%) | 6 (17.6%) |
| Computers, Engineering & Science | 15 (83.3%) | 3 (16.7%) |
| Computers & Mathematics | 3 (50.0%) | 3 (50.0%) |
| Architecture & Engineering | 0 (0.0%) | 0 (0.0%) |
| Life, Physical & Social Science | 12 (100.0%) | 0 (0.0%) |
| Community & Social Service | 6 (14.3%) | 36 (85.7%) |
| Education, Arts & Media | 6 (50.0%) | 6 (50.0%) |
| Legal Services & Support | 0 (0.0%) | 13 (100.0%) |
| Education Instruction & Library | 0 (0.0%) | 17 (100.0%) |
| Arts, Media & Entertainment | 0 (0.0%) | 0 (0.0%) |
| Health Diagnosing & Treating | 0 (0.0%) | 35 (100.0%) |
| Health Technologists | 0 (0.0%) | 35 (100.0%) |
| Total (Category) | 58 (37.7%) | 96 (62.3%) |
| Total (Overall) | 329 (51.8%) | 306 (48.2%) |
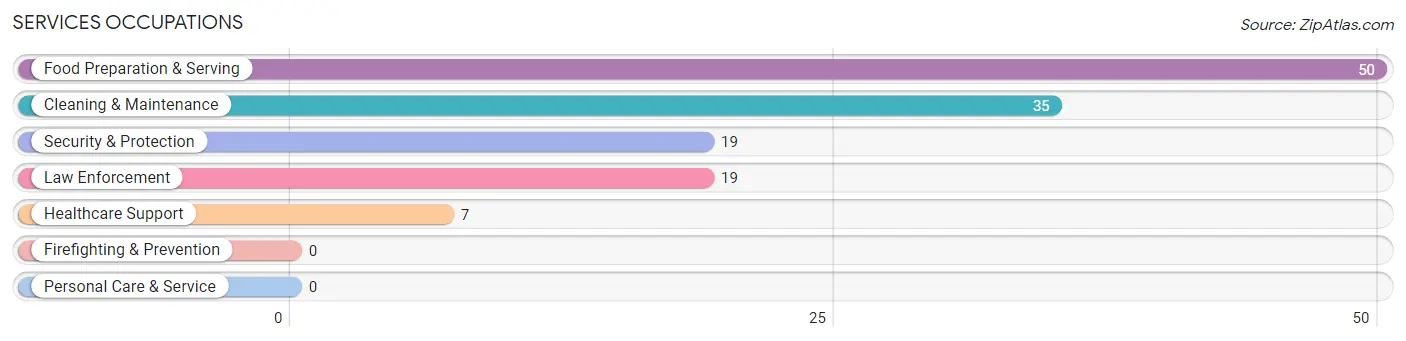
Services Occupations
The most common Services occupations in Hurley are Food Preparation & Serving (50 | 7.9%), Cleaning & Maintenance (35 | 5.5%), Security & Protection (19 | 3.0%), Law Enforcement (19 | 3.0%), and Healthcare Support (7 | 1.1%).
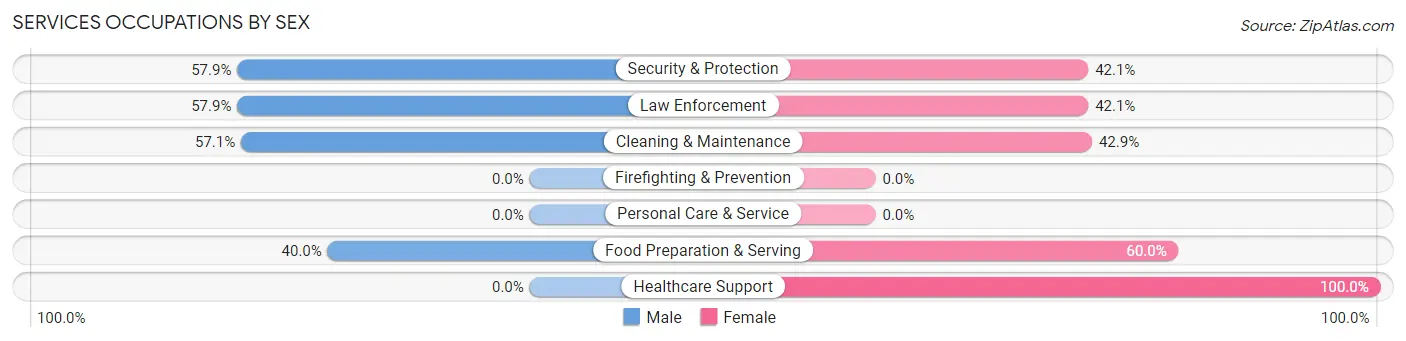
Services Occupations by Sex
Within the Services occupations in Hurley, the most male-oriented occupations are Security & Protection (57.9%), Law Enforcement (57.9%), and Cleaning & Maintenance (57.1%), while the most female-oriented occupations are Healthcare Support (100.0%), Food Preparation & Serving (60.0%), and Cleaning & Maintenance (42.9%).
| Occupation | Male | Female |
| Healthcare Support | 0 (0.0%) | 7 (100.0%) |
| Security & Protection | 11 (57.9%) | 8 (42.1%) |
| Firefighting & Prevention | 0 (0.0%) | 0 (0.0%) |
| Law Enforcement | 11 (57.9%) | 8 (42.1%) |
| Food Preparation & Serving | 20 (40.0%) | 30 (60.0%) |
| Cleaning & Maintenance | 20 (57.1%) | 15 (42.9%) |
| Personal Care & Service | 0 (0.0%) | 0 (0.0%) |
| Total (Category) | 51 (46.0%) | 60 (54.0%) |
| Total (Overall) | 329 (51.8%) | 306 (48.2%) |
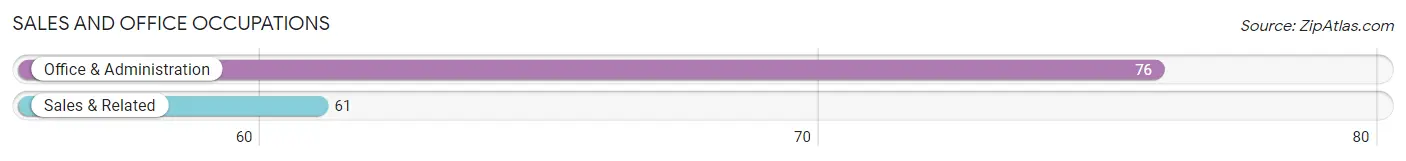
Sales and Office Occupations
The most common Sales and Office occupations in Hurley are Office & Administration (76 | 12.0%), and Sales & Related (61 | 9.6%).
Sales and Office Occupations by Sex
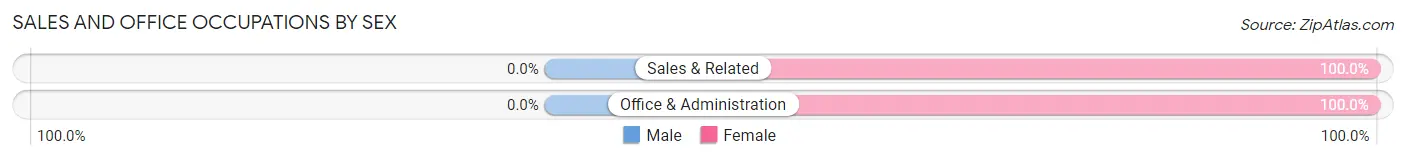
| Occupation | Male | Female |
| Sales & Related | 0 (0.0%) | 61 (100.0%) |
| Office & Administration | 0 (0.0%) | 76 (100.0%) |
| Total (Category) | 0 (0.0%) | 137 (100.0%) |
| Total (Overall) | 329 (51.8%) | 306 (48.2%) |
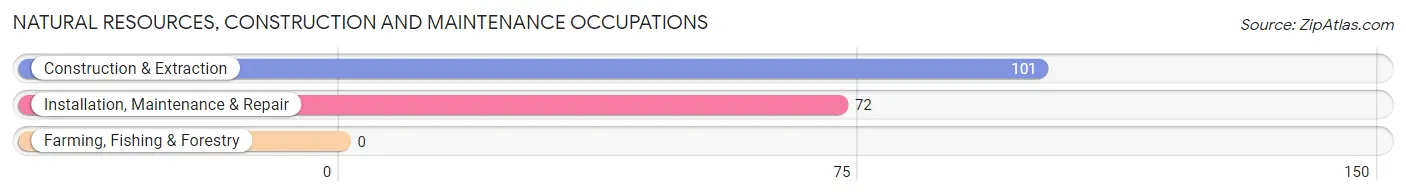
Natural Resources, Construction and Maintenance Occupations
The most common Natural Resources, Construction and Maintenance occupations in Hurley are Construction & Extraction (101 | 15.9%), and Installation, Maintenance & Repair (72 | 11.3%).
Natural Resources, Construction and Maintenance Occupations by Sex
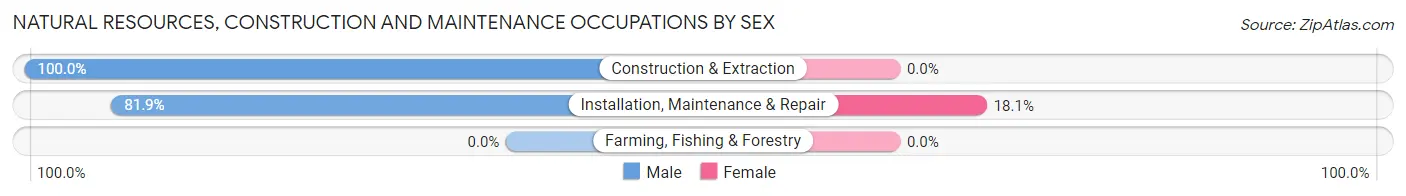
| Occupation | Male | Female |
| Farming, Fishing & Forestry | 0 (0.0%) | 0 (0.0%) |
| Construction & Extraction | 101 (100.0%) | 0 (0.0%) |
| Installation, Maintenance & Repair | 59 (81.9%) | 13 (18.1%) |
| Total (Category) | 160 (92.5%) | 13 (7.5%) |
| Total (Overall) | 329 (51.8%) | 306 (48.2%) |
Production, Transportation and Moving Occupations
The most common Production, Transportation and Moving occupations in Hurley are Transportation (57 | 9.0%), and Production (3 | 0.5%).
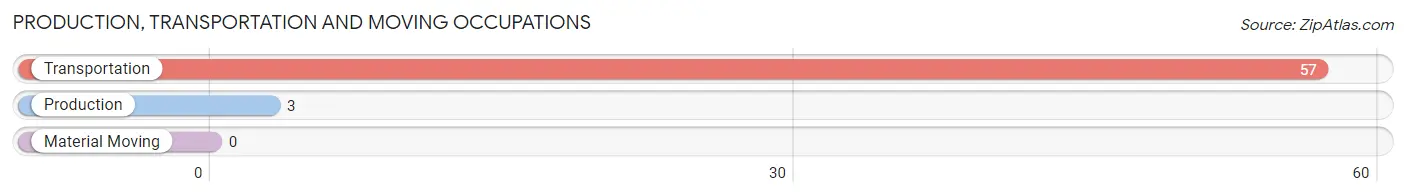
Production, Transportation and Moving Occupations by Sex
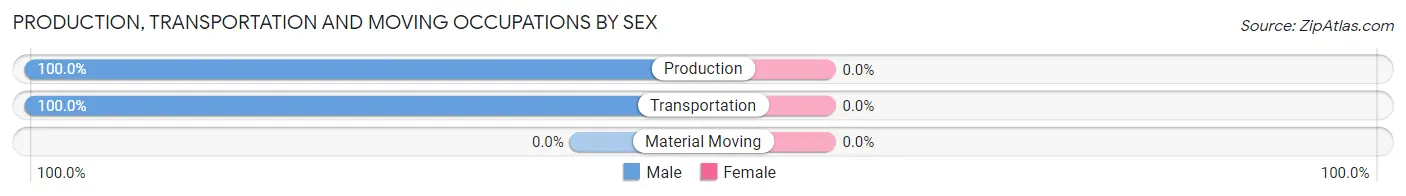
| Occupation | Male | Female |
| Production | 3 (100.0%) | 0 (0.0%) |
| Transportation | 57 (100.0%) | 0 (0.0%) |
| Material Moving | 0 (0.0%) | 0 (0.0%) |
| Total (Category) | 60 (100.0%) | 0 (0.0%) |
| Total (Overall) | 329 (51.8%) | 306 (48.2%) |
Employment Industries by Sex in Hurley
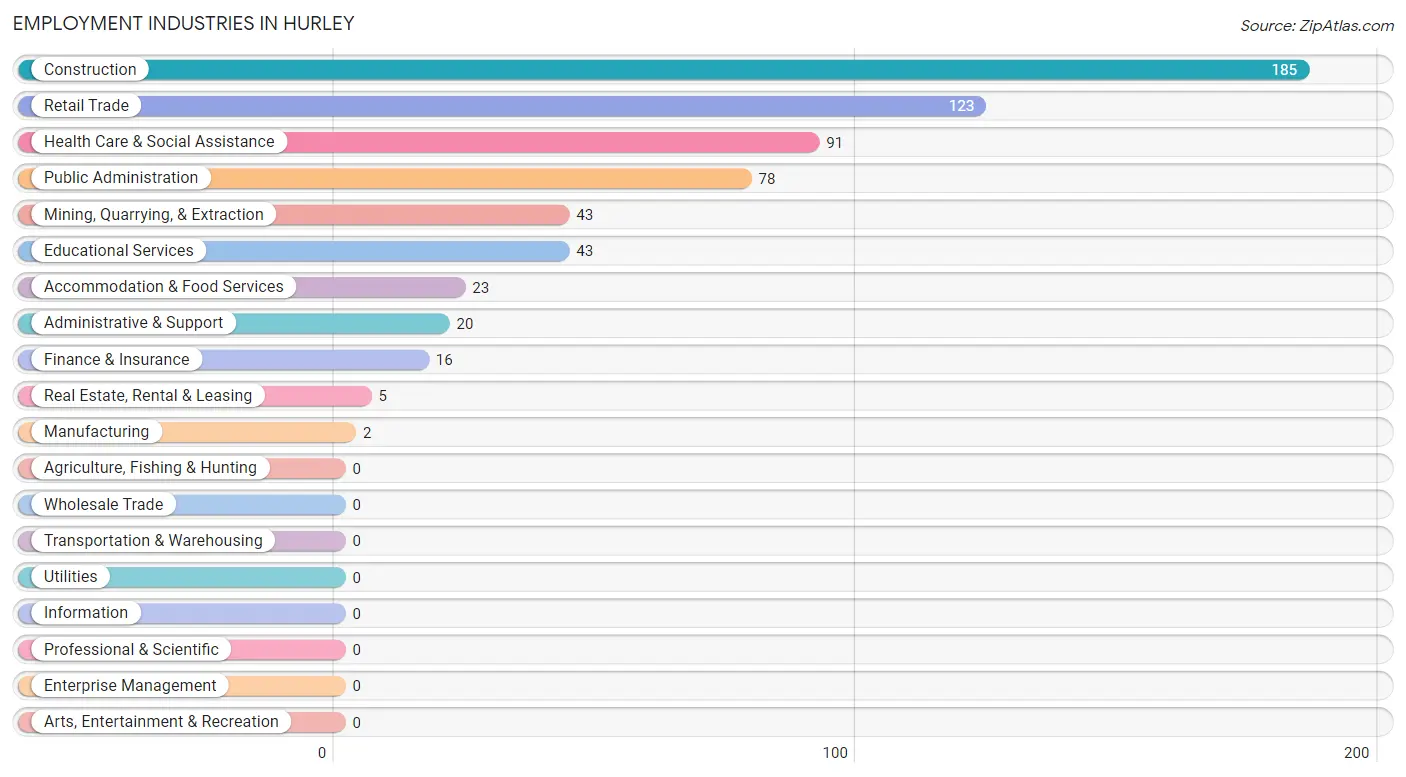
Employment Industries in Hurley
The major employment industries in Hurley include Construction (185 | 29.1%), Retail Trade (123 | 19.4%), Health Care & Social Assistance (91 | 14.3%), Public Administration (78 | 12.3%), and Mining, Quarrying, & Extraction (43 | 6.8%).
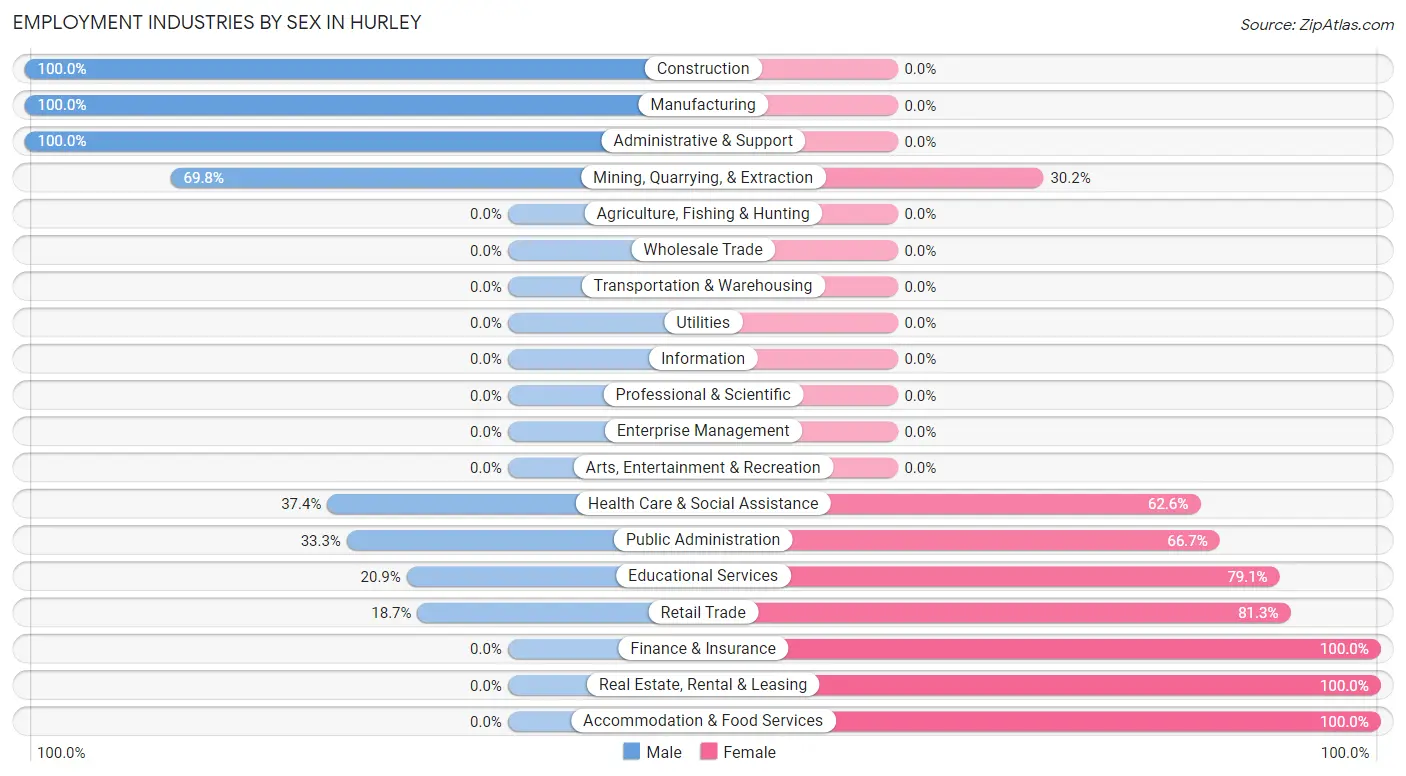
Employment Industries by Sex in Hurley
The Hurley industries that see more men than women are Construction (100.0%), Manufacturing (100.0%), and Administrative & Support (100.0%), whereas the industries that tend to have a higher number of women are Finance & Insurance (100.0%), Real Estate, Rental & Leasing (100.0%), and Accommodation & Food Services (100.0%).
| Industry | Male | Female |
| Agriculture, Fishing & Hunting | 0 (0.0%) | 0 (0.0%) |
| Mining, Quarrying, & Extraction | 30 (69.8%) | 13 (30.2%) |
| Construction | 185 (100.0%) | 0 (0.0%) |
| Manufacturing | 2 (100.0%) | 0 (0.0%) |
| Wholesale Trade | 0 (0.0%) | 0 (0.0%) |
| Retail Trade | 23 (18.7%) | 100 (81.3%) |
| Transportation & Warehousing | 0 (0.0%) | 0 (0.0%) |
| Utilities | 0 (0.0%) | 0 (0.0%) |
| Information | 0 (0.0%) | 0 (0.0%) |
| Finance & Insurance | 0 (0.0%) | 16 (100.0%) |
| Real Estate, Rental & Leasing | 0 (0.0%) | 5 (100.0%) |
| Professional & Scientific | 0 (0.0%) | 0 (0.0%) |
| Enterprise Management | 0 (0.0%) | 0 (0.0%) |
| Administrative & Support | 20 (100.0%) | 0 (0.0%) |
| Educational Services | 9 (20.9%) | 34 (79.1%) |
| Health Care & Social Assistance | 34 (37.4%) | 57 (62.6%) |
| Arts, Entertainment & Recreation | 0 (0.0%) | 0 (0.0%) |
| Accommodation & Food Services | 0 (0.0%) | 23 (100.0%) |
| Public Administration | 26 (33.3%) | 52 (66.7%) |
| Total | 329 (51.8%) | 306 (48.2%) |
Education in Hurley
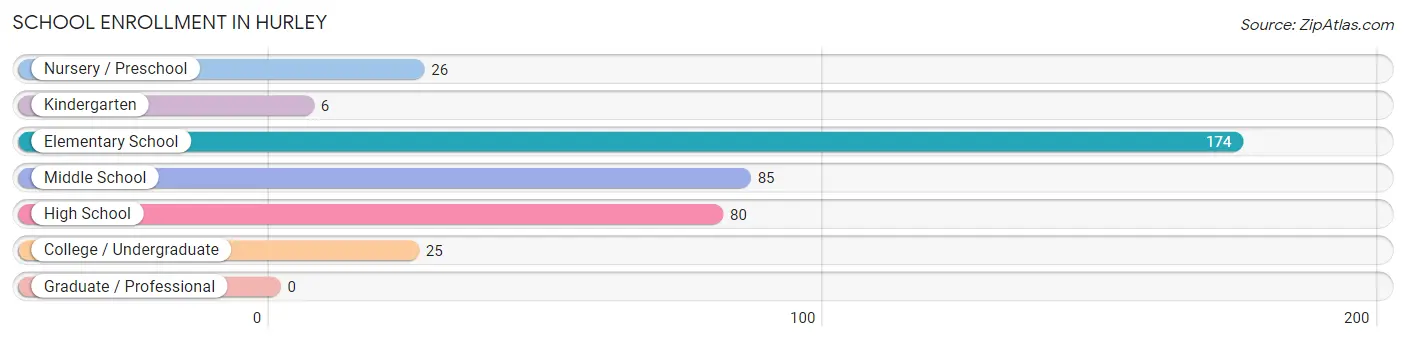
School Enrollment in Hurley
The most common levels of schooling among the 396 students in Hurley are elementary school (174 | 43.9%), middle school (85 | 21.5%), and high school (80 | 20.2%).
| School Level | # Students | % Students |
| Nursery / Preschool | 26 | 6.6% |
| Kindergarten | 6 | 1.5% |
| Elementary School | 174 | 43.9% |
| Middle School | 85 | 21.5% |
| High School | 80 | 20.2% |
| College / Undergraduate | 25 | 6.3% |
| Graduate / Professional | 0 | 0.0% |
| Total | 396 | 100.0% |
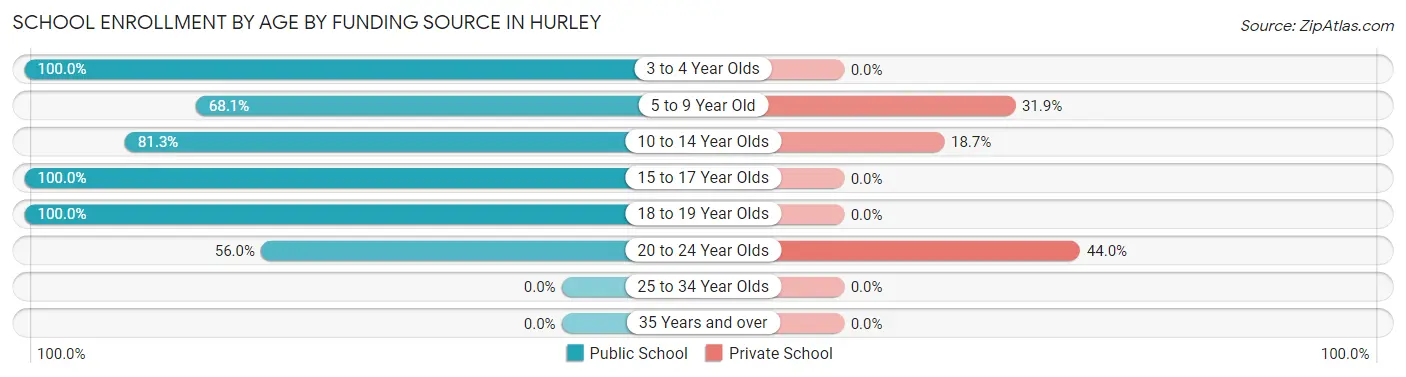
School Enrollment by Age by Funding Source in Hurley
Out of a total of 396 students who are enrolled in schools in Hurley, 91 (23.0%) attend a private institution, while the remaining 305 (77.0%) are enrolled in public schools. The age group of 20 to 24 year olds has the highest likelihood of being enrolled in private schools, with 11 (44.0% in the age bracket) enrolled. Conversely, the age group of 3 to 4 year olds has the lowest likelihood of being enrolled in a private school, with 13 (100.0% in the age bracket) attending a public institution.
| Age Bracket | Public School | Private School |
| 3 to 4 Year Olds | 13 (100.0%) | 0 (0.0%) |
| 5 to 9 Year Old | 128 (68.1%) | 60 (31.9%) |
| 10 to 14 Year Olds | 87 (81.3%) | 20 (18.7%) |
| 15 to 17 Year Olds | 52 (100.0%) | 0 (0.0%) |
| 18 to 19 Year Olds | 11 (100.0%) | 0 (0.0%) |
| 20 to 24 Year Olds | 14 (56.0%) | 11 (44.0%) |
| 25 to 34 Year Olds | 0 (0.0%) | 0 (0.0%) |
| 35 Years and over | 0 (0.0%) | 0 (0.0%) |
| Total | 305 (77.0%) | 91 (23.0%) |
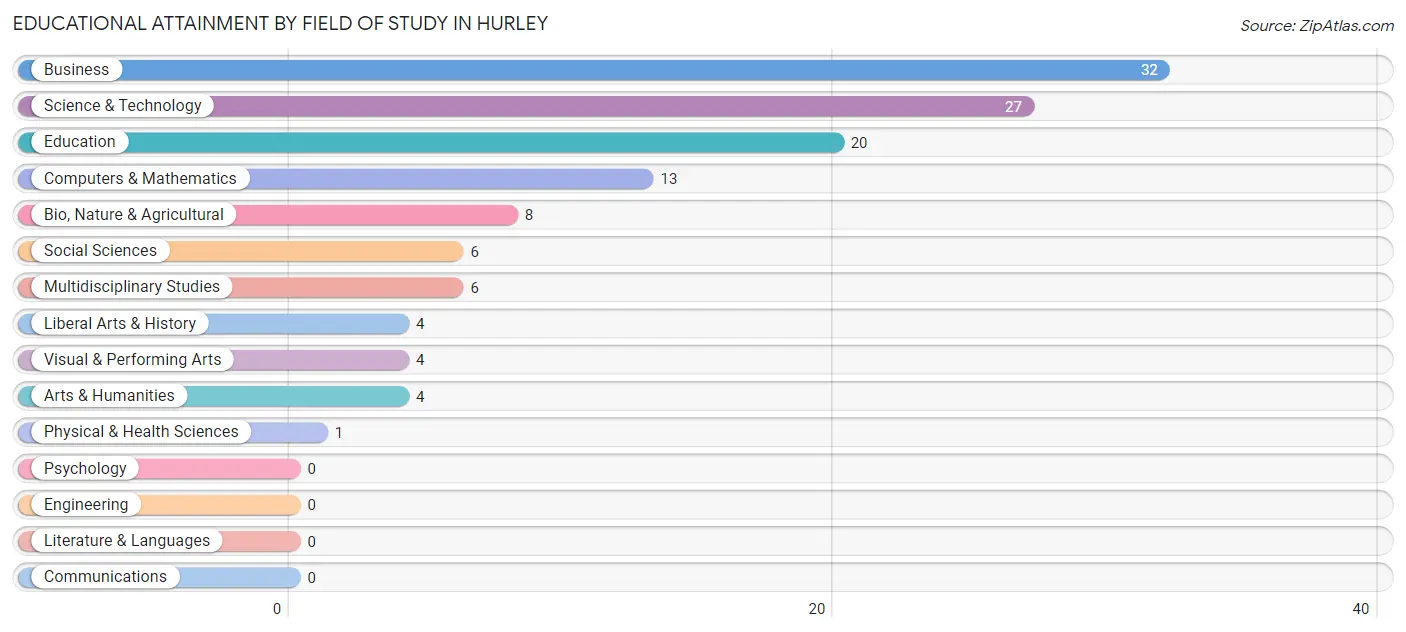
Educational Attainment by Field of Study in Hurley
Business (32 | 25.6%), science & technology (27 | 21.6%), education (20 | 16.0%), computers & mathematics (13 | 10.4%), and bio, nature & agricultural (8 | 6.4%) are the most common fields of study among 125 individuals in Hurley who have obtained a bachelor's degree or higher.
| Field of Study | # Graduates | % Graduates |
| Computers & Mathematics | 13 | 10.4% |
| Bio, Nature & Agricultural | 8 | 6.4% |
| Physical & Health Sciences | 1 | 0.8% |
| Psychology | 0 | 0.0% |
| Social Sciences | 6 | 4.8% |
| Engineering | 0 | 0.0% |
| Multidisciplinary Studies | 6 | 4.8% |
| Science & Technology | 27 | 21.6% |
| Business | 32 | 25.6% |
| Education | 20 | 16.0% |
| Literature & Languages | 0 | 0.0% |
| Liberal Arts & History | 4 | 3.2% |
| Visual & Performing Arts | 4 | 3.2% |
| Communications | 0 | 0.0% |
| Arts & Humanities | 4 | 3.2% |
| Total | 125 | 100.0% |
Transportation & Commute in Hurley
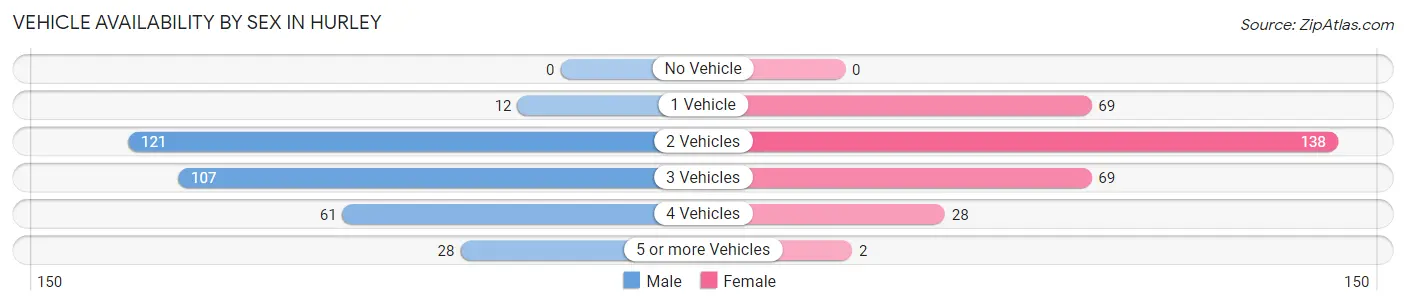
Vehicle Availability by Sex in Hurley
The most prevalent vehicle ownership categories in Hurley are males with 2 vehicles (121, accounting for 36.8%) and females with 2 vehicles (138, making up 39.5%).
| Vehicles Available | Male | Female |
| No Vehicle | 0 (0.0%) | 0 (0.0%) |
| 1 Vehicle | 12 (3.6%) | 69 (22.6%) |
| 2 Vehicles | 121 (36.8%) | 138 (45.1%) |
| 3 Vehicles | 107 (32.5%) | 69 (22.6%) |
| 4 Vehicles | 61 (18.5%) | 28 (9.1%) |
| 5 or more Vehicles | 28 (8.5%) | 2 (0.6%) |
| Total | 329 (100.0%) | 306 (100.0%) |
Commute Time in Hurley
The most frequently occuring commute durations in Hurley are 20 to 24 minutes (145 commuters, 24.6%), 15 to 19 minutes (144 commuters, 24.4%), and 10 to 14 minutes (94 commuters, 16.0%).
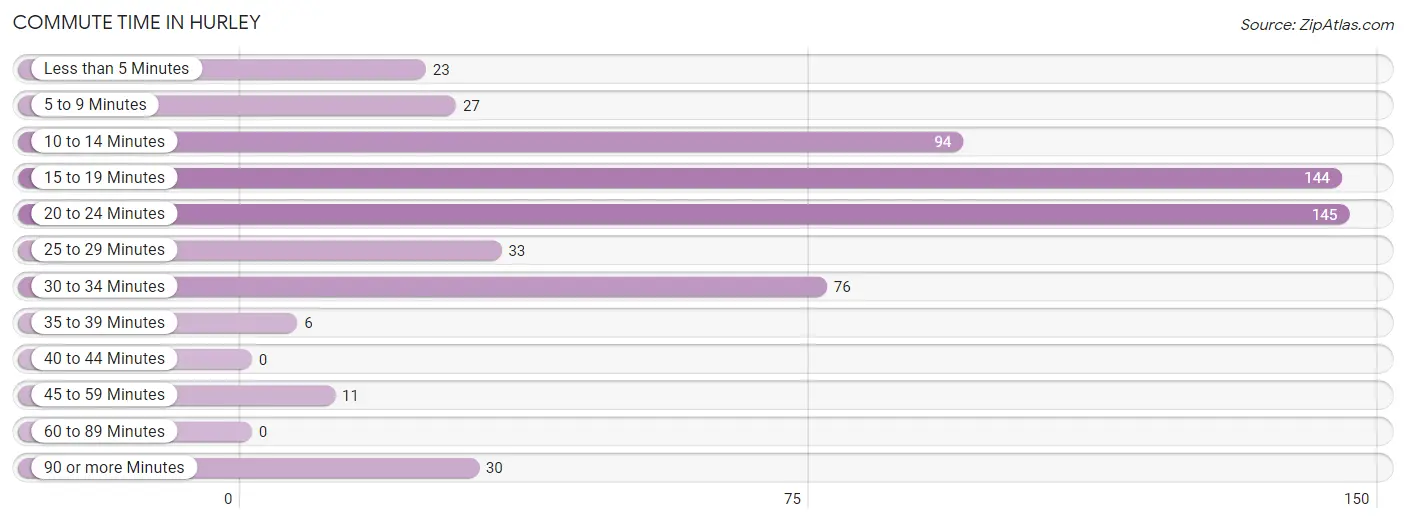
| Commute Time | # Commuters | % Commuters |
| Less than 5 Minutes | 23 | 3.9% |
| 5 to 9 Minutes | 27 | 4.6% |
| 10 to 14 Minutes | 94 | 16.0% |
| 15 to 19 Minutes | 144 | 24.4% |
| 20 to 24 Minutes | 145 | 24.6% |
| 25 to 29 Minutes | 33 | 5.6% |
| 30 to 34 Minutes | 76 | 12.9% |
| 35 to 39 Minutes | 6 | 1.0% |
| 40 to 44 Minutes | 0 | 0.0% |
| 45 to 59 Minutes | 11 | 1.9% |
| 60 to 89 Minutes | 0 | 0.0% |
| 90 or more Minutes | 30 | 5.1% |
Commute Time by Sex in Hurley
The most common commute times in Hurley are 15 to 19 minutes (97 commuters, 29.5%) for males and 20 to 24 minutes (89 commuters, 34.2%) for females.
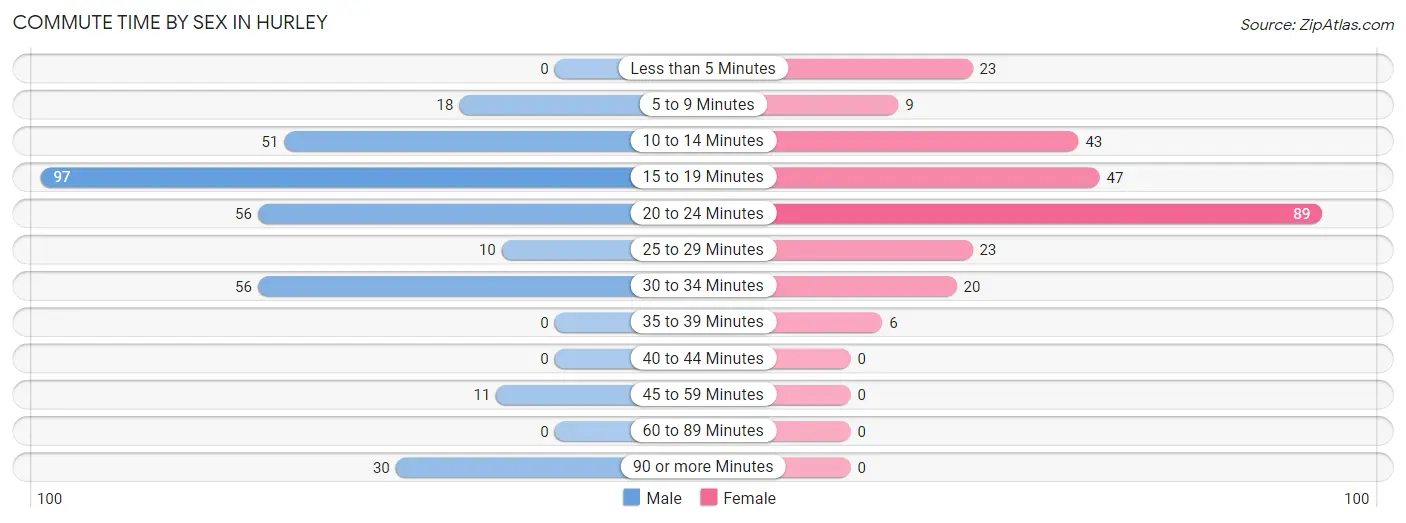
| Commute Time | Male | Female |
| Less than 5 Minutes | 0 (0.0%) | 23 (8.8%) |
| 5 to 9 Minutes | 18 (5.5%) | 9 (3.5%) |
| 10 to 14 Minutes | 51 (15.5%) | 43 (16.5%) |
| 15 to 19 Minutes | 97 (29.5%) | 47 (18.1%) |
| 20 to 24 Minutes | 56 (17.0%) | 89 (34.2%) |
| 25 to 29 Minutes | 10 (3.0%) | 23 (8.8%) |
| 30 to 34 Minutes | 56 (17.0%) | 20 (7.7%) |
| 35 to 39 Minutes | 0 (0.0%) | 6 (2.3%) |
| 40 to 44 Minutes | 0 (0.0%) | 0 (0.0%) |
| 45 to 59 Minutes | 11 (3.3%) | 0 (0.0%) |
| 60 to 89 Minutes | 0 (0.0%) | 0 (0.0%) |
| 90 or more Minutes | 30 (9.1%) | 0 (0.0%) |
Time of Departure to Work by Sex in Hurley
The most frequent times of departure to work in Hurley are 6:30 AM to 6:59 AM (175, 53.2%) for males and 8:00 AM to 8:29 AM (54, 20.8%) for females.
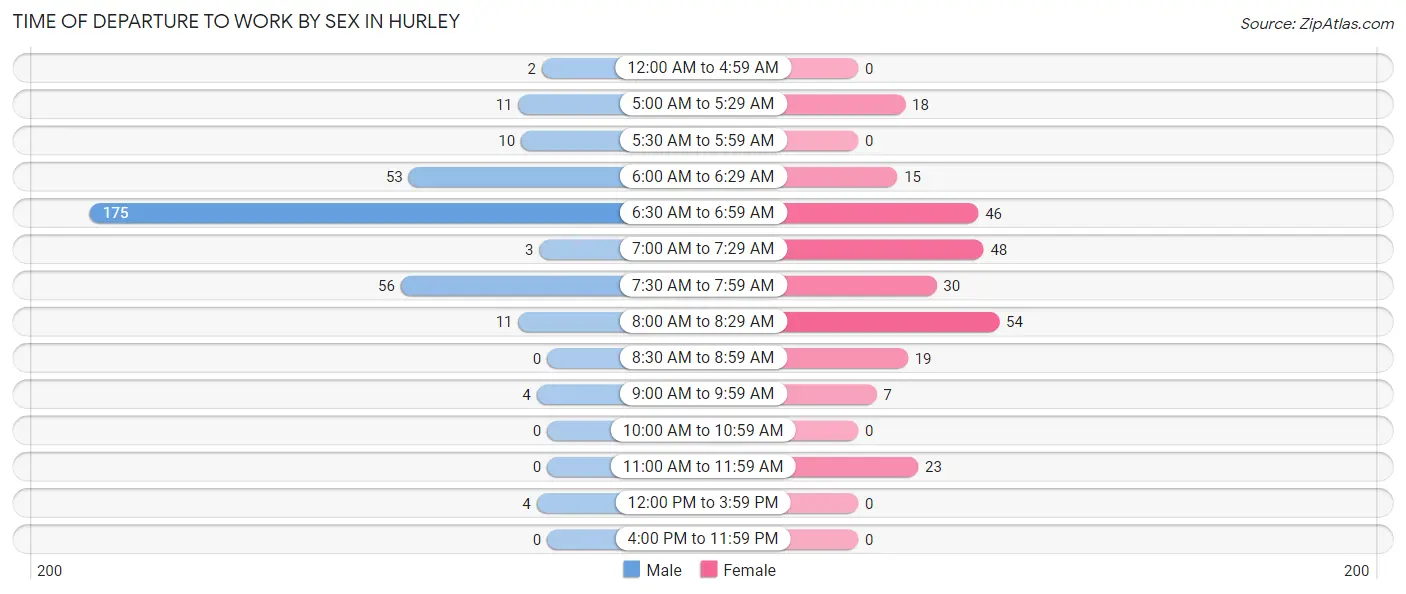
| Time of Departure | Male | Female |
| 12:00 AM to 4:59 AM | 2 (0.6%) | 0 (0.0%) |
| 5:00 AM to 5:29 AM | 11 (3.3%) | 18 (6.9%) |
| 5:30 AM to 5:59 AM | 10 (3.0%) | 0 (0.0%) |
| 6:00 AM to 6:29 AM | 53 (16.1%) | 15 (5.8%) |
| 6:30 AM to 6:59 AM | 175 (53.2%) | 46 (17.7%) |
| 7:00 AM to 7:29 AM | 3 (0.9%) | 48 (18.5%) |
| 7:30 AM to 7:59 AM | 56 (17.0%) | 30 (11.5%) |
| 8:00 AM to 8:29 AM | 11 (3.3%) | 54 (20.8%) |
| 8:30 AM to 8:59 AM | 0 (0.0%) | 19 (7.3%) |
| 9:00 AM to 9:59 AM | 4 (1.2%) | 7 (2.7%) |
| 10:00 AM to 10:59 AM | 0 (0.0%) | 0 (0.0%) |
| 11:00 AM to 11:59 AM | 0 (0.0%) | 23 (8.8%) |
| 12:00 PM to 3:59 PM | 4 (1.2%) | 0 (0.0%) |
| 4:00 PM to 11:59 PM | 0 (0.0%) | 0 (0.0%) |
| Total | 329 (100.0%) | 260 (100.0%) |
Housing Occupancy in Hurley
Occupancy by Ownership in Hurley
Of the total 631 dwellings in Hurley, owner-occupied units account for 469 (74.3%), while renter-occupied units make up 162 (25.7%).
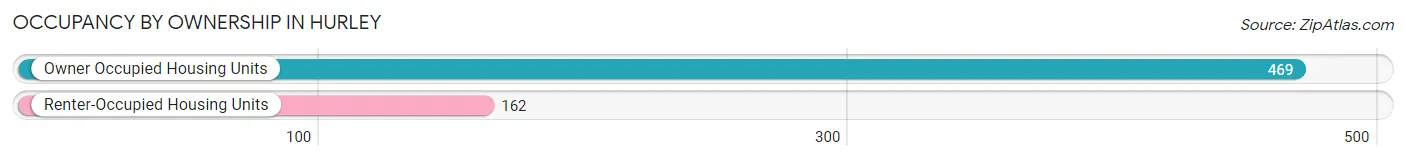
| Occupancy | # Housing Units | % Housing Units |
| Owner Occupied Housing Units | 469 | 74.3% |
| Renter-Occupied Housing Units | 162 | 25.7% |
| Total Occupied Housing Units | 631 | 100.0% |
Occupancy by Household Size in Hurley
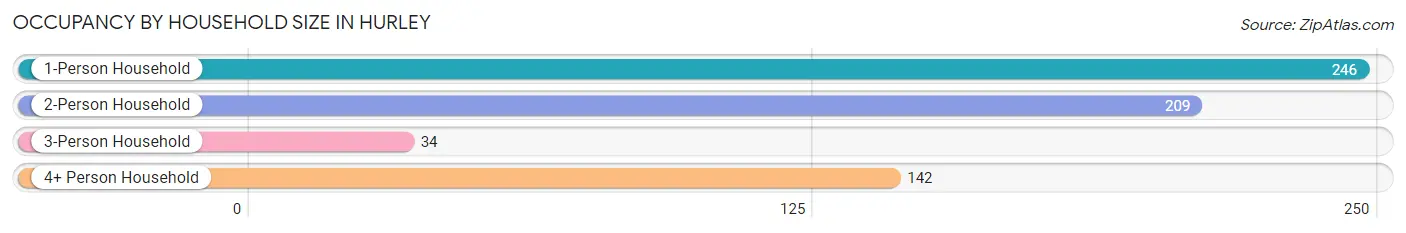
| Household Size | # Housing Units | % Housing Units |
| 1-Person Household | 246 | 39.0% |
| 2-Person Household | 209 | 33.1% |
| 3-Person Household | 34 | 5.4% |
| 4+ Person Household | 142 | 22.5% |
| Total Housing Units | 631 | 100.0% |
Occupancy by Ownership by Household Size in Hurley
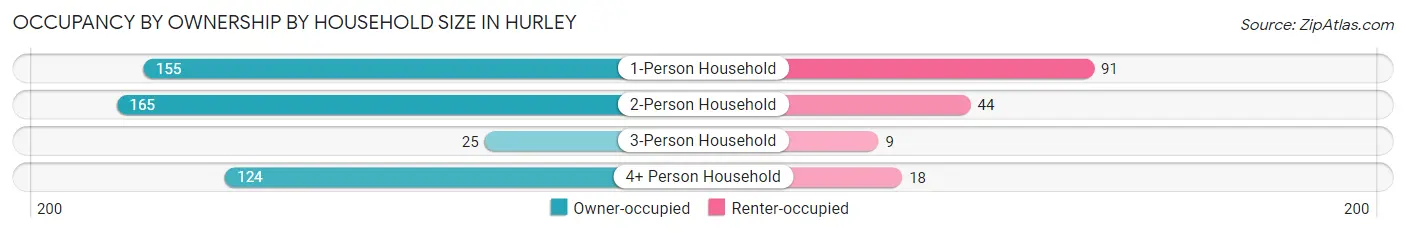
| Household Size | Owner-occupied | Renter-occupied |
| 1-Person Household | 155 (63.0%) | 91 (37.0%) |
| 2-Person Household | 165 (78.9%) | 44 (21.0%) |
| 3-Person Household | 25 (73.5%) | 9 (26.5%) |
| 4+ Person Household | 124 (87.3%) | 18 (12.7%) |
| Total Housing Units | 469 (74.3%) | 162 (25.7%) |
Occupancy by Educational Attainment in Hurley
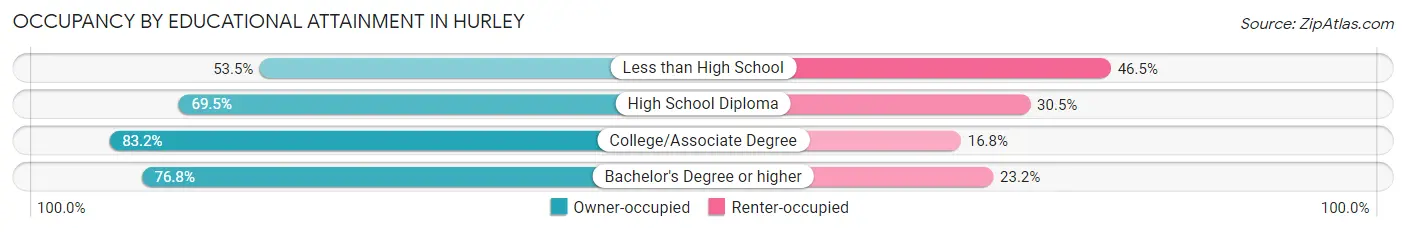
| Household Size | Owner-occupied | Renter-occupied |
| Less than High School | 46 (53.5%) | 40 (46.5%) |
| High School Diploma | 132 (69.5%) | 58 (30.5%) |
| College/Associate Degree | 238 (83.2%) | 48 (16.8%) |
| Bachelor's Degree or higher | 53 (76.8%) | 16 (23.2%) |
Occupancy by Age of Householder in Hurley
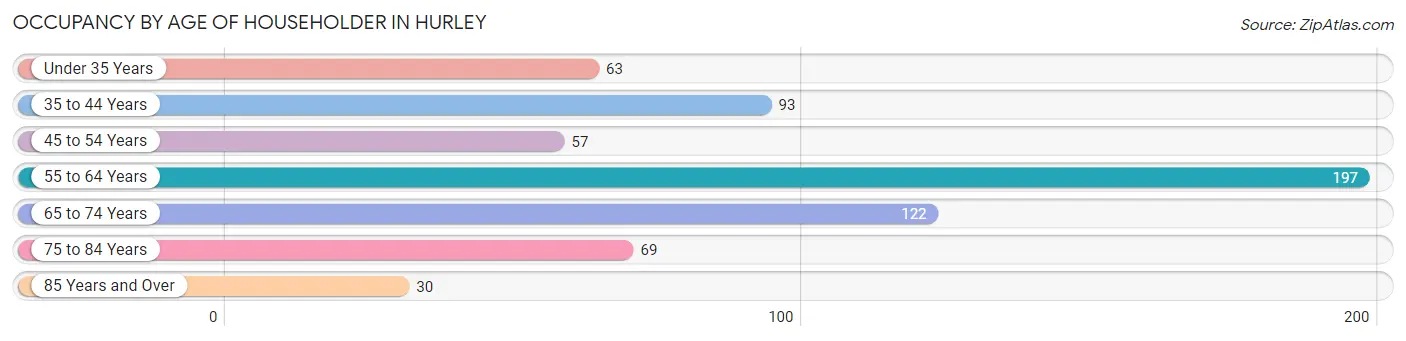
| Age Bracket | # Households | % Households |
| Under 35 Years | 63 | 10.0% |
| 35 to 44 Years | 93 | 14.7% |
| 45 to 54 Years | 57 | 9.0% |
| 55 to 64 Years | 197 | 31.2% |
| 65 to 74 Years | 122 | 19.3% |
| 75 to 84 Years | 69 | 10.9% |
| 85 Years and Over | 30 | 4.8% |
| Total | 631 | 100.0% |
Housing Finances in Hurley
Median Income by Occupancy in Hurley
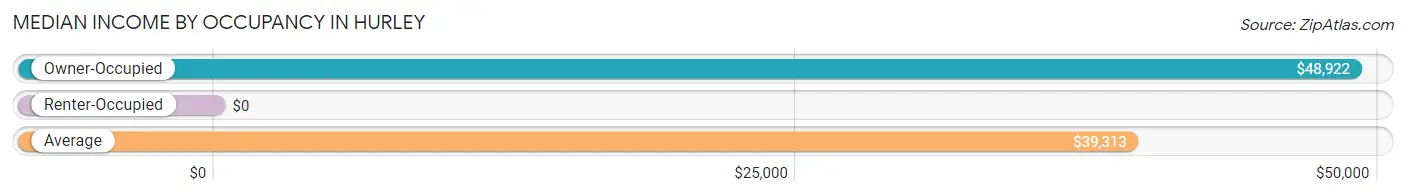
| Occupancy Type | # Households | Median Income |
| Owner-Occupied | 469 (74.3%) | $48,922 |
| Renter-Occupied | 162 (25.7%) | $0 |
| Average | 631 (100.0%) | $39,313 |
Occupancy by Householder Income Bracket in Hurley
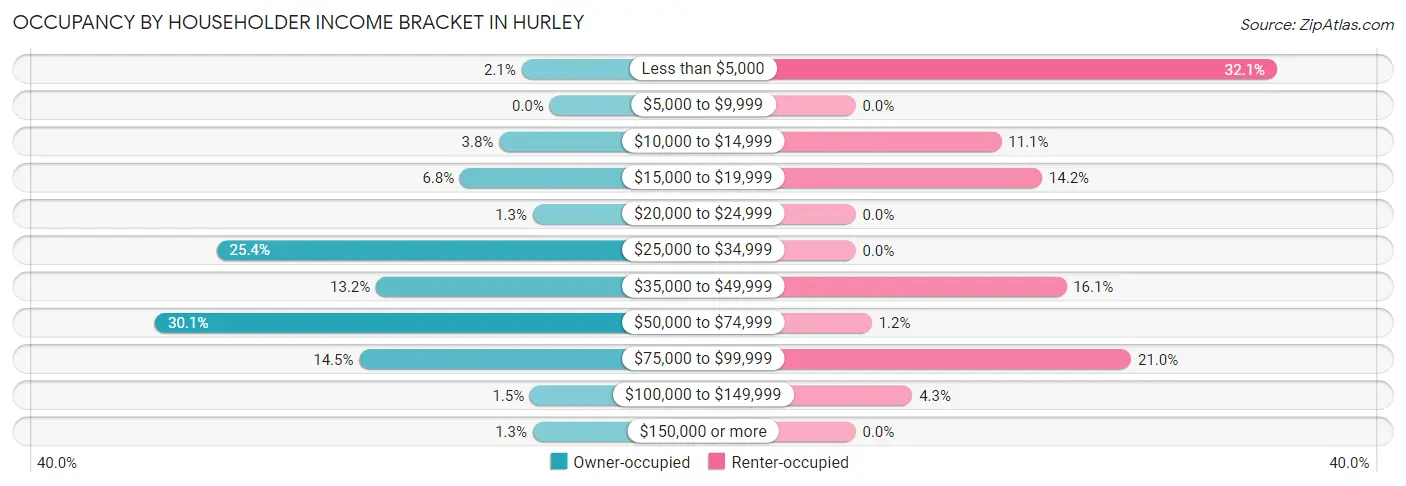
| Income Bracket | Owner-occupied | Renter-occupied |
| Less than $5,000 | 10 (2.1%) | 52 (32.1%) |
| $5,000 to $9,999 | 0 (0.0%) | 0 (0.0%) |
| $10,000 to $14,999 | 18 (3.8%) | 18 (11.1%) |
| $15,000 to $19,999 | 32 (6.8%) | 23 (14.2%) |
| $20,000 to $24,999 | 6 (1.3%) | 0 (0.0%) |
| $25,000 to $34,999 | 119 (25.4%) | 0 (0.0%) |
| $35,000 to $49,999 | 62 (13.2%) | 26 (16.1%) |
| $50,000 to $74,999 | 141 (30.1%) | 2 (1.2%) |
| $75,000 to $99,999 | 68 (14.5%) | 34 (21.0%) |
| $100,000 to $149,999 | 7 (1.5%) | 7 (4.3%) |
| $150,000 or more | 6 (1.3%) | 0 (0.0%) |
| Total | 469 (100.0%) | 162 (100.0%) |
Monthly Housing Cost Tiers in Hurley
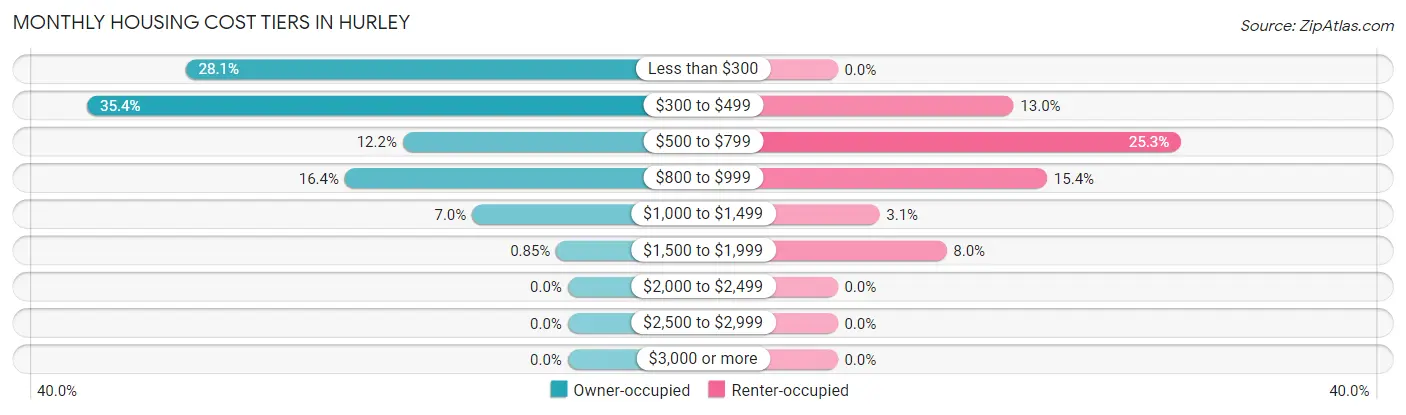
| Monthly Cost | Owner-occupied | Renter-occupied |
| Less than $300 | 132 (28.1%) | 0 (0.0%) |
| $300 to $499 | 166 (35.4%) | 21 (13.0%) |
| $500 to $799 | 57 (12.1%) | 41 (25.3%) |
| $800 to $999 | 77 (16.4%) | 25 (15.4%) |
| $1,000 to $1,499 | 33 (7.0%) | 5 (3.1%) |
| $1,500 to $1,999 | 4 (0.9%) | 13 (8.0%) |
| $2,000 to $2,499 | 0 (0.0%) | 0 (0.0%) |
| $2,500 to $2,999 | 0 (0.0%) | 0 (0.0%) |
| $3,000 or more | 0 (0.0%) | 0 (0.0%) |
| Total | 469 (100.0%) | 162 (100.0%) |
Physical Housing Characteristics in Hurley
Housing Structures in Hurley
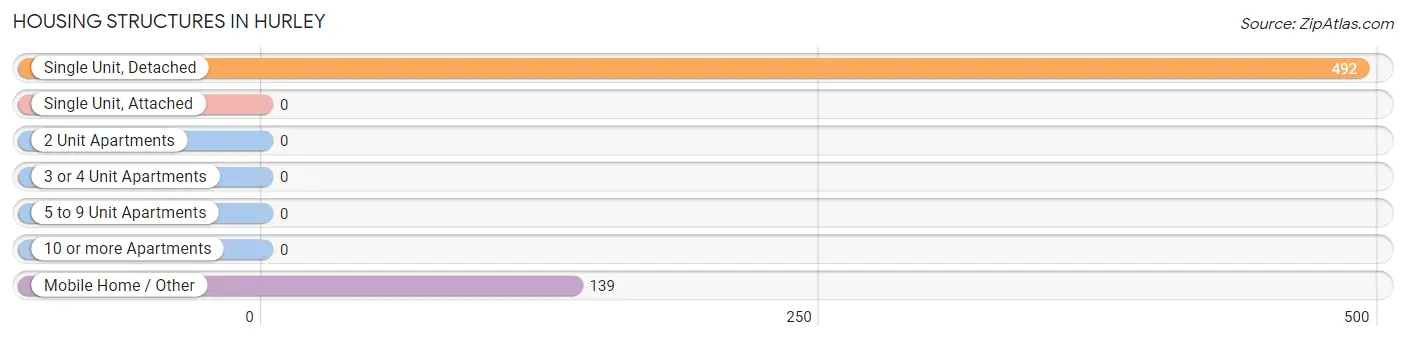
| Structure Type | # Housing Units | % Housing Units |
| Single Unit, Detached | 492 | 78.0% |
| Single Unit, Attached | 0 | 0.0% |
| 2 Unit Apartments | 0 | 0.0% |
| 3 or 4 Unit Apartments | 0 | 0.0% |
| 5 to 9 Unit Apartments | 0 | 0.0% |
| 10 or more Apartments | 0 | 0.0% |
| Mobile Home / Other | 139 | 22.0% |
| Total | 631 | 100.0% |
Housing Structures by Occupancy in Hurley
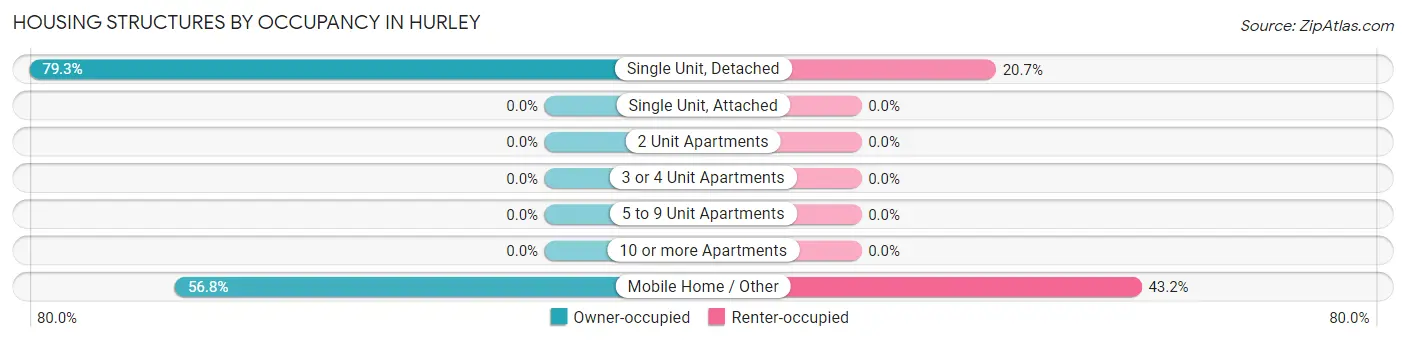
| Structure Type | Owner-occupied | Renter-occupied |
| Single Unit, Detached | 390 (79.3%) | 102 (20.7%) |
| Single Unit, Attached | 0 (0.0%) | 0 (0.0%) |
| 2 Unit Apartments | 0 (0.0%) | 0 (0.0%) |
| 3 or 4 Unit Apartments | 0 (0.0%) | 0 (0.0%) |
| 5 to 9 Unit Apartments | 0 (0.0%) | 0 (0.0%) |
| 10 or more Apartments | 0 (0.0%) | 0 (0.0%) |
| Mobile Home / Other | 79 (56.8%) | 60 (43.2%) |
| Total | 469 (74.3%) | 162 (25.7%) |
Housing Structures by Number of Rooms in Hurley
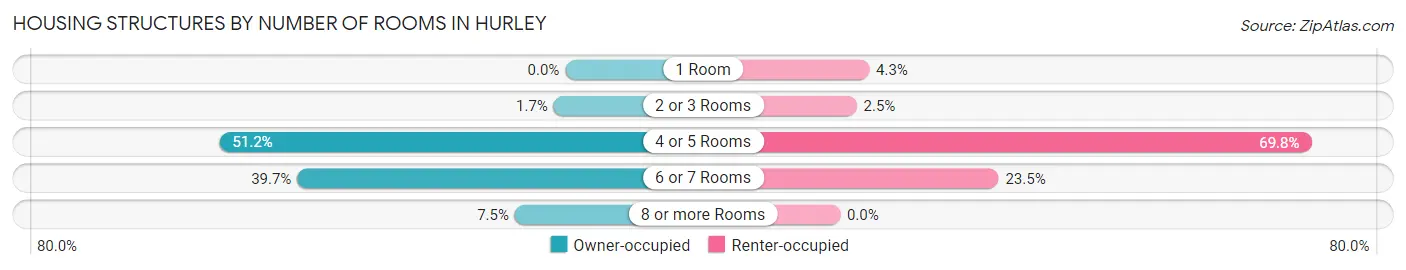
| Number of Rooms | Owner-occupied | Renter-occupied |
| 1 Room | 0 (0.0%) | 7 (4.3%) |
| 2 or 3 Rooms | 8 (1.7%) | 4 (2.5%) |
| 4 or 5 Rooms | 240 (51.2%) | 113 (69.8%) |
| 6 or 7 Rooms | 186 (39.7%) | 38 (23.5%) |
| 8 or more Rooms | 35 (7.5%) | 0 (0.0%) |
| Total | 469 (100.0%) | 162 (100.0%) |
Housing Structure by Heating Type in Hurley
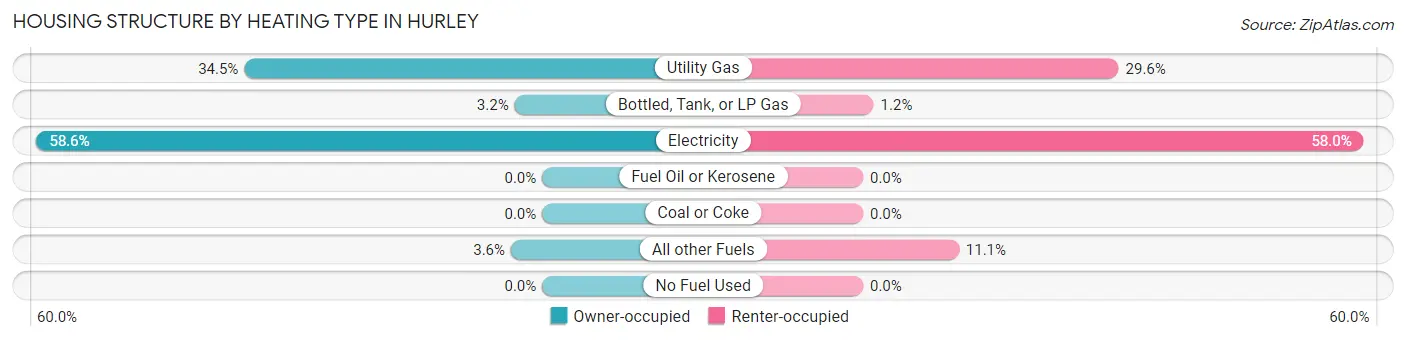
| Heating Type | Owner-occupied | Renter-occupied |
| Utility Gas | 162 (34.5%) | 48 (29.6%) |
| Bottled, Tank, or LP Gas | 15 (3.2%) | 2 (1.2%) |
| Electricity | 275 (58.6%) | 94 (58.0%) |
| Fuel Oil or Kerosene | 0 (0.0%) | 0 (0.0%) |
| Coal or Coke | 0 (0.0%) | 0 (0.0%) |
| All other Fuels | 17 (3.6%) | 18 (11.1%) |
| No Fuel Used | 0 (0.0%) | 0 (0.0%) |
| Total | 469 (100.0%) | 162 (100.0%) |
Household Vehicle Usage in Hurley
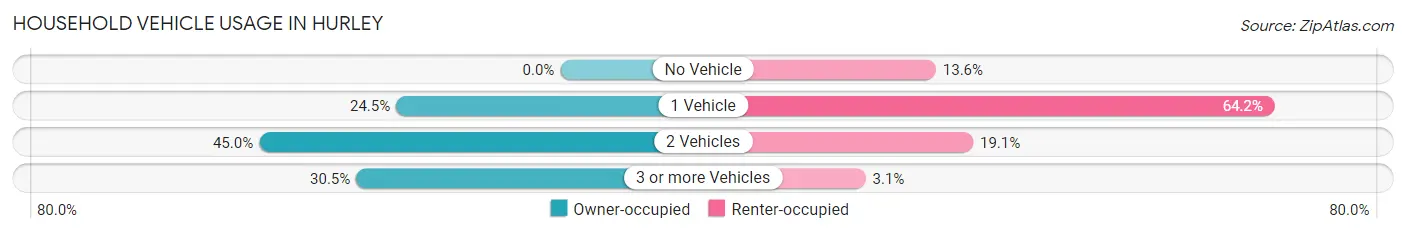
| Vehicles per Household | Owner-occupied | Renter-occupied |
| No Vehicle | 0 (0.0%) | 22 (13.6%) |
| 1 Vehicle | 115 (24.5%) | 104 (64.2%) |
| 2 Vehicles | 211 (45.0%) | 31 (19.1%) |
| 3 or more Vehicles | 143 (30.5%) | 5 (3.1%) |
| Total | 469 (100.0%) | 162 (100.0%) |
Real Estate & Mortgages in Hurley
Real Estate and Mortgage Overview in Hurley
| Characteristic | Without Mortgage | With Mortgage |
| Housing Units | 301 | 168 |
| Median Property Value | $92,100 | $65,800 |
| Median Household Income | $37,563 | $0 |
| Monthly Housing Costs | $321 | $0 |
| Real Estate Taxes | $447 | $0 |
Property Value by Mortgage Status in Hurley
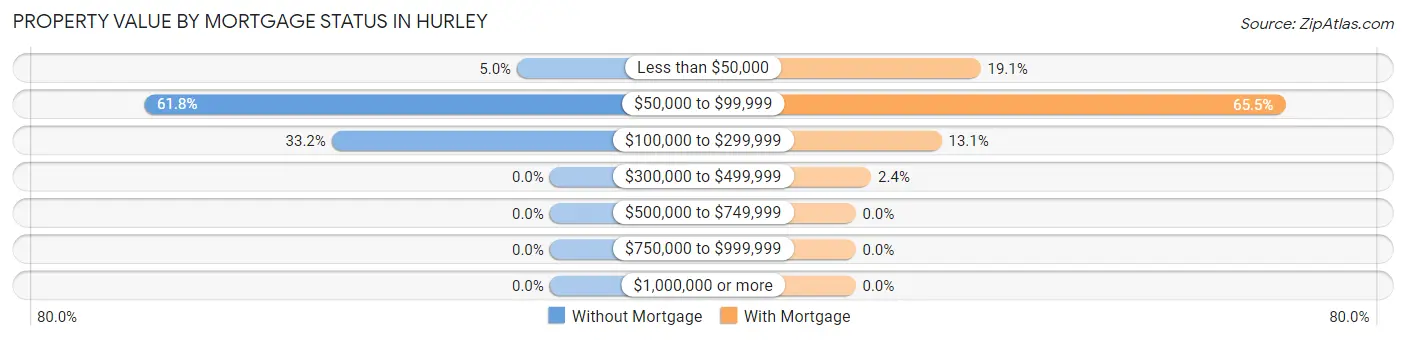
| Property Value | Without Mortgage | With Mortgage |
| Less than $50,000 | 15 (5.0%) | 32 (19.1%) |
| $50,000 to $99,999 | 186 (61.8%) | 110 (65.5%) |
| $100,000 to $299,999 | 100 (33.2%) | 22 (13.1%) |
| $300,000 to $499,999 | 0 (0.0%) | 4 (2.4%) |
| $500,000 to $749,999 | 0 (0.0%) | 0 (0.0%) |
| $750,000 to $999,999 | 0 (0.0%) | 0 (0.0%) |
| $1,000,000 or more | 0 (0.0%) | 0 (0.0%) |
| Total | 301 (100.0%) | 168 (100.0%) |
Household Income by Mortgage Status in Hurley
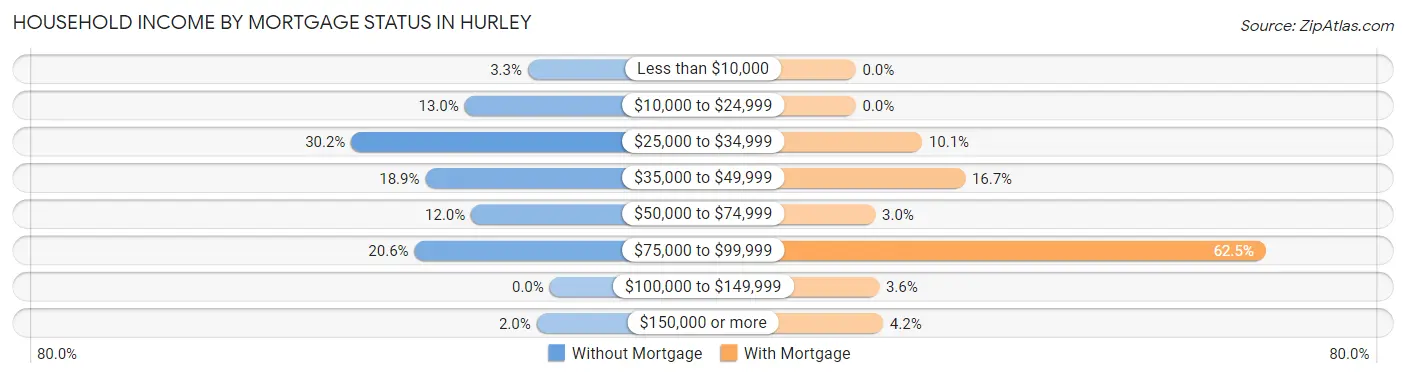
| Household Income | Without Mortgage | With Mortgage |
| Less than $10,000 | 10 (3.3%) | 0 (0.0%) |
| $10,000 to $24,999 | 39 (13.0%) | 0 (0.0%) |
| $25,000 to $34,999 | 91 (30.2%) | 17 (10.1%) |
| $35,000 to $49,999 | 57 (18.9%) | 28 (16.7%) |
| $50,000 to $74,999 | 36 (12.0%) | 5 (3.0%) |
| $75,000 to $99,999 | 62 (20.6%) | 105 (62.5%) |
| $100,000 to $149,999 | 0 (0.0%) | 6 (3.6%) |
| $150,000 or more | 6 (2.0%) | 7 (4.2%) |
| Total | 301 (100.0%) | 168 (100.0%) |
Property Value to Household Income Ratio in Hurley
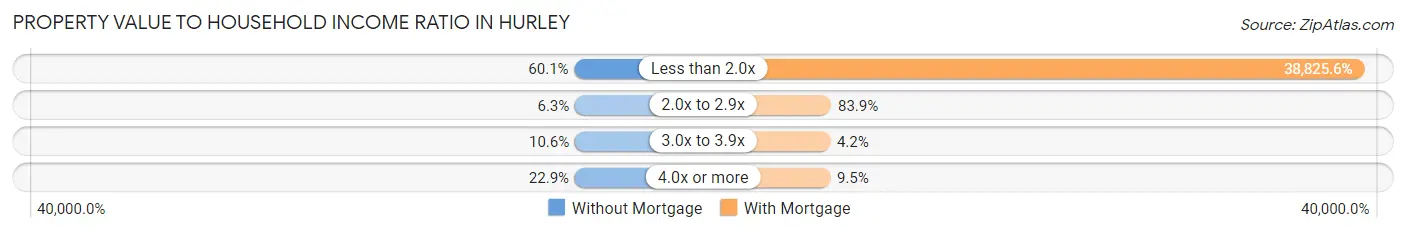
| Value-to-Income Ratio | Without Mortgage | With Mortgage |
| Less than 2.0x | 181 (60.1%) | 65,227 (38,825.6%) |
| 2.0x to 2.9x | 19 (6.3%) | 141 (83.9%) |
| 3.0x to 3.9x | 32 (10.6%) | 7 (4.2%) |
| 4.0x or more | 69 (22.9%) | 16 (9.5%) |
| Total | 301 (100.0%) | 168 (100.0%) |
Real Estate Taxes by Mortgage Status in Hurley
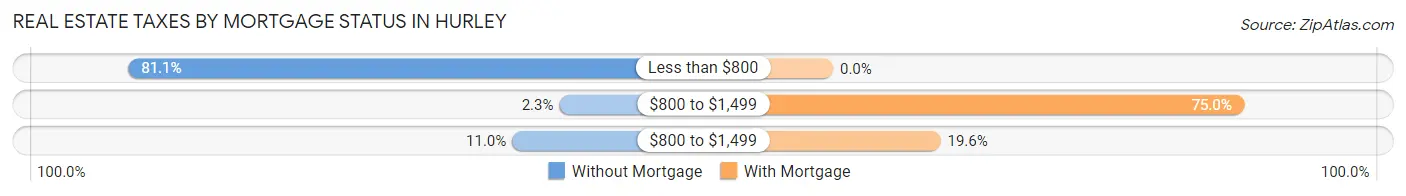
| Property Taxes | Without Mortgage | With Mortgage |
| Less than $800 | 244 (81.1%) | 0 (0.0%) |
| $800 to $1,499 | 7 (2.3%) | 126 (75.0%) |
| $800 to $1,499 | 33 (11.0%) | 33 (19.6%) |
| Total | 301 (100.0%) | 168 (100.0%) |
Health & Disability in Hurley
Health Insurance Coverage by Age in Hurley
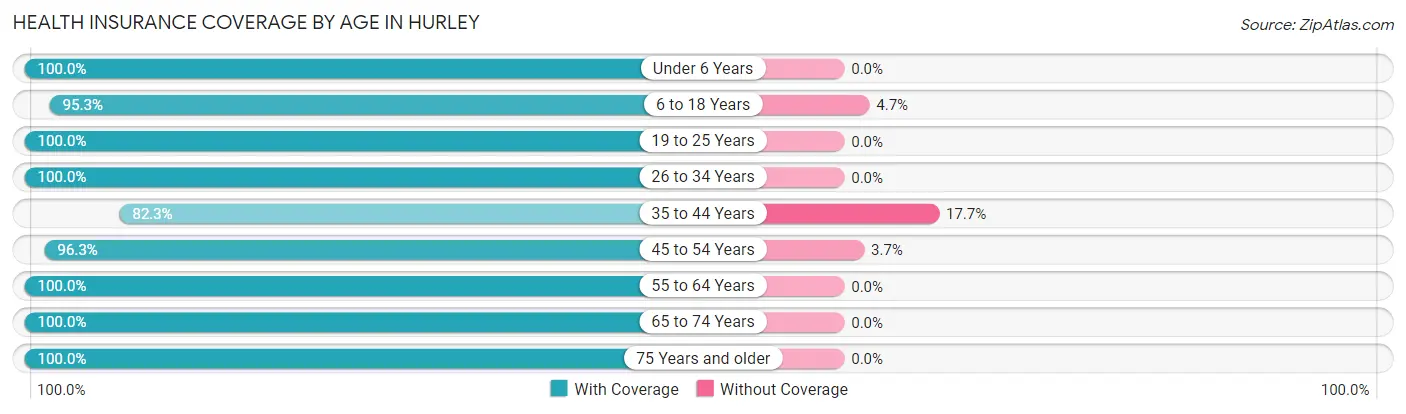
| Age Bracket | With Coverage | Without Coverage |
| Under 6 Years | 83 (100.0%) | 0 (0.0%) |
| 6 to 18 Years | 346 (95.3%) | 17 (4.7%) |
| 19 to 25 Years | 157 (100.0%) | 0 (0.0%) |
| 26 to 34 Years | 26 (100.0%) | 0 (0.0%) |
| 35 to 44 Years | 191 (82.3%) | 41 (17.7%) |
| 45 to 54 Years | 104 (96.3%) | 4 (3.7%) |
| 55 to 64 Years | 275 (100.0%) | 0 (0.0%) |
| 65 to 74 Years | 181 (100.0%) | 0 (0.0%) |
| 75 Years and older | 136 (100.0%) | 0 (0.0%) |
| Total | 1,499 (96.0%) | 62 (4.0%) |
Health Insurance Coverage by Citizenship Status in Hurley
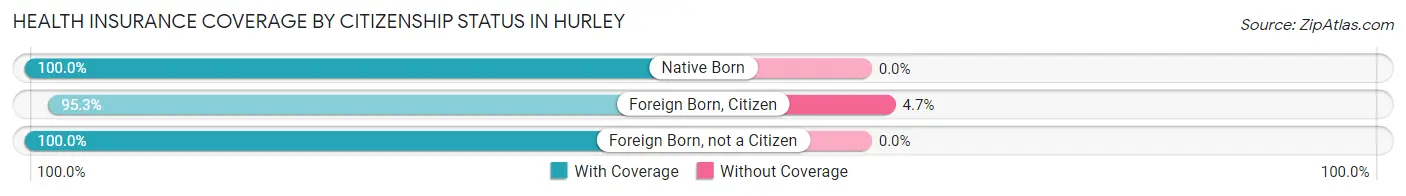
| Citizenship Status | With Coverage | Without Coverage |
| Native Born | 83 (100.0%) | 0 (0.0%) |
| Foreign Born, Citizen | 346 (95.3%) | 17 (4.7%) |
| Foreign Born, not a Citizen | 157 (100.0%) | 0 (0.0%) |
Health Insurance Coverage by Household Income in Hurley
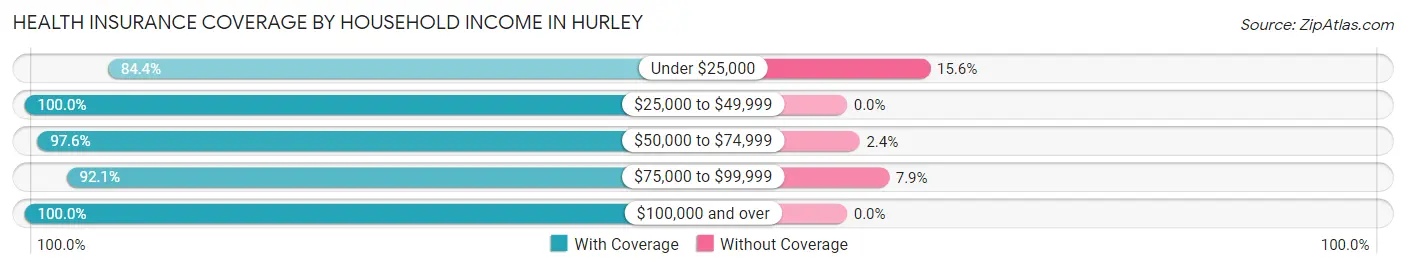
| Household Income | With Coverage | Without Coverage |
| Under $25,000 | 184 (84.4%) | 34 (15.6%) |
| $25,000 to $49,999 | 467 (100.0%) | 0 (0.0%) |
| $50,000 to $74,999 | 452 (97.6%) | 11 (2.4%) |
| $75,000 to $99,999 | 199 (92.1%) | 17 (7.9%) |
| $100,000 and over | 197 (100.0%) | 0 (0.0%) |
Public vs Private Health Insurance Coverage by Age in Hurley
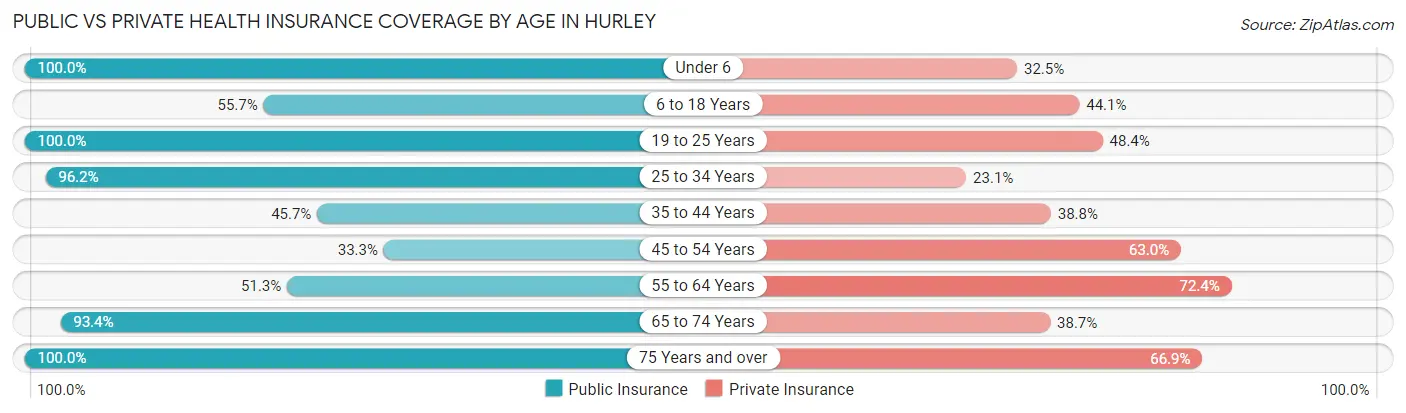
| Age Bracket | Public Insurance | Private Insurance |
| Under 6 | 83 (100.0%) | 27 (32.5%) |
| 6 to 18 Years | 202 (55.6%) | 160 (44.1%) |
| 19 to 25 Years | 157 (100.0%) | 76 (48.4%) |
| 25 to 34 Years | 25 (96.2%) | 6 (23.1%) |
| 35 to 44 Years | 106 (45.7%) | 90 (38.8%) |
| 45 to 54 Years | 36 (33.3%) | 68 (63.0%) |
| 55 to 64 Years | 141 (51.3%) | 199 (72.4%) |
| 65 to 74 Years | 169 (93.4%) | 70 (38.7%) |
| 75 Years and over | 136 (100.0%) | 91 (66.9%) |
| Total | 1,055 (67.6%) | 787 (50.4%) |
Disability Status by Sex by Age in Hurley
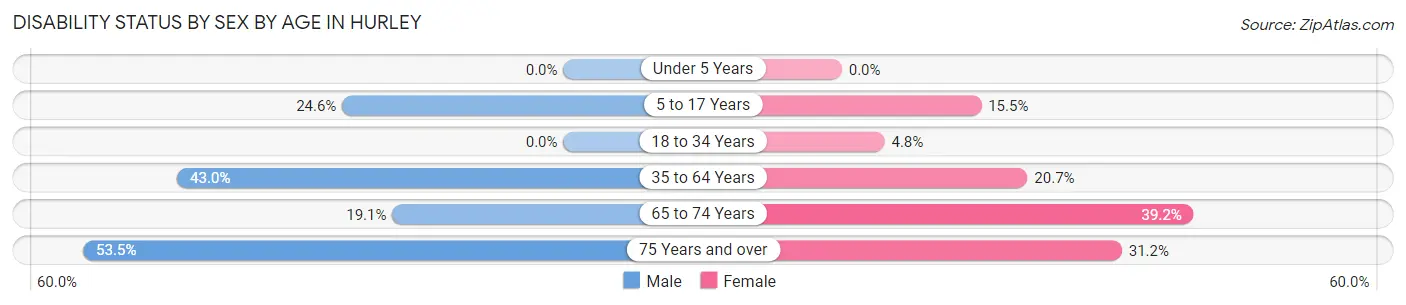
| Age Bracket | Male | Female |
| Under 5 Years | 0 (0.0%) | 0 (0.0%) |
| 5 to 17 Years | 66 (24.6%) | 16 (15.5%) |
| 18 to 34 Years | 0 (0.0%) | 5 (4.8%) |
| 35 to 64 Years | 123 (43.0%) | 68 (20.7%) |
| 65 to 74 Years | 16 (19.1%) | 38 (39.2%) |
| 75 Years and over | 23 (53.5%) | 29 (31.2%) |
Disability Class by Sex by Age in Hurley
Disability Class: Hearing Difficulty
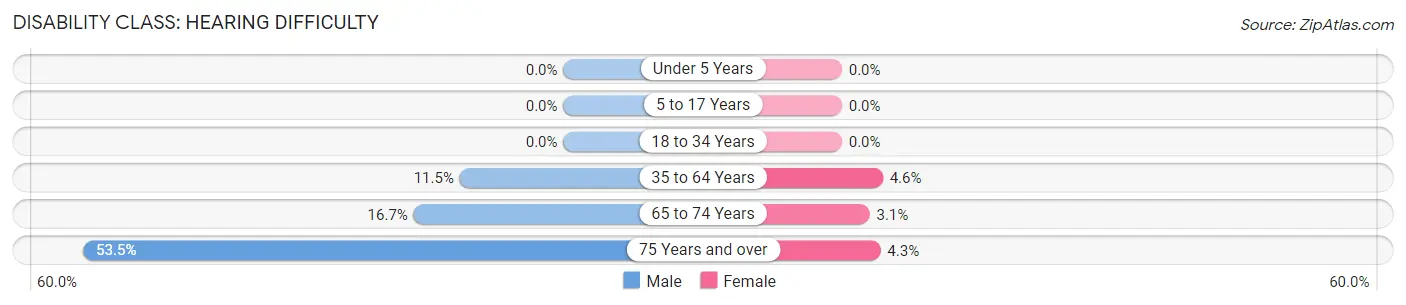
| Age Bracket | Male | Female |
| Under 5 Years | 0 (0.0%) | 0 (0.0%) |
| 5 to 17 Years | 0 (0.0%) | 0 (0.0%) |
| 18 to 34 Years | 0 (0.0%) | 0 (0.0%) |
| 35 to 64 Years | 33 (11.5%) | 15 (4.6%) |
| 65 to 74 Years | 14 (16.7%) | 3 (3.1%) |
| 75 Years and over | 23 (53.5%) | 4 (4.3%) |
Disability Class: Vision Difficulty
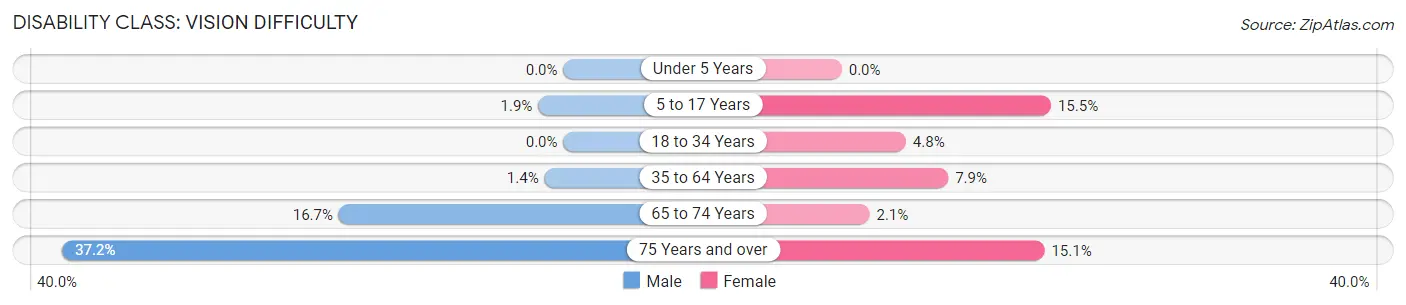
| Age Bracket | Male | Female |
| Under 5 Years | 0 (0.0%) | 0 (0.0%) |
| 5 to 17 Years | 5 (1.9%) | 16 (15.5%) |
| 18 to 34 Years | 0 (0.0%) | 5 (4.8%) |
| 35 to 64 Years | 4 (1.4%) | 26 (7.9%) |
| 65 to 74 Years | 14 (16.7%) | 2 (2.1%) |
| 75 Years and over | 16 (37.2%) | 14 (15.0%) |
Disability Class: Cognitive Difficulty
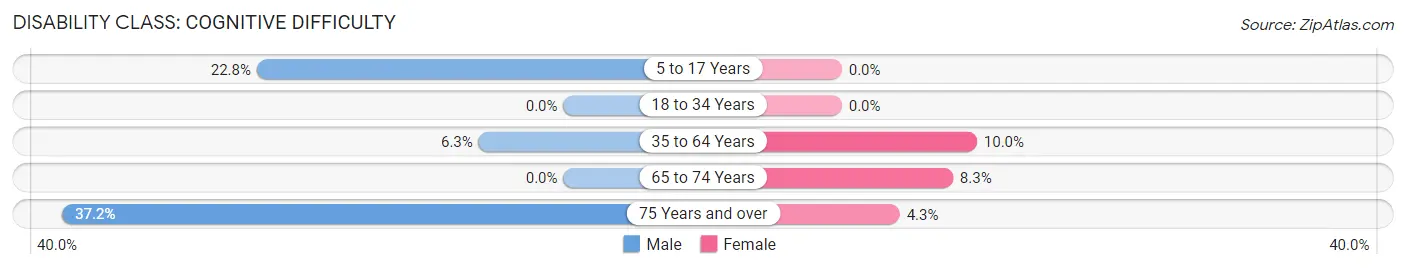
| Age Bracket | Male | Female |
| 5 to 17 Years | 61 (22.8%) | 0 (0.0%) |
| 18 to 34 Years | 0 (0.0%) | 0 (0.0%) |
| 35 to 64 Years | 18 (6.3%) | 33 (10.0%) |
| 65 to 74 Years | 0 (0.0%) | 8 (8.3%) |
| 75 Years and over | 16 (37.2%) | 4 (4.3%) |
Disability Class: Ambulatory Difficulty
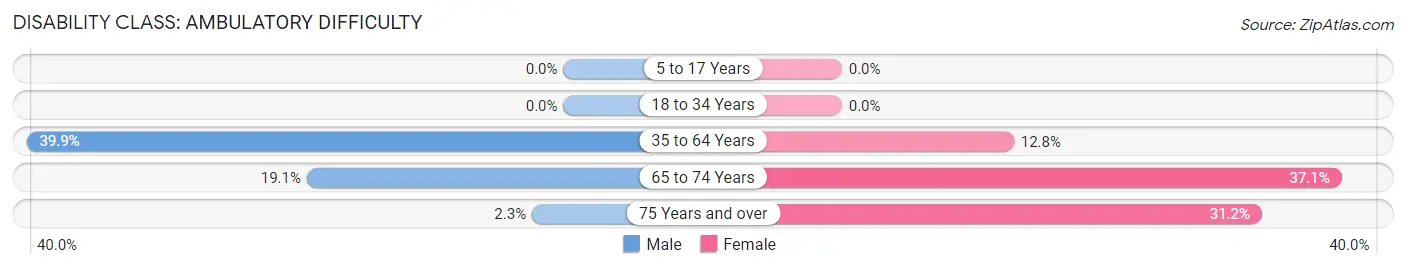
| Age Bracket | Male | Female |
| 5 to 17 Years | 0 (0.0%) | 0 (0.0%) |
| 18 to 34 Years | 0 (0.0%) | 0 (0.0%) |
| 35 to 64 Years | 114 (39.9%) | 42 (12.8%) |
| 65 to 74 Years | 16 (19.1%) | 36 (37.1%) |
| 75 Years and over | 1 (2.3%) | 29 (31.2%) |
Disability Class: Self-Care Difficulty
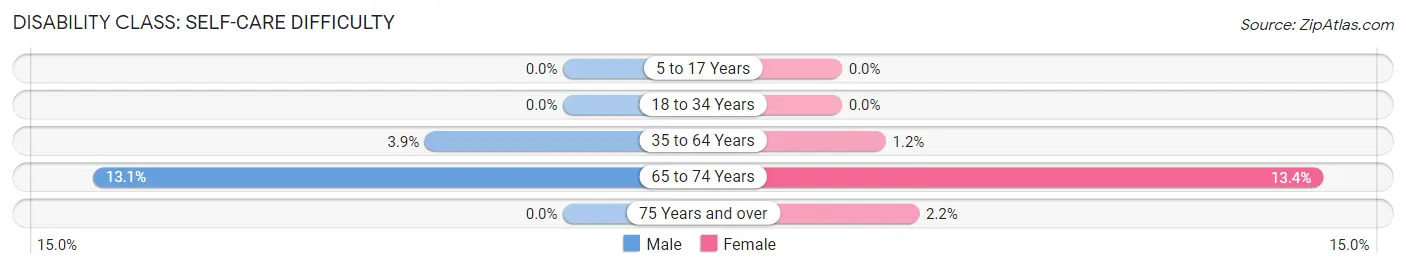
| Age Bracket | Male | Female |
| 5 to 17 Years | 0 (0.0%) | 0 (0.0%) |
| 18 to 34 Years | 0 (0.0%) | 0 (0.0%) |
| 35 to 64 Years | 11 (3.8%) | 4 (1.2%) |
| 65 to 74 Years | 11 (13.1%) | 13 (13.4%) |
| 75 Years and over | 0 (0.0%) | 2 (2.1%) |
Technology Access in Hurley
Computing Device Access in Hurley
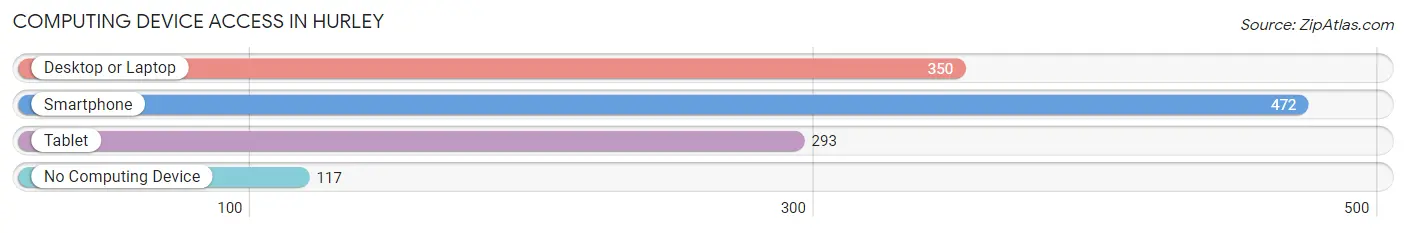
| Device Type | # Households | % Households |
| Desktop or Laptop | 350 | 55.5% |
| Smartphone | 472 | 74.8% |
| Tablet | 293 | 46.4% |
| No Computing Device | 117 | 18.5% |
| Total | 631 | 100.0% |
Internet Access in Hurley
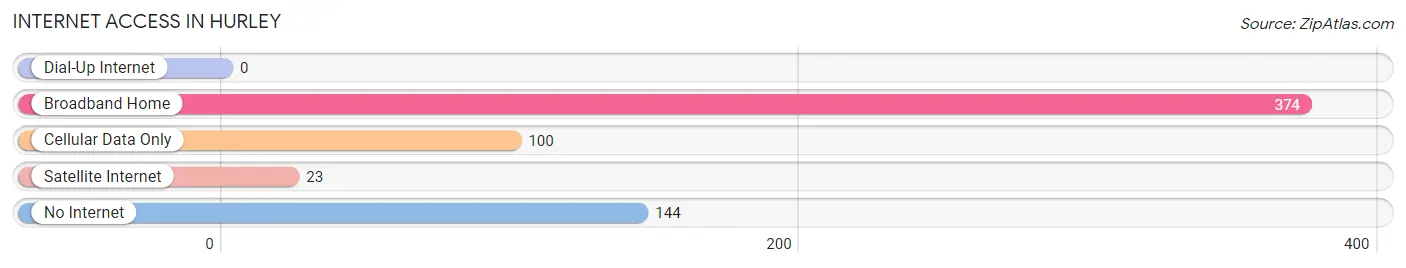
| Internet Type | # Households | % Households |
| Dial-Up Internet | 0 | 0.0% |
| Broadband Home | 374 | 59.3% |
| Cellular Data Only | 100 | 15.9% |
| Satellite Internet | 23 | 3.6% |
| No Internet | 144 | 22.8% |
| Total | 631 | 100.0% |
Hurley Summary
Hurley, New Mexico is a small town located in the southwestern part of the state, about 20 miles south of Silver City. It is situated in the foothills of the Gila National Forest, and is surrounded by the Gila River and its tributaries. The town has a population of about 1,500 people, and is the county seat of Grant County.
History
Hurley was founded in 1881 by a group of miners who were looking for gold in the area. The town was named after one of the miners, William Hurley, who was the first to discover gold in the area. The town quickly grew, and by the early 1900s, it had become a bustling mining town with a population of over 1,000 people.
The town was also home to a number of businesses, including a hotel, a bank, a post office, and several stores. The town was also home to a number of saloons, which were popular with the miners.
In the early 1900s, the town began to decline as the gold rush ended and the mines closed. The population dropped to about 500 people by the 1950s.
Geography
Hurley is located in the southwestern part of New Mexico, about 20 miles south of Silver City. It is situated in the foothills of the Gila National Forest, and is surrounded by the Gila River and its tributaries. The town is located at an elevation of 4,800 feet above sea level.
The climate in Hurley is semi-arid, with hot summers and mild winters. The average annual temperature is about 65 degrees Fahrenheit, and the average annual precipitation is about 12 inches.
Economy
The economy of Hurley is largely based on agriculture and tourism. The town is home to a number of farms, which produce a variety of crops, including alfalfa, corn, and wheat. The town is also home to a number of tourist attractions, including the Gila Cliff Dwellings National Monument, the Gila National Forest, and the Gila River.
The town is also home to a number of businesses, including restaurants, hotels, and stores. The town is also home to a number of manufacturing companies, which produce a variety of products, including furniture, clothing, and electronics.
Demographics
As of the 2010 census, the population of Hurley was 1,521 people. The racial makeup of the town was 94.3% White, 0.7% African American, 0.7% Native American, 0.2% Asian, 0.1% Pacific Islander, 2.2% from other races, and 1.9% from two or more races. Hispanic or Latino of any race were 8.2% of the population.
The median household income in Hurley was $30,938, and the median family income was $35,625. The per capita income in Hurley was $15,945. About 17.2% of the population was below the poverty line.
Common Questions
What is Per Capita Income in Hurley?
Per Capita income in Hurley is $20,940.
What is the Median Family Income in Hurley?
Median Family Income in Hurley is $52,348.
What is the Median Household income in Hurley?
Median Household Income in Hurley is $39,313.
What is Income or Wage Gap in Hurley?
Income or Wage Gap in Hurley is 41.6%.
Women in Hurley earn 58.4 cents for every dollar earned by a man.
What is Inequality or Gini Index in Hurley?
Inequality or Gini Index in Hurley is 0.38.
What is the Total Population of Hurley?
Total Population of Hurley is 1,561.
What is the Total Male Population of Hurley?
Total Male Population of Hurley is 824.
What is the Total Female Population of Hurley?
Total Female Population of Hurley is 737.
What is the Ratio of Males per 100 Females in Hurley?
There are 111.80 Males per 100 Females in Hurley.
What is the Ratio of Females per 100 Males in Hurley?
There are 89.44 Females per 100 Males in Hurley.
What is the Median Population Age in Hurley?
Median Population Age in Hurley is 42.5 Years.
What is the Average Family Size in Hurley
Average Family Size in Hurley is 3.5 People.
What is the Average Household Size in Hurley
Average Household Size in Hurley is 2.5 People.
How Large is the Labor Force in Hurley?
There are 675 People in the Labor Forcein in Hurley.
What is the Percentage of People in the Labor Force in Hurley?
58.2% of People are in the Labor Force in Hurley.
What is the Unemployment Rate in Hurley?
Unemployment Rate in Hurley is 5.9%.