Sanostee, NM Map & Demographics
Sanostee Map
Sanostee Overview
$15,376
PER CAPITA INCOME
$44,167
AVG FAMILY INCOME
$26,875
AVG HOUSEHOLD INCOME
50.6%
WAGE / INCOME GAP [ % ]
49.4¢/ $1
WAGE / INCOME GAP [ $ ]
0.43
INEQUALITY / GINI INDEX
276
TOTAL POPULATION
142
MALE POPULATION
134
FEMALE POPULATION
105.97
MALES / 100 FEMALES
94.37
FEMALES / 100 MALES
45.8
MEDIAN AGE
3.8
AVG FAMILY SIZE
3.1
AVG HOUSEHOLD SIZE
65
LABOR FORCE [ PEOPLE ]
27.0%
PERCENT IN LABOR FORCE
9.2%
UNEMPLOYMENT RATE
Sanostee Zip Codes
Sanostee Area Codes
Income in Sanostee
Income Overview in Sanostee
Per Capita Income in Sanostee is $15,376, while median incomes of families and households are $44,167 and $26,875 respectively.
| Characteristic | Number | Measure |
| Per Capita Income | 276 | $15,376 |
| Median Family Income | 60 | $44,167 |
| Mean Family Income | 60 | $46,803 |
| Median Household Income | 89 | $26,875 |
| Mean Household Income | 89 | $38,800 |
| Income Deficit | 60 | $0 |
| Wage / Income Gap (%) | 276 | 50.63% |
| Wage / Income Gap ($) | 276 | 49.37¢ per $1 |
| Gini / Inequality Index | 276 | 0.43 |
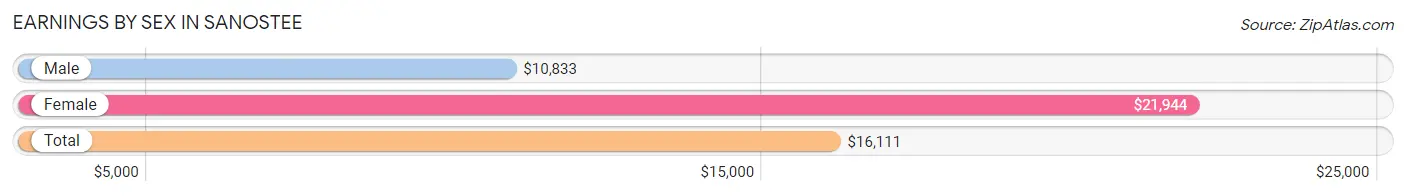
Earnings by Sex in Sanostee
Average Earnings in Sanostee are $16,111, $10,833 for men and $21,944 for women, a difference of 50.6%.
| Sex | Number | Average Earnings |
| Male | 42 (47.7%) | $10,833 |
| Female | 46 (52.3%) | $21,944 |
| Total | 88 (100.0%) | $16,111 |
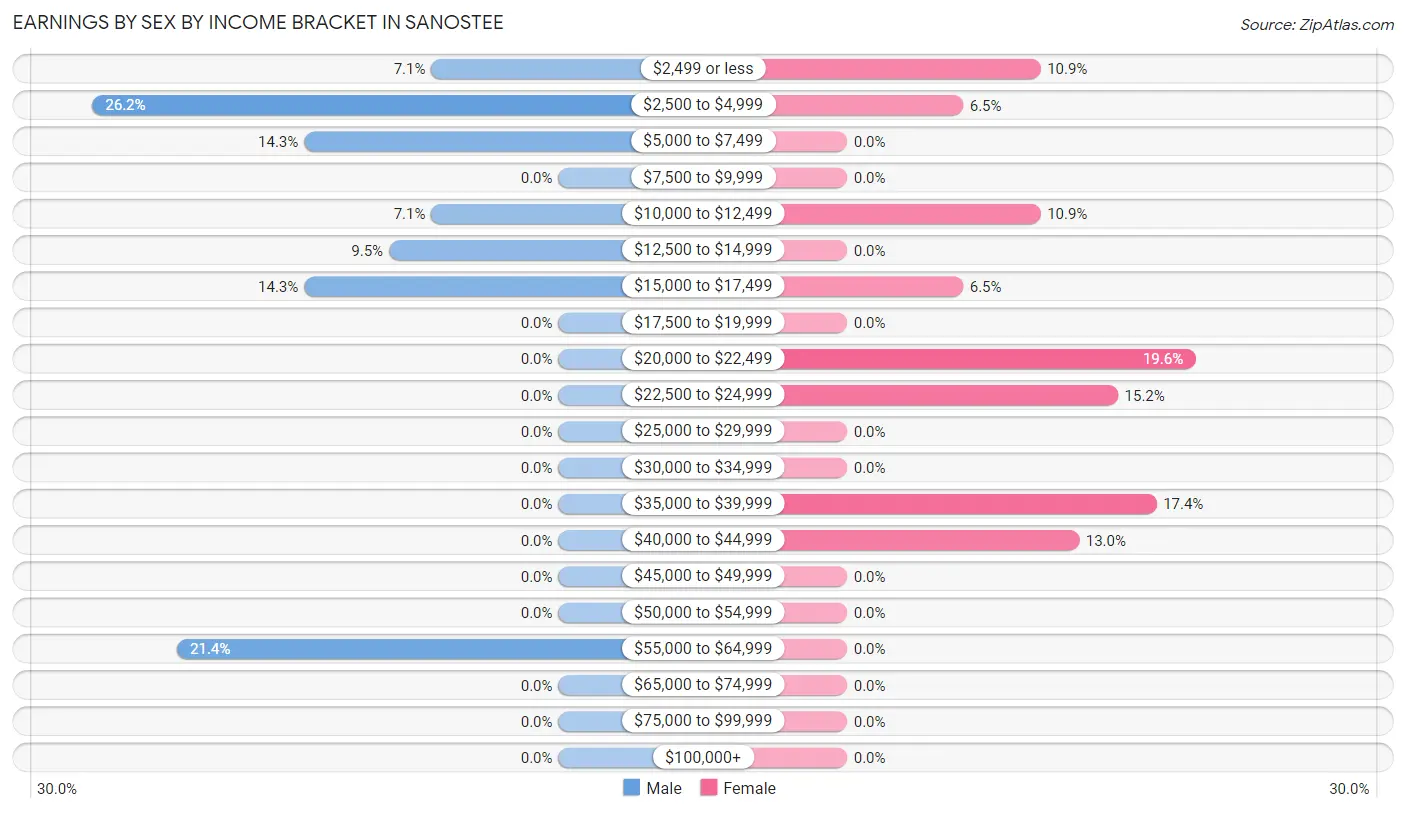
Earnings by Sex by Income Bracket in Sanostee
The most common earnings brackets in Sanostee are $2,500 to $4,999 for men (11 | 26.2%) and $20,000 to $22,499 for women (9 | 19.6%).
| Income | Male | Female |
| $2,499 or less | 3 (7.1%) | 5 (10.9%) |
| $2,500 to $4,999 | 11 (26.2%) | 3 (6.5%) |
| $5,000 to $7,499 | 6 (14.3%) | 0 (0.0%) |
| $7,500 to $9,999 | 0 (0.0%) | 0 (0.0%) |
| $10,000 to $12,499 | 3 (7.1%) | 5 (10.9%) |
| $12,500 to $14,999 | 4 (9.5%) | 0 (0.0%) |
| $15,000 to $17,499 | 6 (14.3%) | 3 (6.5%) |
| $17,500 to $19,999 | 0 (0.0%) | 0 (0.0%) |
| $20,000 to $22,499 | 0 (0.0%) | 9 (19.6%) |
| $22,500 to $24,999 | 0 (0.0%) | 7 (15.2%) |
| $25,000 to $29,999 | 0 (0.0%) | 0 (0.0%) |
| $30,000 to $34,999 | 0 (0.0%) | 0 (0.0%) |
| $35,000 to $39,999 | 0 (0.0%) | 8 (17.4%) |
| $40,000 to $44,999 | 0 (0.0%) | 6 (13.0%) |
| $45,000 to $49,999 | 0 (0.0%) | 0 (0.0%) |
| $50,000 to $54,999 | 0 (0.0%) | 0 (0.0%) |
| $55,000 to $64,999 | 9 (21.4%) | 0 (0.0%) |
| $65,000 to $74,999 | 0 (0.0%) | 0 (0.0%) |
| $75,000 to $99,999 | 0 (0.0%) | 0 (0.0%) |
| $100,000+ | 0 (0.0%) | 0 (0.0%) |
| Total | 42 (100.0%) | 46 (100.0%) |
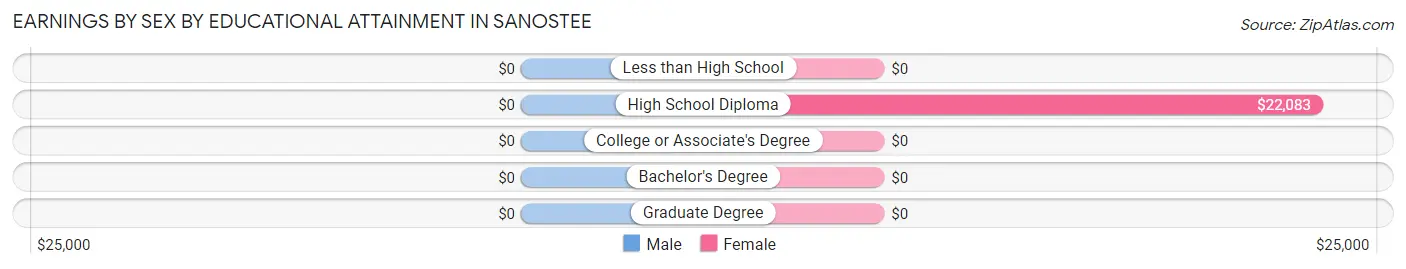
Earnings by Sex by Educational Attainment in Sanostee
| Educational Attainment | Male Income | Female Income |
| Less than High School | - | - |
| High School Diploma | - | - |
| College or Associate's Degree | - | - |
| Bachelor's Degree | - | - |
| Graduate Degree | - | - |
| Total | $13,125 | $22,679 |
Family Income in Sanostee
Family Income Brackets in Sanostee
According to the Sanostee family income data, there are 21 families falling into the $50,000 to $74,999 income range, which is the most common income bracket and makes up 35.0% of all families.
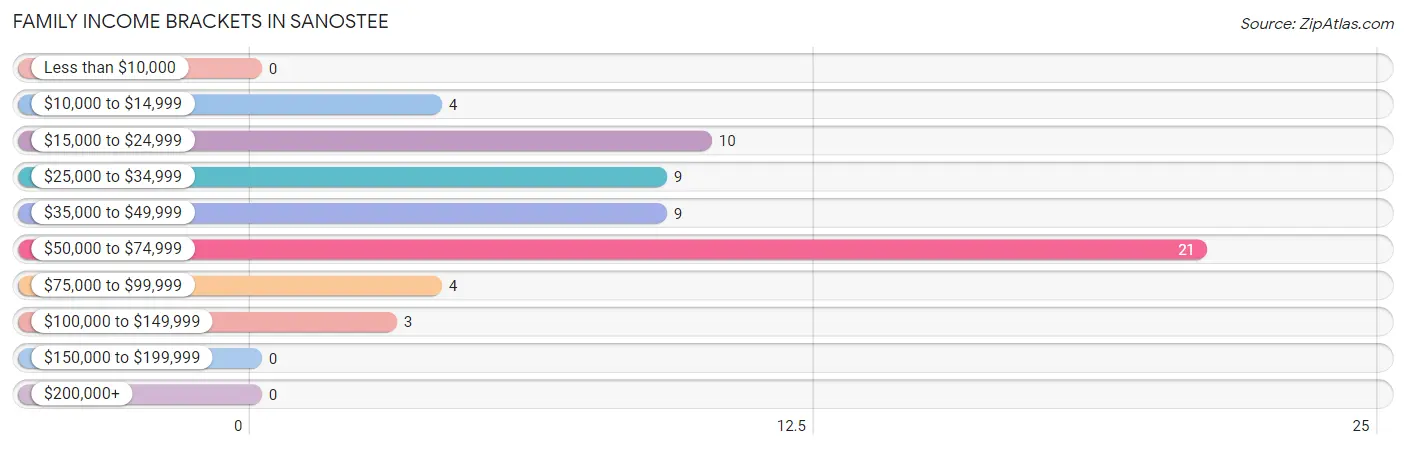
| Income Bracket | # Families | % Families |
| Less than $10,000 | 0 | 0.0% |
| $10,000 to $14,999 | 4 | 6.7% |
| $15,000 to $24,999 | 10 | 16.7% |
| $25,000 to $34,999 | 9 | 15.0% |
| $35,000 to $49,999 | 9 | 15.0% |
| $50,000 to $74,999 | 21 | 35.0% |
| $75,000 to $99,999 | 4 | 6.7% |
| $100,000 to $149,999 | 3 | 5.0% |
| $150,000 to $199,999 | 0 | 0.0% |
| $200,000+ | 0 | 0.0% |
Family Income by Famaliy Size in Sanostee
4-person families (12 | 20.0%) account for the highest median family income in Sanostee with $56,250 per family, while 2-person families (28 | 46.7%) have the highest median income of $22,292 per family member.
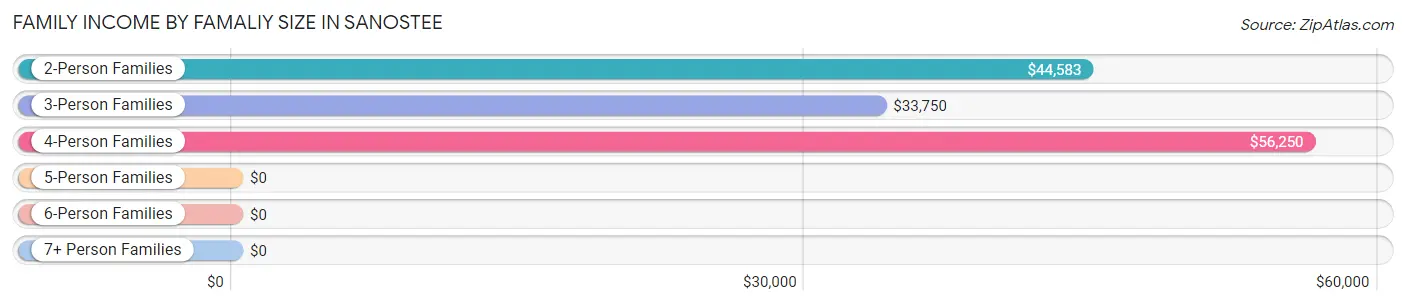
| Income Bracket | # Families | Median Income |
| 2-Person Families | 28 (46.7%) | $44,583 |
| 3-Person Families | 11 (18.3%) | $33,750 |
| 4-Person Families | 12 (20.0%) | $56,250 |
| 5-Person Families | 0 (0.0%) | $0 |
| 6-Person Families | 9 (15.0%) | $0 |
| 7+ Person Families | 0 (0.0%) | $0 |
| Total | 60 (100.0%) | $44,167 |
Family Income by Number of Earners in Sanostee
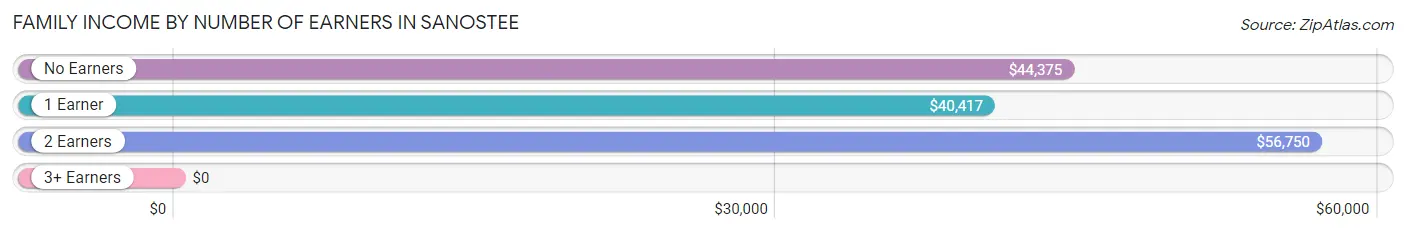
| Number of Earners | # Families | Median Income |
| No Earners | 24 (40.0%) | $44,375 |
| 1 Earner | 21 (35.0%) | $40,417 |
| 2 Earners | 15 (25.0%) | $56,750 |
| 3+ Earners | 0 (0.0%) | $0 |
| Total | 60 (100.0%) | $44,167 |
Household Income in Sanostee
Household Income Brackets in Sanostee
With 20 households falling in the category, the $15,000 to $24,999 income range is the most frequent in Sanostee, accounting for 22.5% of all households.
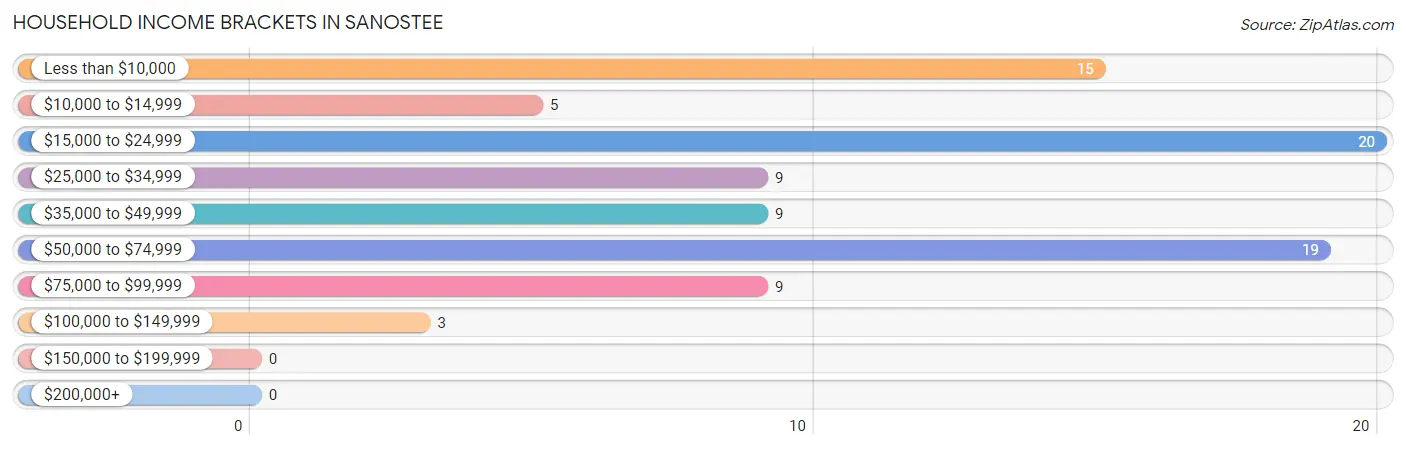
| Income Bracket | # Households | % Households |
| Less than $10,000 | 15 | 16.9% |
| $10,000 to $14,999 | 5 | 5.6% |
| $15,000 to $24,999 | 20 | 22.5% |
| $25,000 to $34,999 | 9 | 10.1% |
| $35,000 to $49,999 | 9 | 10.1% |
| $50,000 to $74,999 | 19 | 21.3% |
| $75,000 to $99,999 | 9 | 10.1% |
| $100,000 to $149,999 | 3 | 3.4% |
| $150,000 to $199,999 | 0 | 0.0% |
| $200,000+ | 0 | 0.0% |
Household Income by Householder Age in Sanostee
The median household income in Sanostee is $26,875, with the highest median household income of $43,125 found in the 45 to 64 years age bracket for the primary householder. A total of 51 households (57.3%) fall into this category.
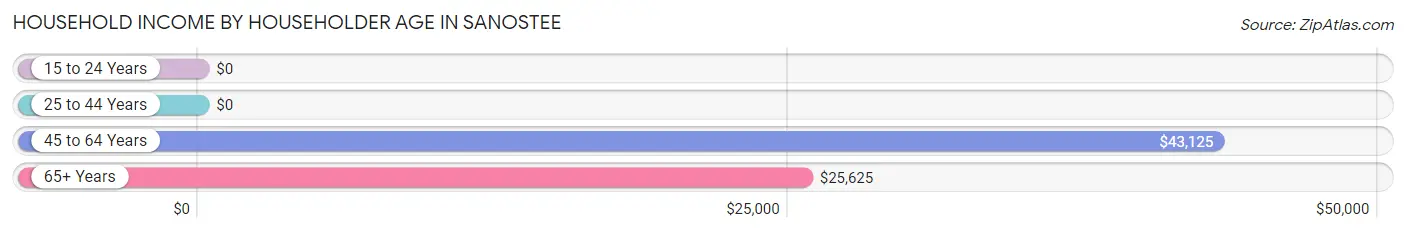
| Income Bracket | # Households | Median Income |
| 15 to 24 Years | 0 (0.0%) | $0 |
| 25 to 44 Years | 7 (7.9%) | $0 |
| 45 to 64 Years | 51 (57.3%) | $43,125 |
| 65+ Years | 31 (34.8%) | $25,625 |
| Total | 89 (100.0%) | $26,875 |
Poverty in Sanostee
Income Below Poverty by Sex and Age in Sanostee
With 25.4% poverty level for males and 33.6% for females among the residents of Sanostee, 75 year old and over males and under 5 year old females are the most vulnerable to poverty, with 3 males (100.0%) and 4 females (100.0%) in their respective age groups living below the poverty level.
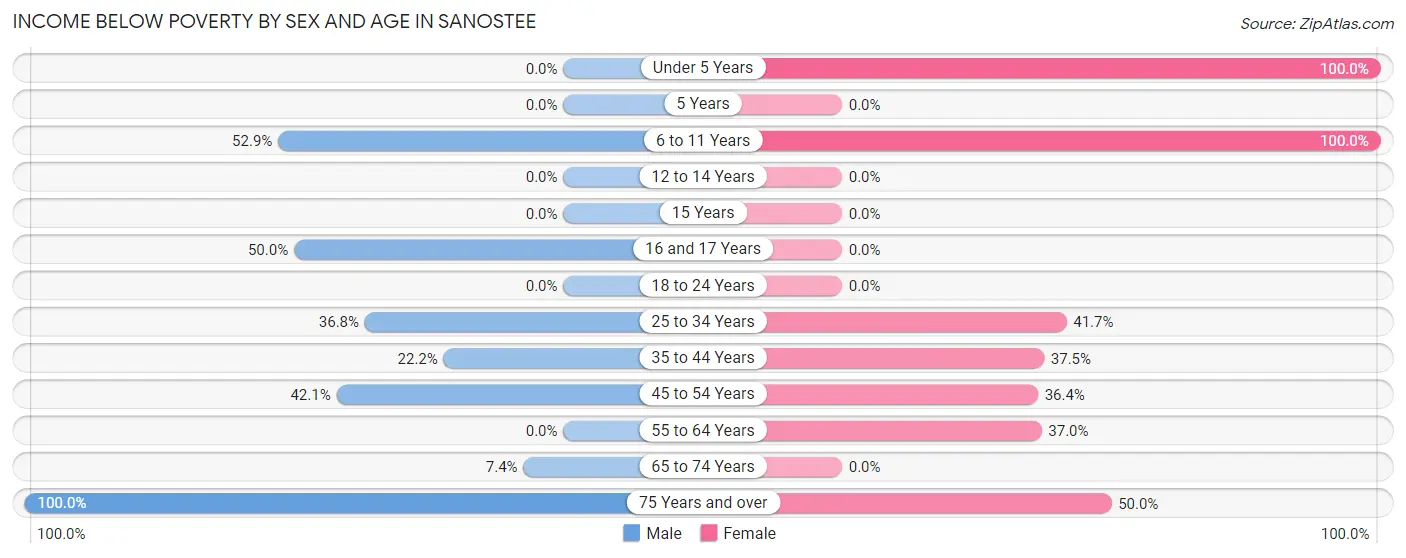
| Age Bracket | Male | Female |
| Under 5 Years | 0 (0.0%) | 4 (100.0%) |
| 5 Years | 0 (0.0%) | 0 (0.0%) |
| 6 to 11 Years | 9 (52.9%) | 7 (100.0%) |
| 12 to 14 Years | 0 (0.0%) | 0 (0.0%) |
| 15 Years | 0 (0.0%) | 0 (0.0%) |
| 16 and 17 Years | 3 (50.0%) | 0 (0.0%) |
| 18 to 24 Years | 0 (0.0%) | 0 (0.0%) |
| 25 to 34 Years | 7 (36.8%) | 10 (41.7%) |
| 35 to 44 Years | 4 (22.2%) | 3 (37.5%) |
| 45 to 54 Years | 8 (42.1%) | 8 (36.4%) |
| 55 to 64 Years | 0 (0.0%) | 10 (37.0%) |
| 65 to 74 Years | 2 (7.4%) | 0 (0.0%) |
| 75 Years and over | 3 (100.0%) | 3 (50.0%) |
| Total | 36 (25.4%) | 45 (33.6%) |
Income Above Poverty by Sex and Age in Sanostee
According to the poverty statistics in Sanostee, males aged 12 to 14 years and females aged 12 to 14 years are the age groups that are most secure financially, with 100.0% of males and 100.0% of females in these age groups living above the poverty line.
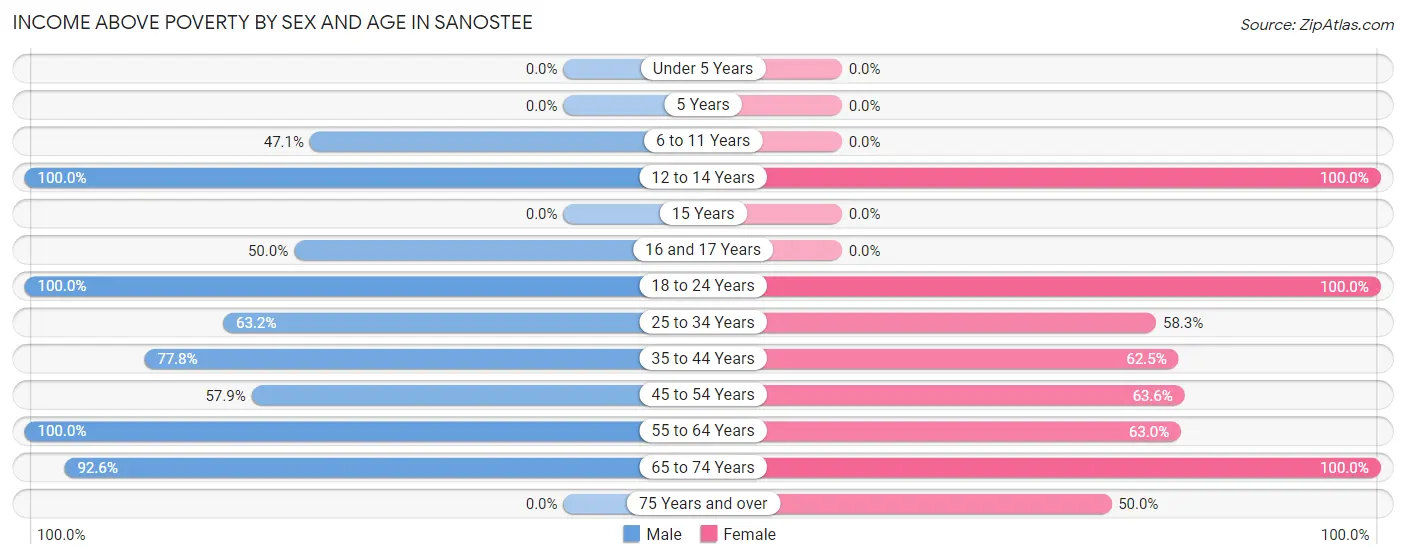
| Age Bracket | Male | Female |
| Under 5 Years | 0 (0.0%) | 0 (0.0%) |
| 5 Years | 0 (0.0%) | 0 (0.0%) |
| 6 to 11 Years | 8 (47.1%) | 0 (0.0%) |
| 12 to 14 Years | 4 (100.0%) | 3 (100.0%) |
| 15 Years | 0 (0.0%) | 0 (0.0%) |
| 16 and 17 Years | 3 (50.0%) | 0 (0.0%) |
| 18 to 24 Years | 8 (100.0%) | 14 (100.0%) |
| 25 to 34 Years | 12 (63.2%) | 14 (58.3%) |
| 35 to 44 Years | 14 (77.8%) | 5 (62.5%) |
| 45 to 54 Years | 11 (57.9%) | 14 (63.6%) |
| 55 to 64 Years | 21 (100.0%) | 17 (63.0%) |
| 65 to 74 Years | 25 (92.6%) | 19 (100.0%) |
| 75 Years and over | 0 (0.0%) | 3 (50.0%) |
| Total | 106 (74.7%) | 89 (66.4%) |
Income Below Poverty Among Married-Couple Families in Sanostee
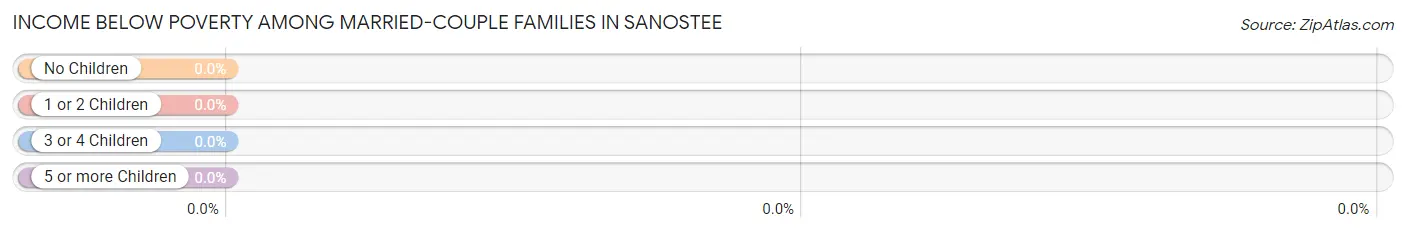
| Children | Above Poverty | Below Poverty |
| No Children | 23 (100.0%) | 0 (0.0%) |
| 1 or 2 Children | 8 (100.0%) | 0 (0.0%) |
| 3 or 4 Children | 0 (0.0%) | 0 (0.0%) |
| 5 or more Children | 0 (0.0%) | 0 (0.0%) |
| Total | 31 (100.0%) | 0 (0.0%) |
Income Below Poverty Among Single-Parent Households in Sanostee
According to the poverty data in Sanostee, 100.0% or 4 single-father households and 28.0% or 7 single-mother households are living below the poverty line. Among single-father households, those with 1 or 2 children have the highest poverty rate, with 4 households (100.0%) experiencing poverty. Likewise, among single-mother households, those with 3 or 4 children have the highest poverty rate, with 4 households (100.0%) falling below the poverty line.
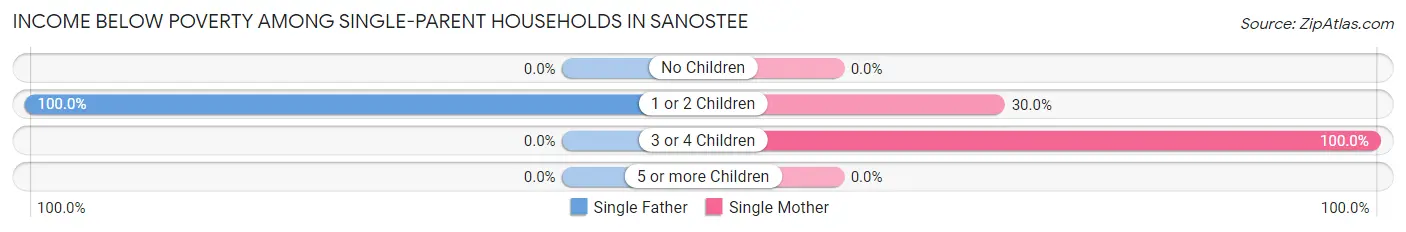
| Children | Single Father | Single Mother |
| No Children | 0 (0.0%) | 0 (0.0%) |
| 1 or 2 Children | 4 (100.0%) | 3 (30.0%) |
| 3 or 4 Children | 0 (0.0%) | 4 (100.0%) |
| 5 or more Children | 0 (0.0%) | 0 (0.0%) |
| Total | 4 (100.0%) | 7 (28.0%) |
Income Below Poverty Among Married-Couple vs Single-Parent Households in Sanostee
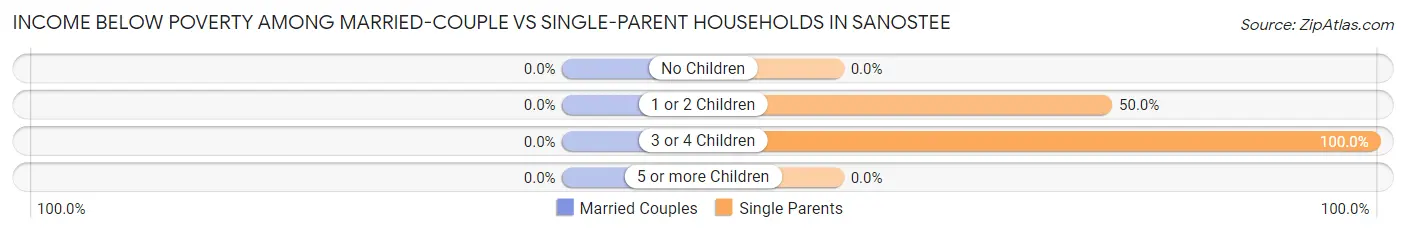
| Children | Married-Couple Families | Single-Parent Households |
| No Children | 0 (0.0%) | 0 (0.0%) |
| 1 or 2 Children | 0 (0.0%) | 7 (50.0%) |
| 3 or 4 Children | 0 (0.0%) | 4 (100.0%) |
| 5 or more Children | 0 (0.0%) | 0 (0.0%) |
| Total | 0 (0.0%) | 11 (37.9%) |
Race in Sanostee
The most populous races in Sanostee are , and Native / Alaskan (276 | 100.0%).
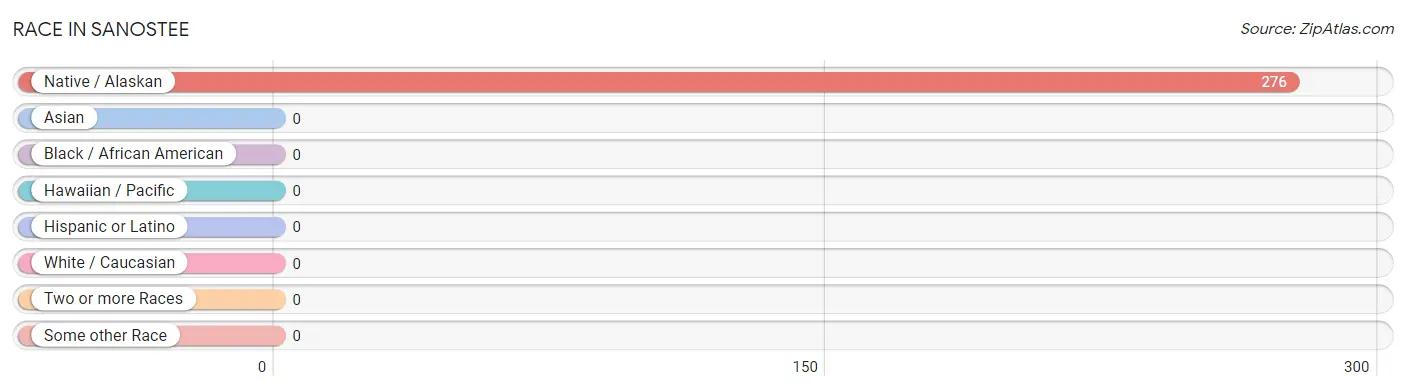
| Race | # Population | % Population |
| Asian | 0 | 0.0% |
| Black / African American | 0 | 0.0% |
| Hawaiian / Pacific | 0 | 0.0% |
| Hispanic or Latino | 0 | 0.0% |
| Native / Alaskan | 276 | 100.0% |
| White / Caucasian | 0 | 0.0% |
| Two or more Races | 0 | 0.0% |
| Some other Race | 0 | 0.0% |
| Total | 276 | 100.0% |
Ancestry in Sanostee
The most populous ancestries reported in Sanostee are Navajo (269 | 97.5%), and Apache (7 | 2.5%), together accounting for 100.0% of all Sanostee residents.
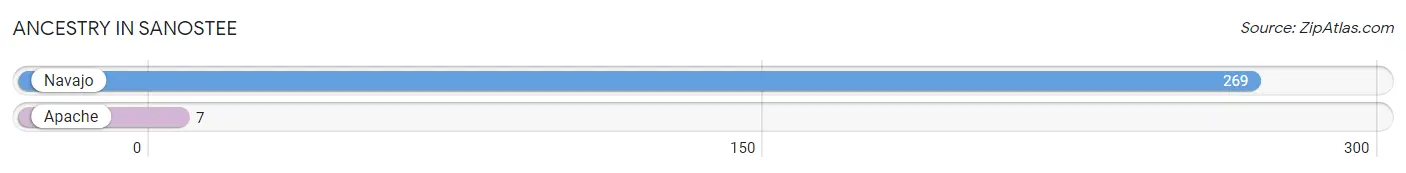
| Ancestry | # Population | % Population |
| Apache | 7 | 2.5% |
| Navajo | 269 | 97.5% | View All 2 Rows |
Immigrants in Sanostee

| Immigration Origin | # Population | % Population | View All 0 Rows |
Sex and Age in Sanostee
Sex and Age in Sanostee
The most populous age groups in Sanostee are 65 to 69 Years (22 | 15.5%) for men and 60 to 64 Years (21 | 15.7%) for women.
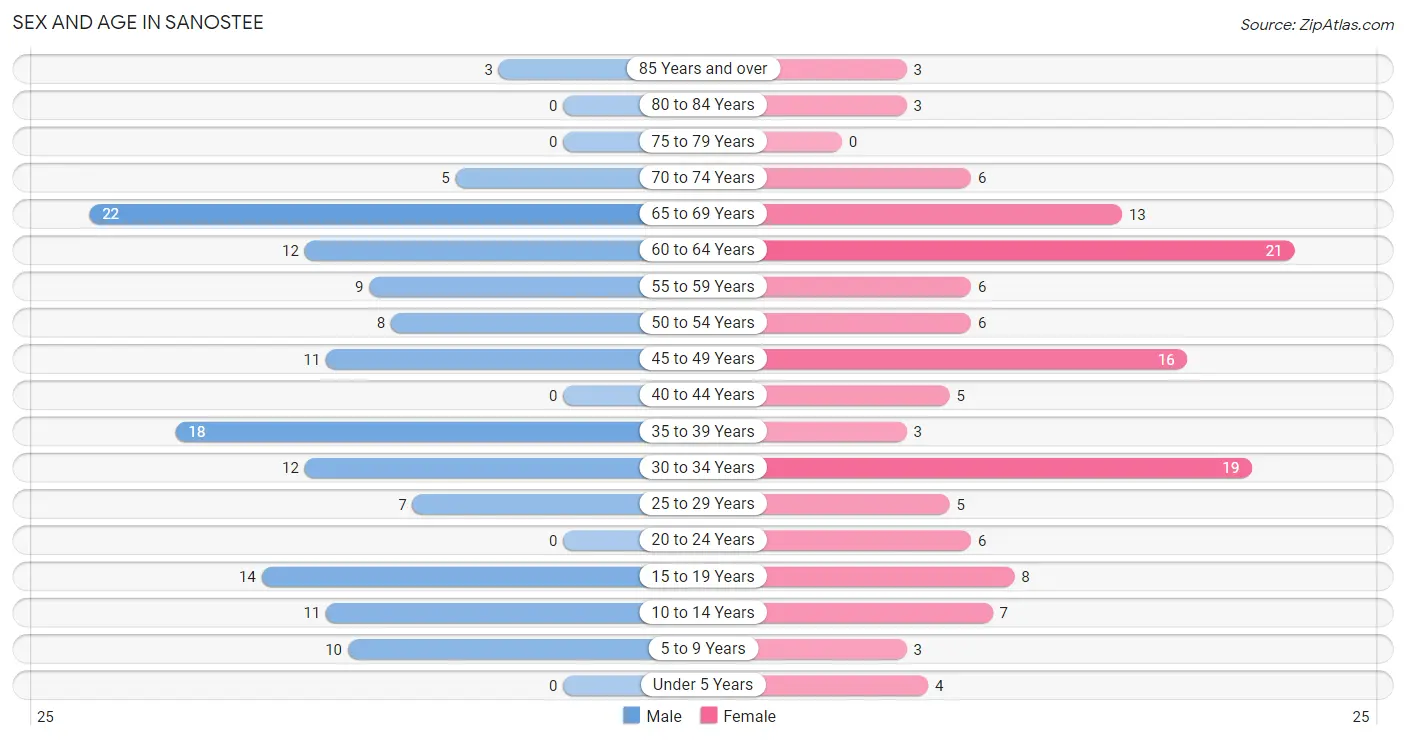
| Age Bracket | Male | Female |
| Under 5 Years | 0 (0.0%) | 4 (3.0%) |
| 5 to 9 Years | 10 (7.0%) | 3 (2.2%) |
| 10 to 14 Years | 11 (7.7%) | 7 (5.2%) |
| 15 to 19 Years | 14 (9.9%) | 8 (6.0%) |
| 20 to 24 Years | 0 (0.0%) | 6 (4.5%) |
| 25 to 29 Years | 7 (4.9%) | 5 (3.7%) |
| 30 to 34 Years | 12 (8.5%) | 19 (14.2%) |
| 35 to 39 Years | 18 (12.7%) | 3 (2.2%) |
| 40 to 44 Years | 0 (0.0%) | 5 (3.7%) |
| 45 to 49 Years | 11 (7.7%) | 16 (11.9%) |
| 50 to 54 Years | 8 (5.6%) | 6 (4.5%) |
| 55 to 59 Years | 9 (6.3%) | 6 (4.5%) |
| 60 to 64 Years | 12 (8.5%) | 21 (15.7%) |
| 65 to 69 Years | 22 (15.5%) | 13 (9.7%) |
| 70 to 74 Years | 5 (3.5%) | 6 (4.5%) |
| 75 to 79 Years | 0 (0.0%) | 0 (0.0%) |
| 80 to 84 Years | 0 (0.0%) | 3 (2.2%) |
| 85 Years and over | 3 (2.1%) | 3 (2.2%) |
| Total | 142 (100.0%) | 134 (100.0%) |
Families and Households in Sanostee
Median Family Size in Sanostee
The median family size in Sanostee is 3.80 persons per family, with married-couple families (31 | 51.7%) accounting for the largest median family size of 3.97 persons per family. On the other hand, single male/father families (4 | 6.7%) represent the smallest median family size with 2.50 persons per family.
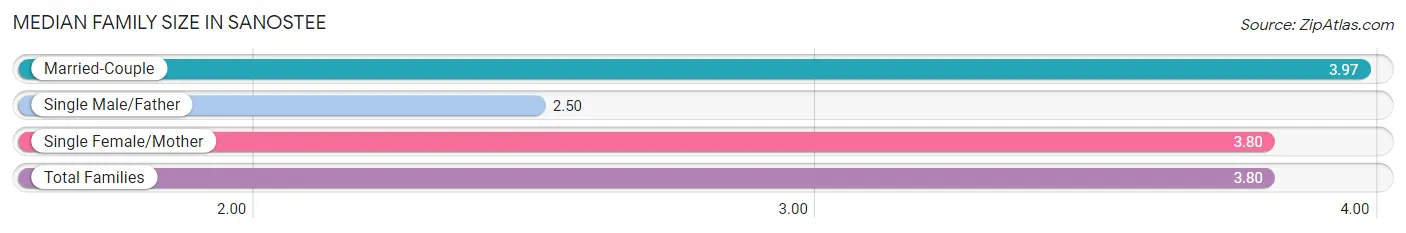
| Family Type | # Families | Family Size |
| Married-Couple | 31 (51.7%) | 3.97 |
| Single Male/Father | 4 (6.7%) | 2.50 |
| Single Female/Mother | 25 (41.7%) | 3.80 |
| Total Families | 60 (100.0%) | 3.80 |
Median Household Size in Sanostee
The median household size in Sanostee is 3.10 persons per household, with married-couple households (31 | 34.8%) accounting for the largest median household size of 4.13 persons per household. non-family households (29 | 32.6%) represent the smallest median household size with 1.24 persons per household.
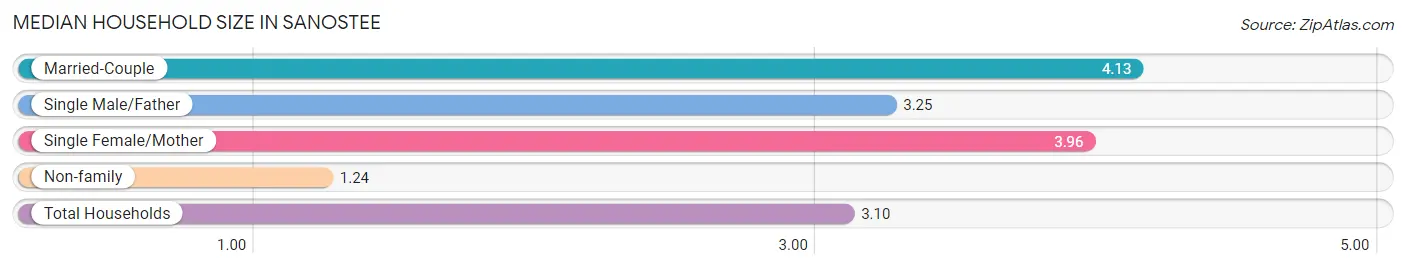
| Household Type | # Households | Household Size |
| Married-Couple | 31 (34.8%) | 4.13 |
| Single Male/Father | 4 (4.5%) | 3.25 |
| Single Female/Mother | 25 (28.1%) | 3.96 |
| Non-family | 29 (32.6%) | 1.24 |
| Total Households | 89 (100.0%) | 3.10 |
Household Size by Marriage Status in Sanostee
Out of a total of 89 households in Sanostee, 60 (67.4%) are family households, while 29 (32.6%) are nonfamily households. The most numerous type of family households are 2-person households, comprising 25, and the most common type of nonfamily households are 1-person households, comprising 23.
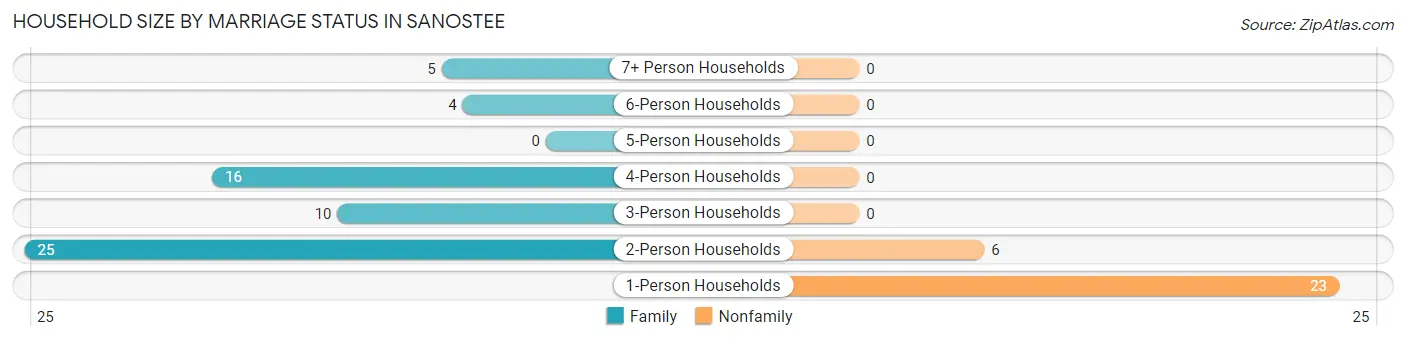
| Household Size | Family Households | Nonfamily Households |
| 1-Person Households | - | 23 (25.8%) |
| 2-Person Households | 25 (28.1%) | 6 (6.7%) |
| 3-Person Households | 10 (11.2%) | 0 (0.0%) |
| 4-Person Households | 16 (18.0%) | 0 (0.0%) |
| 5-Person Households | 0 (0.0%) | 0 (0.0%) |
| 6-Person Households | 4 (4.5%) | 0 (0.0%) |
| 7+ Person Households | 5 (5.6%) | 0 (0.0%) |
| Total | 60 (67.4%) | 29 (32.6%) |
Female Fertility in Sanostee
Fertility by Age in Sanostee
| Age Bracket | Women with Births | Births / 1,000 Women |
| 15 to 19 years | 0 (0.0%) | 0.0 |
| 20 to 34 years | 0 (0.0%) | 0.0 |
| 35 to 50 years | 0 (0.0%) | 0.0 |
| Total | 0 (0.0%) | 0.0 |
Fertility by Age by Marriage Status in Sanostee
| Age Bracket | Married | Unmarried |
| 15 to 19 years | 0 (0.0%) | 0 (0.0%) |
| 20 to 34 years | 0 (0.0%) | 0 (0.0%) |
| 35 to 50 years | 0 (0.0%) | 0 (0.0%) |
| Total | 0 (0.0%) | 0 (0.0%) |
Fertility by Education in Sanostee
| Educational Attainment | Women with Births | Births / 1,000 Women |
| Less than High School | 0 (0.0%) | 0.0 |
| High School Diploma | 0 (0.0%) | 0.0 |
| College or Associate's Degree | 0 (0.0%) | 0.0 |
| Bachelor's Degree | 0 (0.0%) | 0.0 |
| Graduate Degree | 0 (0.0%) | 0.0 |
| Total | 0 (0.0%) | 0.0 |
Fertility by Education by Marriage Status in Sanostee
| Educational Attainment | Married | Unmarried |
| Less than High School | 0 (0.0%) | 0 (0.0%) |
| High School Diploma | 0 (0.0%) | 0 (0.0%) |
| College or Associate's Degree | 0 (0.0%) | 0 (0.0%) |
| Bachelor's Degree | 0 (0.0%) | 0 (0.0%) |
| Graduate Degree | 0 (0.0%) | 0 (0.0%) |
| Total | 0 (0.0%) | 0 (0.0%) |
Employment Characteristics in Sanostee
Employment by Class of Employer in Sanostee
Among the 59 employed individuals in Sanostee, private company employees (31 | 52.5%), local government employees (15 | 25.4%), and state government employees (6 | 10.2%) make up the most common classes of employment.
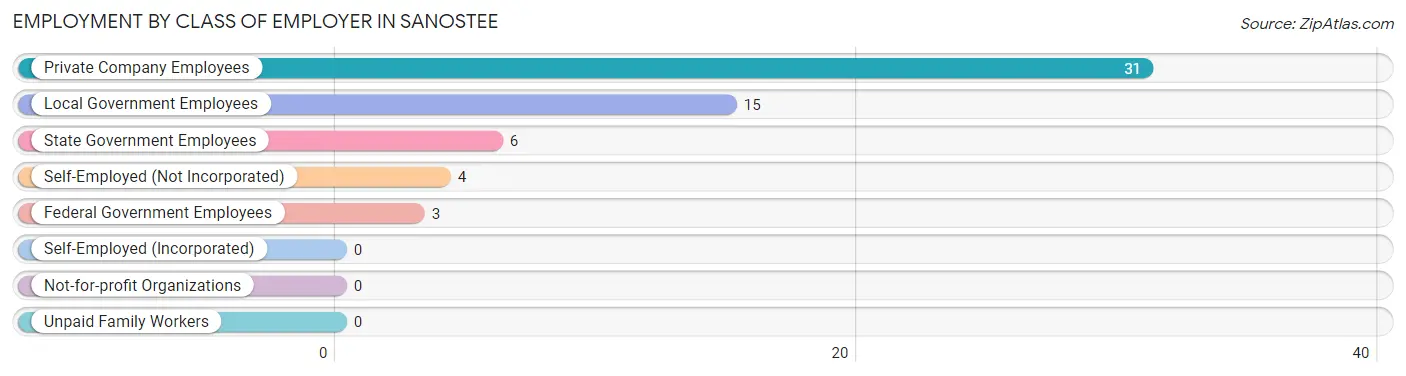
| Employer Class | # Employees | % Employees |
| Private Company Employees | 31 | 52.5% |
| Self-Employed (Incorporated) | 0 | 0.0% |
| Self-Employed (Not Incorporated) | 4 | 6.8% |
| Not-for-profit Organizations | 0 | 0.0% |
| Local Government Employees | 15 | 25.4% |
| State Government Employees | 6 | 10.2% |
| Federal Government Employees | 3 | 5.1% |
| Unpaid Family Workers | 0 | 0.0% |
| Total | 59 | 100.0% |
Employment Status by Age in Sanostee
According to the labor force statistics for Sanostee, out of the total population over 16 years of age (241), 27.0% or 65 individuals are in the labor force, with 9.2% or 6 of them unemployed. The age group with the highest labor force participation rate is 25 to 29 years, with 58.3% or 7 individuals in the labor force. Within the labor force, the 45 to 54 years age range has the highest percentage of unemployed individuals, with 28.6% or 6 of them being unemployed.
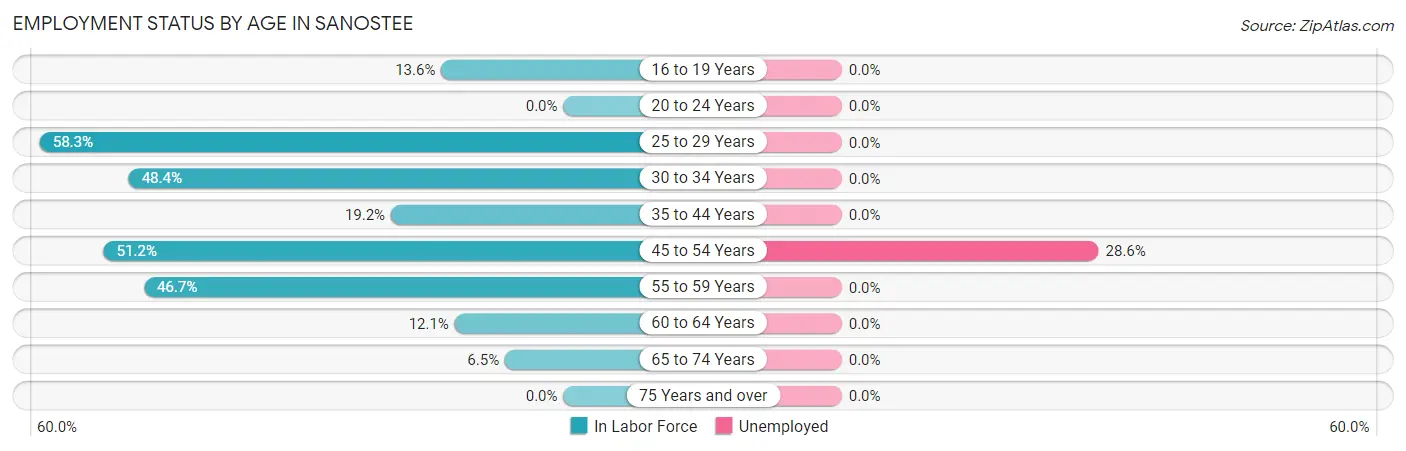
| Age Bracket | In Labor Force | Unemployed |
| 16 to 19 Years | 3 (13.6%) | 0 (0.0%) |
| 20 to 24 Years | 0 (0.0%) | 0 (0.0%) |
| 25 to 29 Years | 7 (58.3%) | 0 (0.0%) |
| 30 to 34 Years | 15 (48.4%) | 0 (0.0%) |
| 35 to 44 Years | 5 (19.2%) | 0 (0.0%) |
| 45 to 54 Years | 21 (51.2%) | 6 (28.6%) |
| 55 to 59 Years | 7 (46.7%) | 0 (0.0%) |
| 60 to 64 Years | 4 (12.1%) | 0 (0.0%) |
| 65 to 74 Years | 3 (6.5%) | 0 (0.0%) |
| 75 Years and over | 0 (0.0%) | 0 (0.0%) |
| Total | 65 (27.0%) | 6 (9.2%) |
Employment Status by Educational Attainment in Sanostee
According to labor force statistics for Sanostee, 37.3% of individuals (59) out of the total population between 25 and 64 years of age (158) are in the labor force, with 10.2% or 6 of them being unemployed. The group with the highest labor force participation rate are those with the educational attainment of high school diploma, with 49.4% or 42 individuals in the labor force. Within the labor force, individuals with high school diploma education have the highest percentage of unemployment, with 14.3% or 6 of them being unemployed.
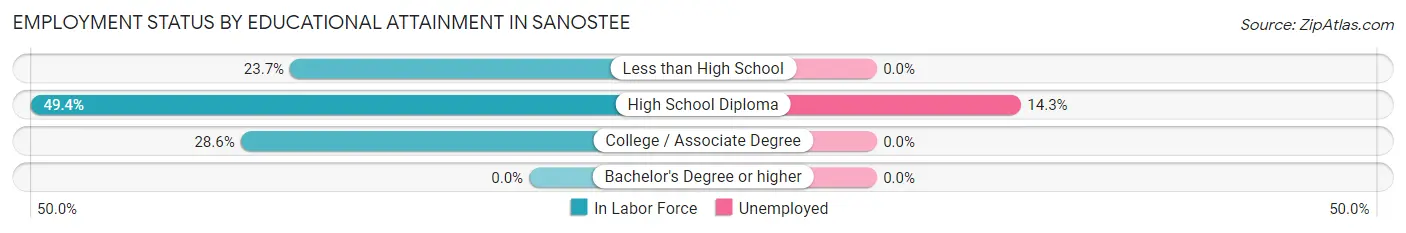
| Educational Attainment | In Labor Force | Unemployed |
| Less than High School | 9 (23.7%) | 0 (0.0%) |
| High School Diploma | 42 (49.4%) | 12 (14.3%) |
| College / Associate Degree | 8 (28.6%) | 0 (0.0%) |
| Bachelor's Degree or higher | 0 (0.0%) | 0 (0.0%) |
| Total | 59 (37.3%) | 16 (10.2%) |
Employment Occupations by Sex in Sanostee
Management, Business, Science and Arts Occupations
The most common Management, Business, Science and Arts occupations in Sanostee are Community & Social Service (6 | 10.2%), Education, Arts & Media (3 | 5.1%), Education Instruction & Library (3 | 5.1%), and Health Diagnosing & Treating (3 | 5.1%).
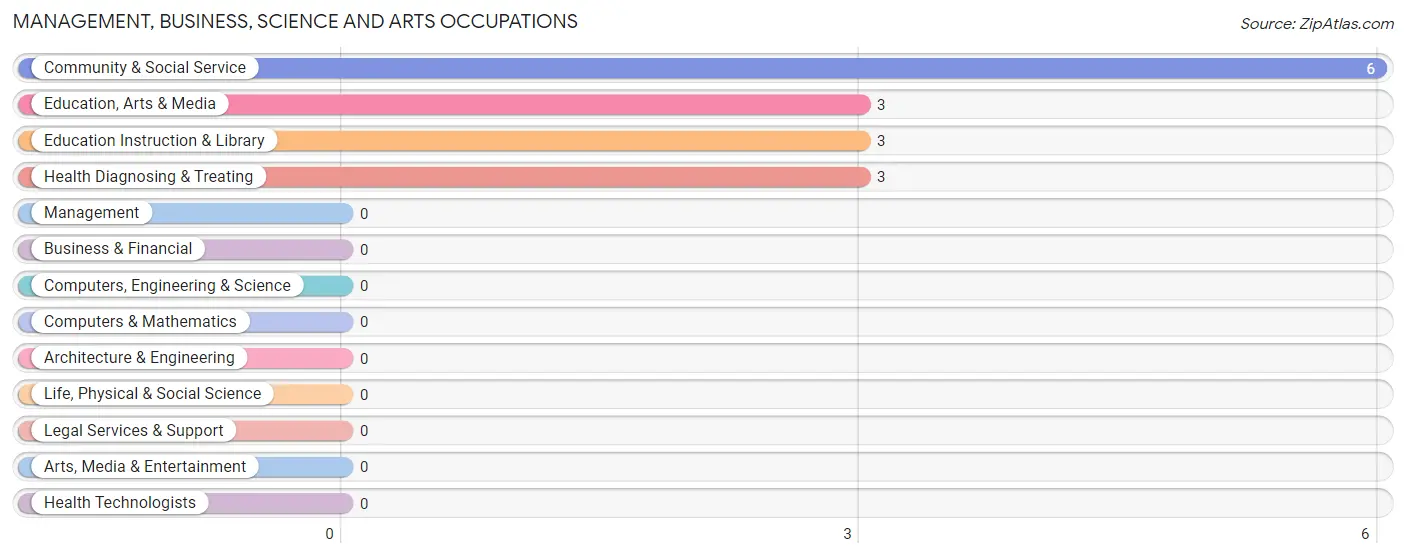
Management, Business, Science and Arts Occupations by Sex
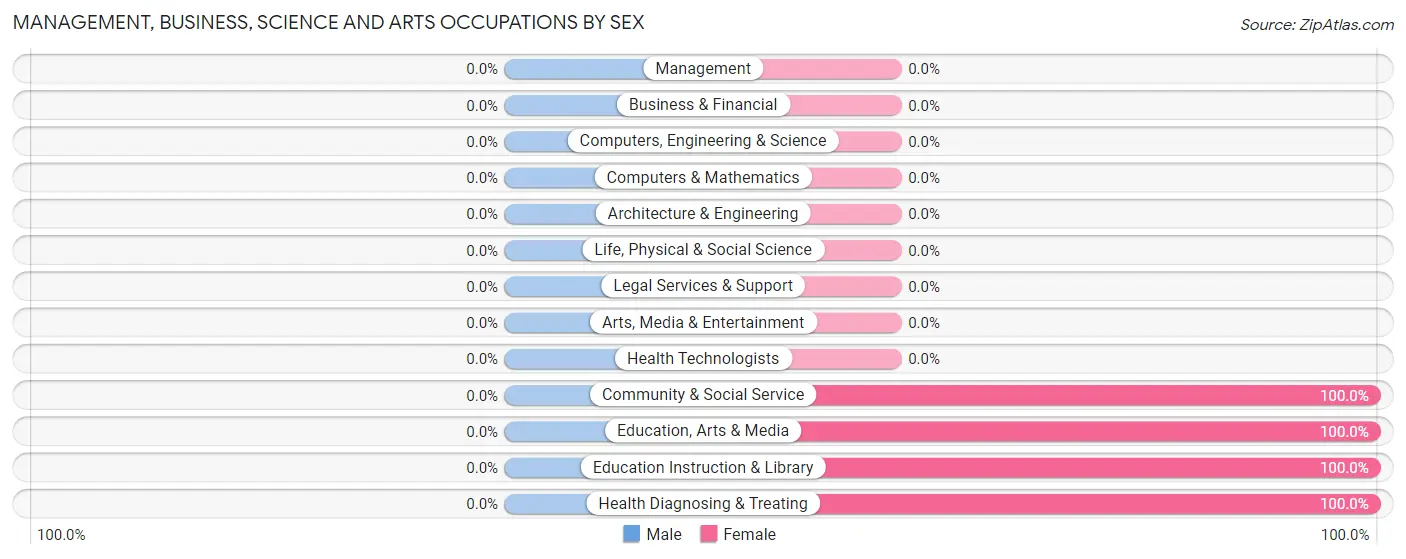
| Occupation | Male | Female |
| Management | 0 (0.0%) | 0 (0.0%) |
| Business & Financial | 0 (0.0%) | 0 (0.0%) |
| Computers, Engineering & Science | 0 (0.0%) | 0 (0.0%) |
| Computers & Mathematics | 0 (0.0%) | 0 (0.0%) |
| Architecture & Engineering | 0 (0.0%) | 0 (0.0%) |
| Life, Physical & Social Science | 0 (0.0%) | 0 (0.0%) |
| Community & Social Service | 0 (0.0%) | 6 (100.0%) |
| Education, Arts & Media | 0 (0.0%) | 3 (100.0%) |
| Legal Services & Support | 0 (0.0%) | 0 (0.0%) |
| Education Instruction & Library | 0 (0.0%) | 3 (100.0%) |
| Arts, Media & Entertainment | 0 (0.0%) | 0 (0.0%) |
| Health Diagnosing & Treating | 0 (0.0%) | 3 (100.0%) |
| Health Technologists | 0 (0.0%) | 0 (0.0%) |
| Total (Category) | 0 (0.0%) | 9 (100.0%) |
| Total (Overall) | 29 (49.1%) | 30 (50.8%) |
Services Occupations
The most common Services occupations in Sanostee are Food Preparation & Serving (7 | 11.9%), Cleaning & Maintenance (7 | 11.9%), Personal Care & Service (6 | 10.2%), and Healthcare Support (5 | 8.5%).
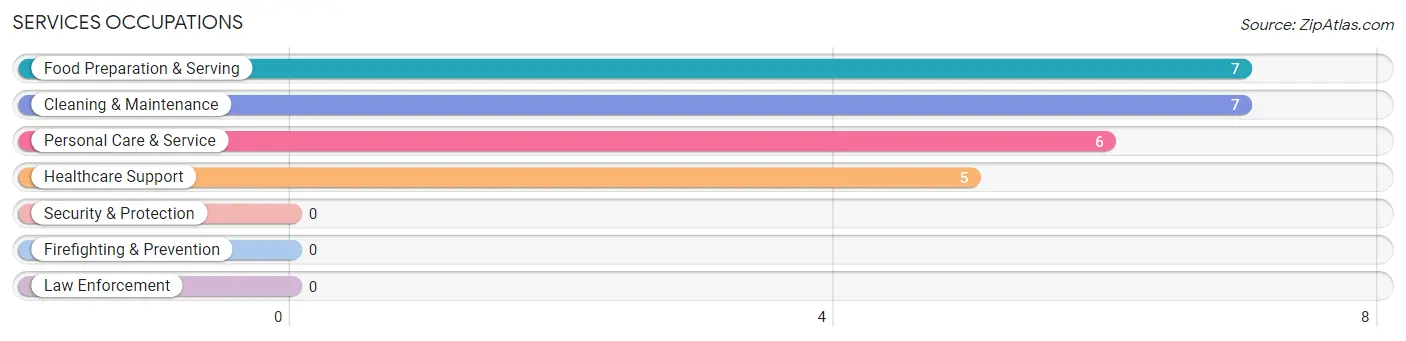
Services Occupations by Sex
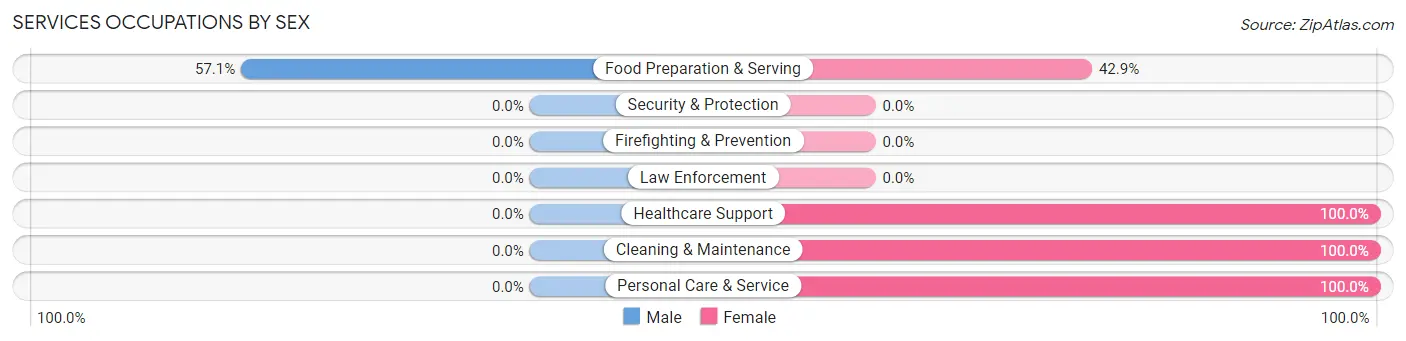
| Occupation | Male | Female |
| Healthcare Support | 0 (0.0%) | 5 (100.0%) |
| Security & Protection | 0 (0.0%) | 0 (0.0%) |
| Firefighting & Prevention | 0 (0.0%) | 0 (0.0%) |
| Law Enforcement | 0 (0.0%) | 0 (0.0%) |
| Food Preparation & Serving | 4 (57.1%) | 3 (42.9%) |
| Cleaning & Maintenance | 0 (0.0%) | 7 (100.0%) |
| Personal Care & Service | 0 (0.0%) | 6 (100.0%) |
| Total (Category) | 4 (16.0%) | 21 (84.0%) |
| Total (Overall) | 29 (49.1%) | 30 (50.8%) |
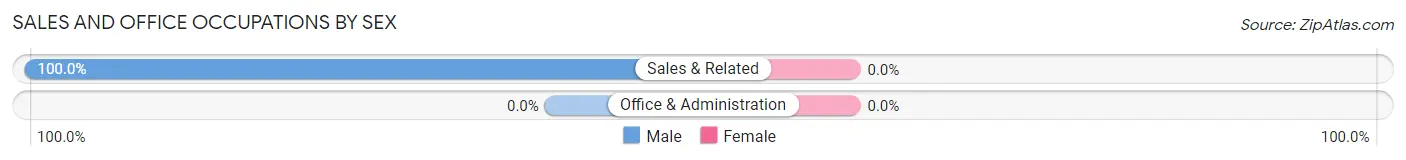
Sales and Office Occupations
The most common Sales and Office occupations in Sanostee are , and Sales & Related (3 | 5.1%).
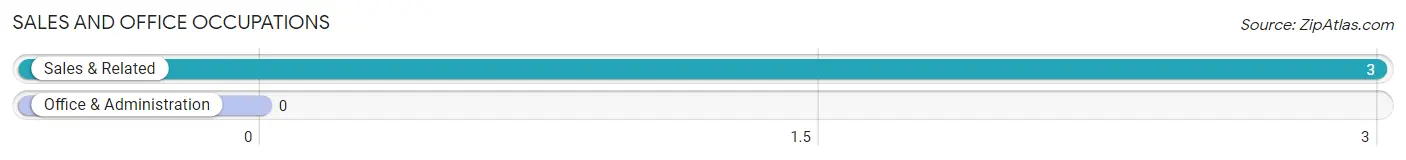
Sales and Office Occupations by Sex
| Occupation | Male | Female |
| Sales & Related | 3 (100.0%) | 0 (0.0%) |
| Office & Administration | 0 (0.0%) | 0 (0.0%) |
| Total (Category) | 3 (100.0%) | 0 (0.0%) |
| Total (Overall) | 29 (49.1%) | 30 (50.8%) |
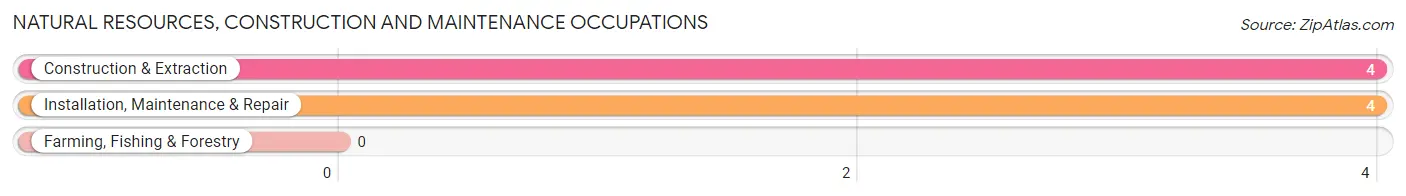
Natural Resources, Construction and Maintenance Occupations
The most common Natural Resources, Construction and Maintenance occupations in Sanostee are Construction & Extraction (4 | 6.8%), and Installation, Maintenance & Repair (4 | 6.8%).
Natural Resources, Construction and Maintenance Occupations by Sex
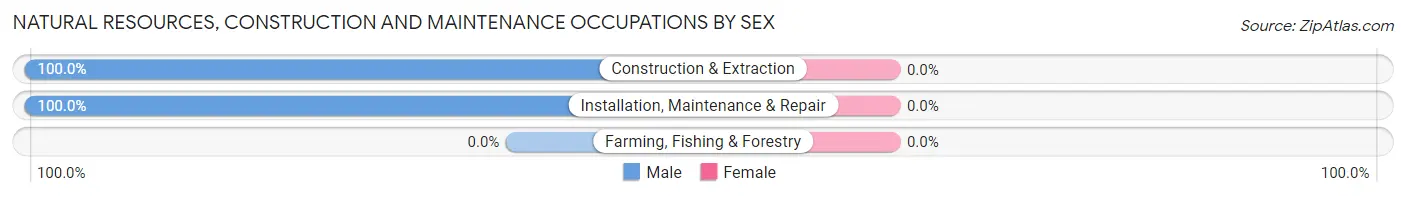
| Occupation | Male | Female |
| Farming, Fishing & Forestry | 0 (0.0%) | 0 (0.0%) |
| Construction & Extraction | 4 (100.0%) | 0 (0.0%) |
| Installation, Maintenance & Repair | 4 (100.0%) | 0 (0.0%) |
| Total (Category) | 8 (100.0%) | 0 (0.0%) |
| Total (Overall) | 29 (49.1%) | 30 (50.8%) |
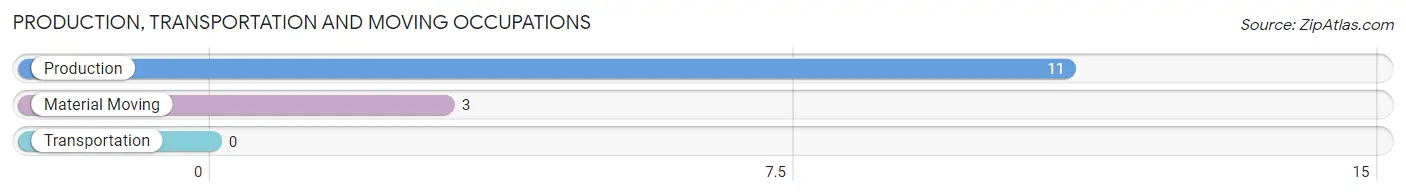
Production, Transportation and Moving Occupations
The most common Production, Transportation and Moving occupations in Sanostee are Production (11 | 18.6%), and Material Moving (3 | 5.1%).
Production, Transportation and Moving Occupations by Sex
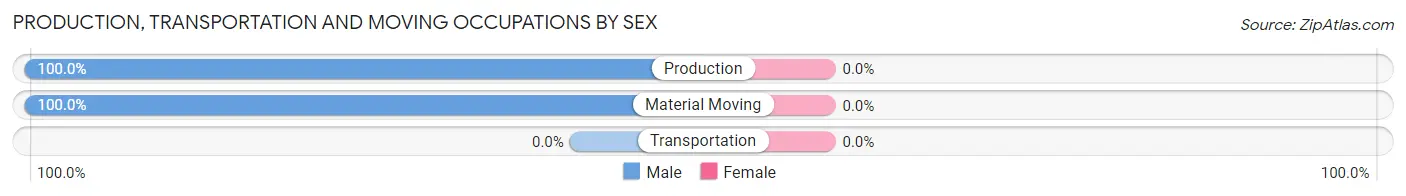
| Occupation | Male | Female |
| Production | 11 (100.0%) | 0 (0.0%) |
| Transportation | 0 (0.0%) | 0 (0.0%) |
| Material Moving | 3 (100.0%) | 0 (0.0%) |
| Total (Category) | 14 (100.0%) | 0 (0.0%) |
| Total (Overall) | 29 (49.1%) | 30 (50.8%) |
Employment Industries by Sex in Sanostee
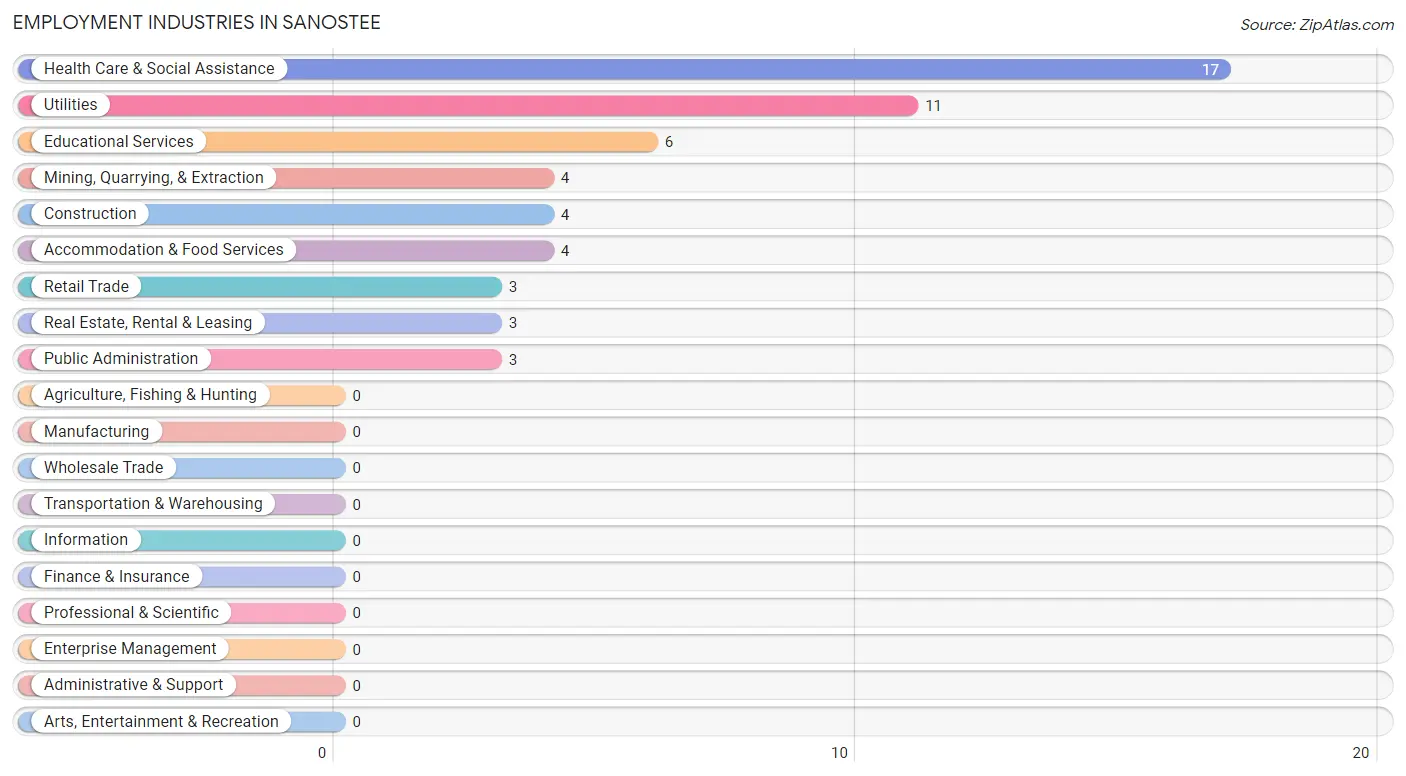
Employment Industries in Sanostee
The major employment industries in Sanostee include Health Care & Social Assistance (17 | 28.8%), Utilities (11 | 18.6%), Educational Services (6 | 10.2%), Mining, Quarrying, & Extraction (4 | 6.8%), and Construction (4 | 6.8%).
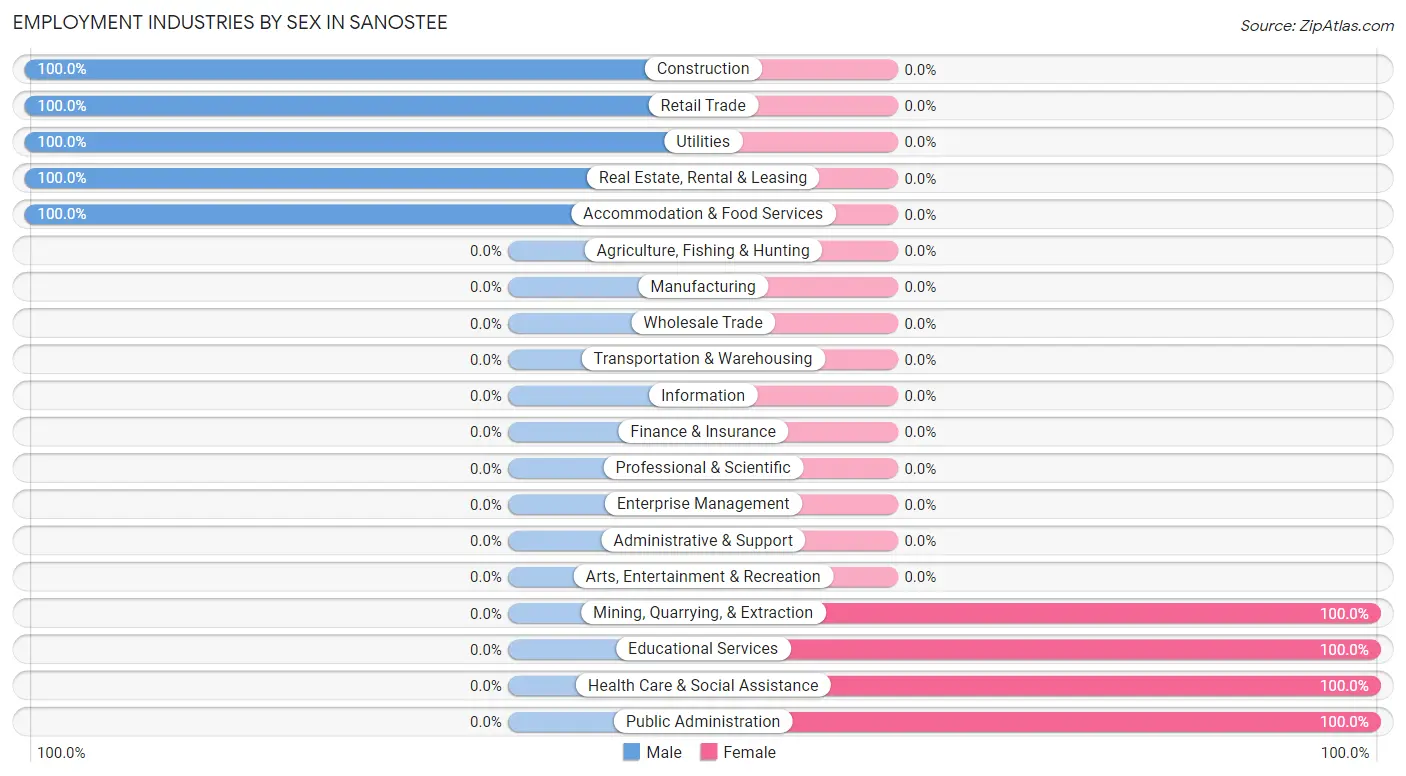
Employment Industries by Sex in Sanostee
The Sanostee industries that see more men than women are Construction (100.0%), Retail Trade (100.0%), and Utilities (100.0%), whereas the industries that tend to have a higher number of women are Mining, Quarrying, & Extraction (100.0%), Educational Services (100.0%), and Health Care & Social Assistance (100.0%).
| Industry | Male | Female |
| Agriculture, Fishing & Hunting | 0 (0.0%) | 0 (0.0%) |
| Mining, Quarrying, & Extraction | 0 (0.0%) | 4 (100.0%) |
| Construction | 4 (100.0%) | 0 (0.0%) |
| Manufacturing | 0 (0.0%) | 0 (0.0%) |
| Wholesale Trade | 0 (0.0%) | 0 (0.0%) |
| Retail Trade | 3 (100.0%) | 0 (0.0%) |
| Transportation & Warehousing | 0 (0.0%) | 0 (0.0%) |
| Utilities | 11 (100.0%) | 0 (0.0%) |
| Information | 0 (0.0%) | 0 (0.0%) |
| Finance & Insurance | 0 (0.0%) | 0 (0.0%) |
| Real Estate, Rental & Leasing | 3 (100.0%) | 0 (0.0%) |
| Professional & Scientific | 0 (0.0%) | 0 (0.0%) |
| Enterprise Management | 0 (0.0%) | 0 (0.0%) |
| Administrative & Support | 0 (0.0%) | 0 (0.0%) |
| Educational Services | 0 (0.0%) | 6 (100.0%) |
| Health Care & Social Assistance | 0 (0.0%) | 17 (100.0%) |
| Arts, Entertainment & Recreation | 0 (0.0%) | 0 (0.0%) |
| Accommodation & Food Services | 4 (100.0%) | 0 (0.0%) |
| Public Administration | 0 (0.0%) | 3 (100.0%) |
| Total | 29 (49.1%) | 30 (50.8%) |
Education in Sanostee
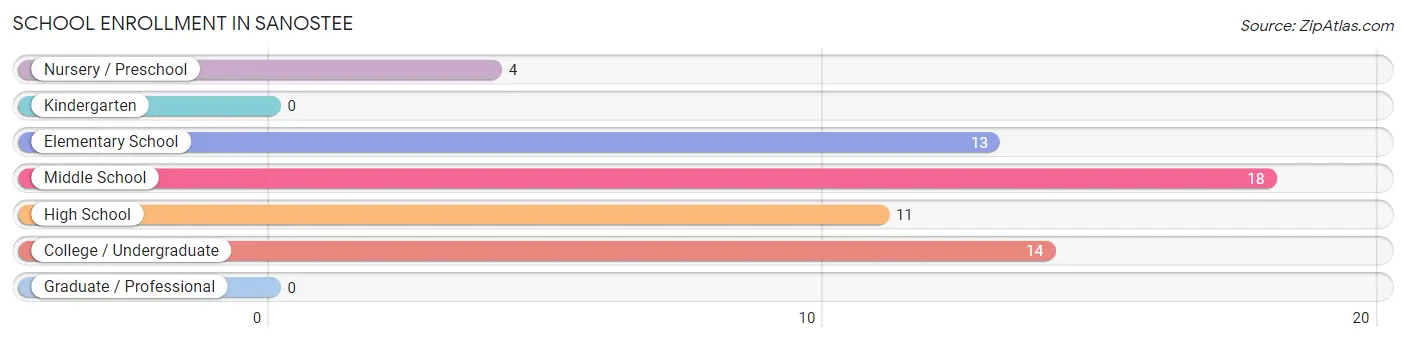
School Enrollment in Sanostee
The most common levels of schooling among the 60 students in Sanostee are middle school (18 | 30.0%), college / undergraduate (14 | 23.3%), and elementary school (13 | 21.7%).
| School Level | # Students | % Students |
| Nursery / Preschool | 4 | 6.7% |
| Kindergarten | 0 | 0.0% |
| Elementary School | 13 | 21.7% |
| Middle School | 18 | 30.0% |
| High School | 11 | 18.3% |
| College / Undergraduate | 14 | 23.3% |
| Graduate / Professional | 0 | 0.0% |
| Total | 60 | 100.0% |
School Enrollment by Age by Funding Source in Sanostee
Out of a total of 60 students who are enrolled in schools in Sanostee, 13 (21.7%) attend a private institution, while the remaining 47 (78.3%) are enrolled in public schools. The age group of 35 years and over has the highest likelihood of being enrolled in private schools, with 5 (100.0% in the age bracket) enrolled. Conversely, the age group of 3 to 4 year olds has the lowest likelihood of being enrolled in a private school, with 4 (100.0% in the age bracket) attending a public institution.
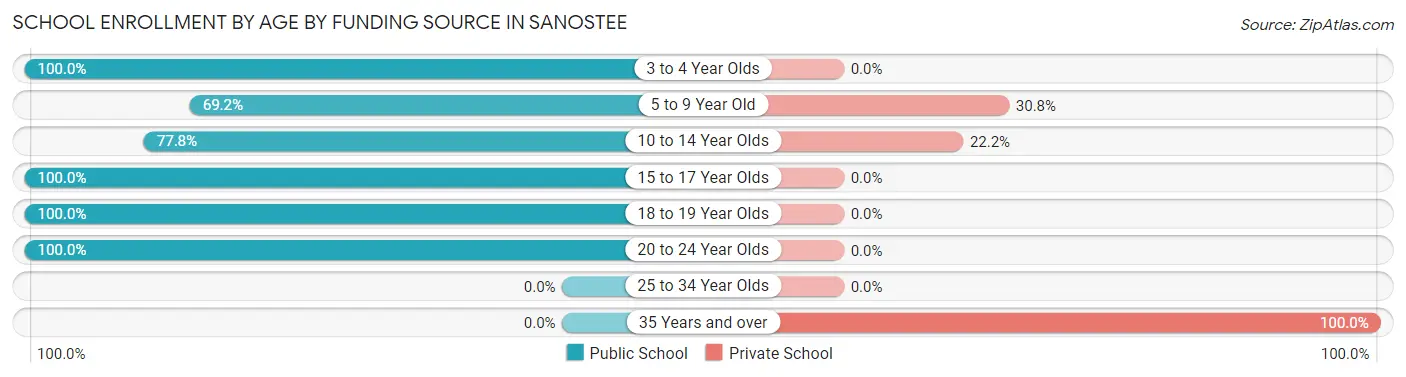
| Age Bracket | Public School | Private School |
| 3 to 4 Year Olds | 4 (100.0%) | 0 (0.0%) |
| 5 to 9 Year Old | 9 (69.2%) | 4 (30.8%) |
| 10 to 14 Year Olds | 14 (77.8%) | 4 (22.2%) |
| 15 to 17 Year Olds | 6 (100.0%) | 0 (0.0%) |
| 18 to 19 Year Olds | 8 (100.0%) | 0 (0.0%) |
| 20 to 24 Year Olds | 6 (100.0%) | 0 (0.0%) |
| 25 to 34 Year Olds | 0 (0.0%) | 0 (0.0%) |
| 35 Years and over | 0 (0.0%) | 5 (100.0%) |
| Total | 47 (78.3%) | 13 (21.7%) |
Educational Attainment by Field of Study in Sanostee
Psychology (5 | 50.0%), physical & health sciences (3 | 30.0%), and social sciences (2 | 20.0%) are the most common fields of study among 10 individuals in Sanostee who have obtained a bachelor's degree or higher.
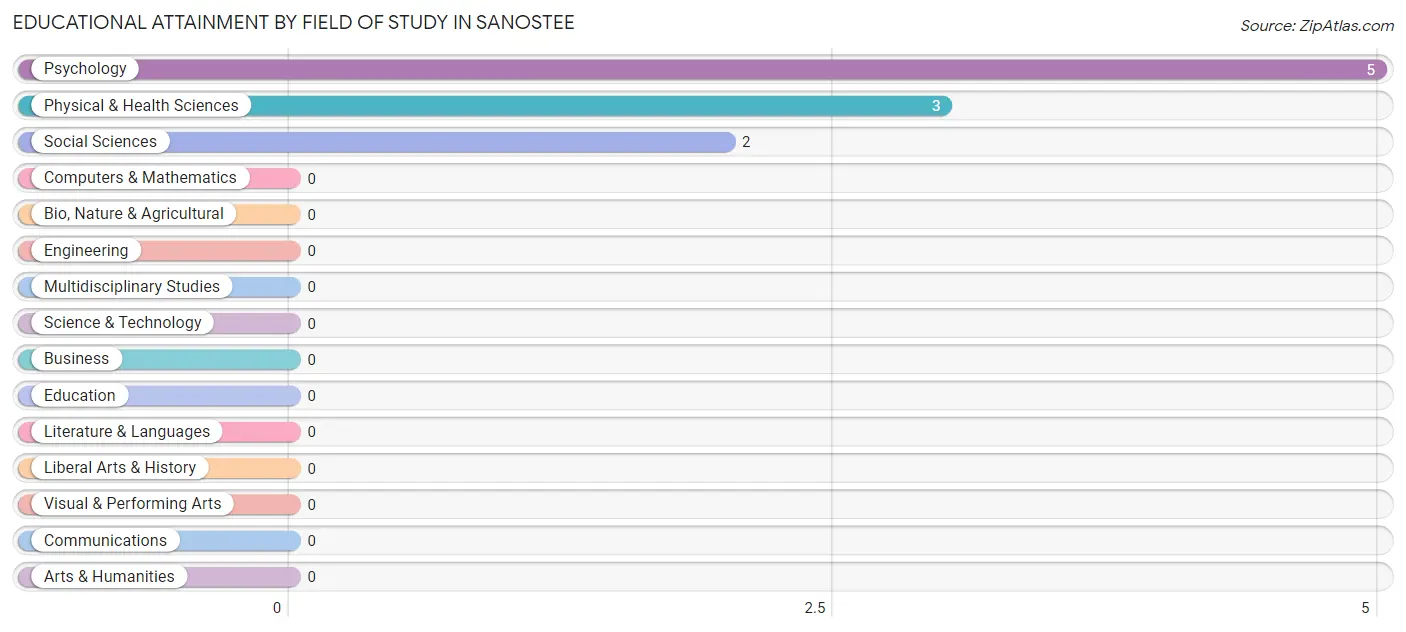
| Field of Study | # Graduates | % Graduates |
| Computers & Mathematics | 0 | 0.0% |
| Bio, Nature & Agricultural | 0 | 0.0% |
| Physical & Health Sciences | 3 | 30.0% |
| Psychology | 5 | 50.0% |
| Social Sciences | 2 | 20.0% |
| Engineering | 0 | 0.0% |
| Multidisciplinary Studies | 0 | 0.0% |
| Science & Technology | 0 | 0.0% |
| Business | 0 | 0.0% |
| Education | 0 | 0.0% |
| Literature & Languages | 0 | 0.0% |
| Liberal Arts & History | 0 | 0.0% |
| Visual & Performing Arts | 0 | 0.0% |
| Communications | 0 | 0.0% |
| Arts & Humanities | 0 | 0.0% |
| Total | 10 | 100.0% |
Transportation & Commute in Sanostee
Vehicle Availability by Sex in Sanostee
The most prevalent vehicle ownership categories in Sanostee are males with 1 vehicle (14, accounting for 48.3%) and females with 1 vehicle (3, making up 46.7%).
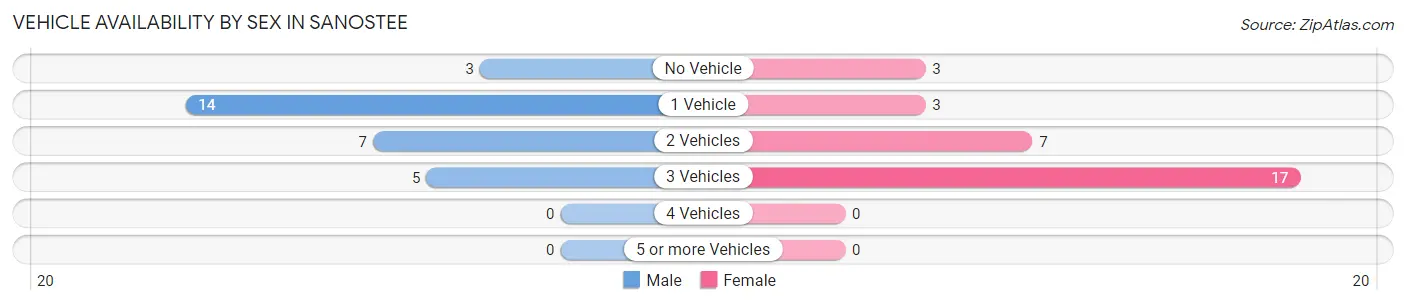
| Vehicles Available | Male | Female |
| No Vehicle | 3 (10.3%) | 3 (10.0%) |
| 1 Vehicle | 14 (48.3%) | 3 (10.0%) |
| 2 Vehicles | 7 (24.1%) | 7 (23.3%) |
| 3 Vehicles | 5 (17.2%) | 17 (56.7%) |
| 4 Vehicles | 0 (0.0%) | 0 (0.0%) |
| 5 or more Vehicles | 0 (0.0%) | 0 (0.0%) |
| Total | 29 (100.0%) | 30 (100.0%) |
Commute Time in Sanostee
The most frequently occuring commute durations in Sanostee are 60 to 89 minutes (19 commuters, 34.5%), 30 to 34 minutes (14 commuters, 25.5%), and 20 to 24 minutes (9 commuters, 16.4%).
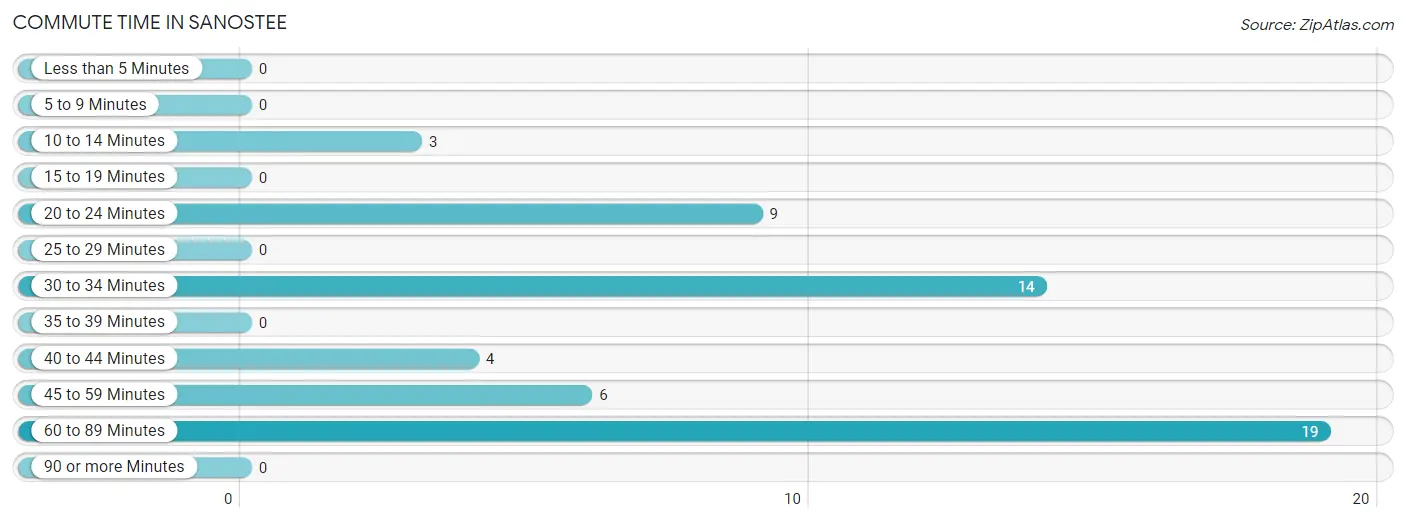
| Commute Time | # Commuters | % Commuters |
| Less than 5 Minutes | 0 | 0.0% |
| 5 to 9 Minutes | 0 | 0.0% |
| 10 to 14 Minutes | 3 | 5.4% |
| 15 to 19 Minutes | 0 | 0.0% |
| 20 to 24 Minutes | 9 | 16.4% |
| 25 to 29 Minutes | 0 | 0.0% |
| 30 to 34 Minutes | 14 | 25.5% |
| 35 to 39 Minutes | 0 | 0.0% |
| 40 to 44 Minutes | 4 | 7.3% |
| 45 to 59 Minutes | 6 | 10.9% |
| 60 to 89 Minutes | 19 | 34.5% |
| 90 or more Minutes | 0 | 0.0% |
Commute Time by Sex in Sanostee
The most common commute times in Sanostee are 60 to 89 minutes (12 commuters, 48.0%) for males and 20 to 24 minutes (9 commuters, 30.0%) for females.
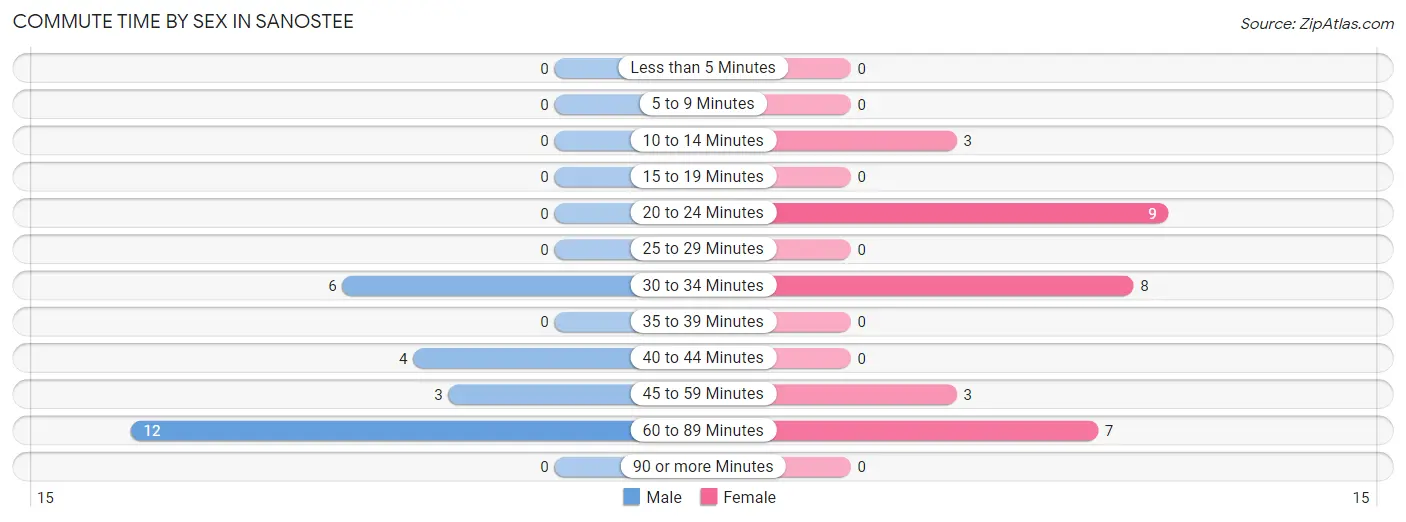
| Commute Time | Male | Female |
| Less than 5 Minutes | 0 (0.0%) | 0 (0.0%) |
| 5 to 9 Minutes | 0 (0.0%) | 0 (0.0%) |
| 10 to 14 Minutes | 0 (0.0%) | 3 (10.0%) |
| 15 to 19 Minutes | 0 (0.0%) | 0 (0.0%) |
| 20 to 24 Minutes | 0 (0.0%) | 9 (30.0%) |
| 25 to 29 Minutes | 0 (0.0%) | 0 (0.0%) |
| 30 to 34 Minutes | 6 (24.0%) | 8 (26.7%) |
| 35 to 39 Minutes | 0 (0.0%) | 0 (0.0%) |
| 40 to 44 Minutes | 4 (16.0%) | 0 (0.0%) |
| 45 to 59 Minutes | 3 (12.0%) | 3 (10.0%) |
| 60 to 89 Minutes | 12 (48.0%) | 7 (23.3%) |
| 90 or more Minutes | 0 (0.0%) | 0 (0.0%) |
Time of Departure to Work by Sex in Sanostee
The most frequent times of departure to work in Sanostee are 5:30 AM to 5:59 AM (9, 36.0%) for males and 6:00 AM to 6:29 AM (9, 30.0%) for females.
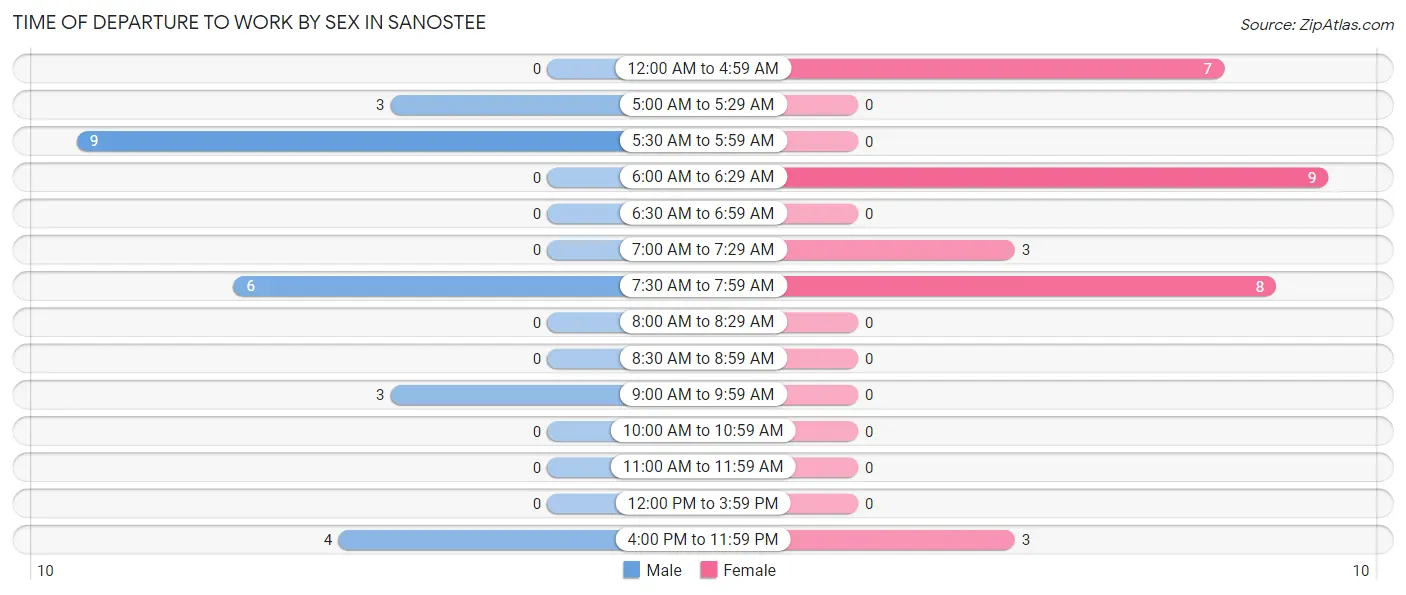
| Time of Departure | Male | Female |
| 12:00 AM to 4:59 AM | 0 (0.0%) | 7 (23.3%) |
| 5:00 AM to 5:29 AM | 3 (12.0%) | 0 (0.0%) |
| 5:30 AM to 5:59 AM | 9 (36.0%) | 0 (0.0%) |
| 6:00 AM to 6:29 AM | 0 (0.0%) | 9 (30.0%) |
| 6:30 AM to 6:59 AM | 0 (0.0%) | 0 (0.0%) |
| 7:00 AM to 7:29 AM | 0 (0.0%) | 3 (10.0%) |
| 7:30 AM to 7:59 AM | 6 (24.0%) | 8 (26.7%) |
| 8:00 AM to 8:29 AM | 0 (0.0%) | 0 (0.0%) |
| 8:30 AM to 8:59 AM | 0 (0.0%) | 0 (0.0%) |
| 9:00 AM to 9:59 AM | 3 (12.0%) | 0 (0.0%) |
| 10:00 AM to 10:59 AM | 0 (0.0%) | 0 (0.0%) |
| 11:00 AM to 11:59 AM | 0 (0.0%) | 0 (0.0%) |
| 12:00 PM to 3:59 PM | 0 (0.0%) | 0 (0.0%) |
| 4:00 PM to 11:59 PM | 4 (16.0%) | 3 (10.0%) |
| Total | 25 (100.0%) | 30 (100.0%) |
Housing Occupancy in Sanostee
Occupancy by Ownership in Sanostee
Of the total 89 dwellings in Sanostee, owner-occupied units account for 85 (95.5%), while renter-occupied units make up 4 (4.5%).
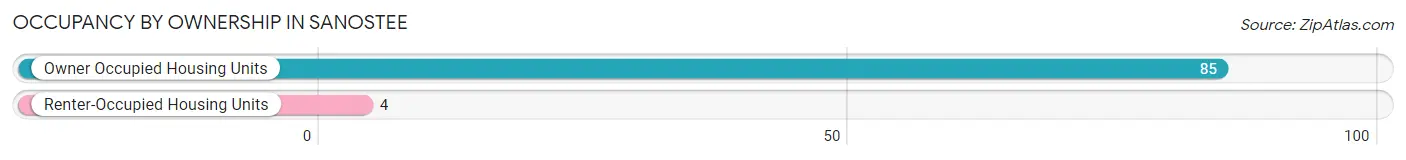
| Occupancy | # Housing Units | % Housing Units |
| Owner Occupied Housing Units | 85 | 95.5% |
| Renter-Occupied Housing Units | 4 | 4.5% |
| Total Occupied Housing Units | 89 | 100.0% |
Occupancy by Household Size in Sanostee
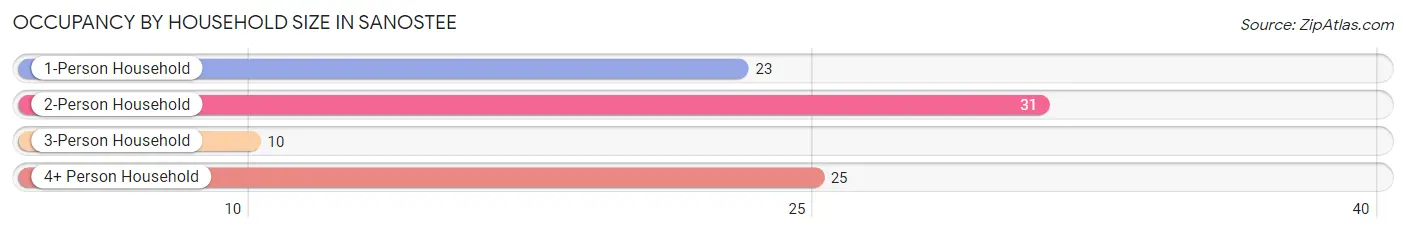
| Household Size | # Housing Units | % Housing Units |
| 1-Person Household | 23 | 25.8% |
| 2-Person Household | 31 | 34.8% |
| 3-Person Household | 10 | 11.2% |
| 4+ Person Household | 25 | 28.1% |
| Total Housing Units | 89 | 100.0% |
Occupancy by Ownership by Household Size in Sanostee
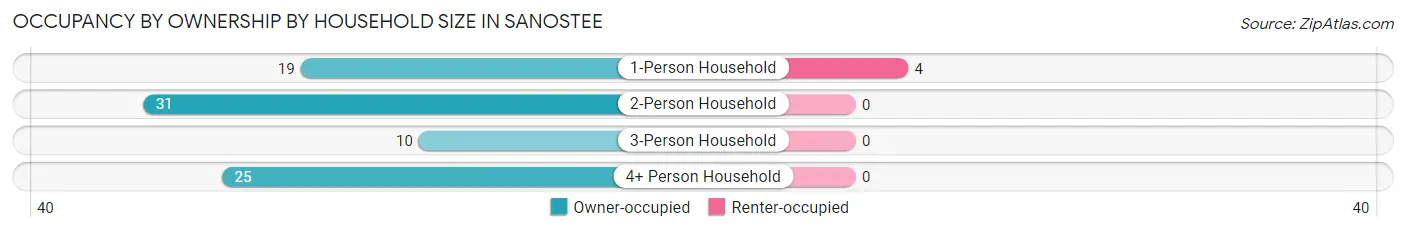
| Household Size | Owner-occupied | Renter-occupied |
| 1-Person Household | 19 (82.6%) | 4 (17.4%) |
| 2-Person Household | 31 (100.0%) | 0 (0.0%) |
| 3-Person Household | 10 (100.0%) | 0 (0.0%) |
| 4+ Person Household | 25 (100.0%) | 0 (0.0%) |
| Total Housing Units | 85 (95.5%) | 4 (4.5%) |
Occupancy by Educational Attainment in Sanostee
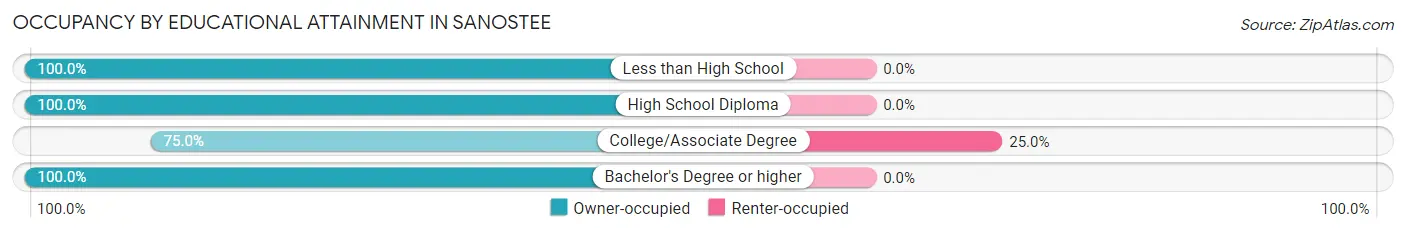
| Household Size | Owner-occupied | Renter-occupied |
| Less than High School | 35 (100.0%) | 0 (0.0%) |
| High School Diploma | 28 (100.0%) | 0 (0.0%) |
| College/Associate Degree | 12 (75.0%) | 4 (25.0%) |
| Bachelor's Degree or higher | 10 (100.0%) | 0 (0.0%) |
Occupancy by Age of Householder in Sanostee
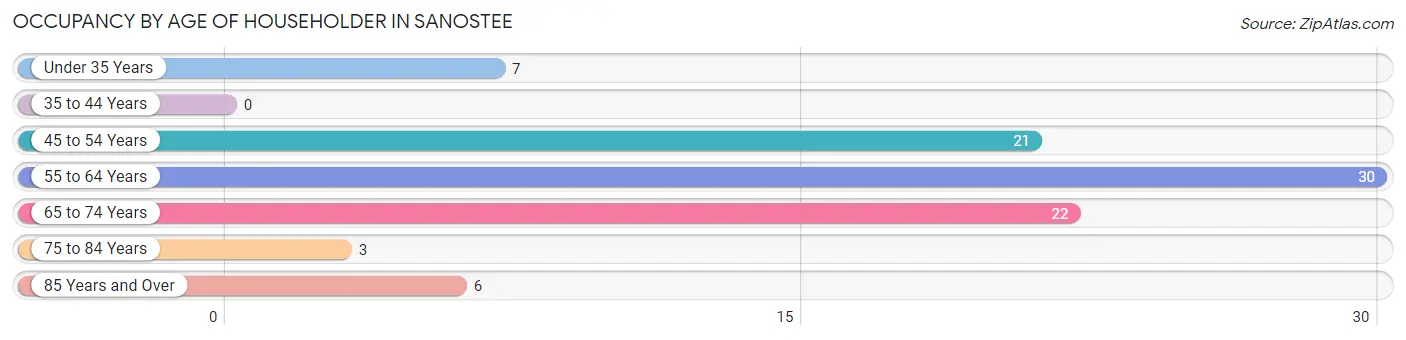
| Age Bracket | # Households | % Households |
| Under 35 Years | 7 | 7.9% |
| 35 to 44 Years | 0 | 0.0% |
| 45 to 54 Years | 21 | 23.6% |
| 55 to 64 Years | 30 | 33.7% |
| 65 to 74 Years | 22 | 24.7% |
| 75 to 84 Years | 3 | 3.4% |
| 85 Years and Over | 6 | 6.7% |
| Total | 89 | 100.0% |
Housing Finances in Sanostee
Median Income by Occupancy in Sanostee
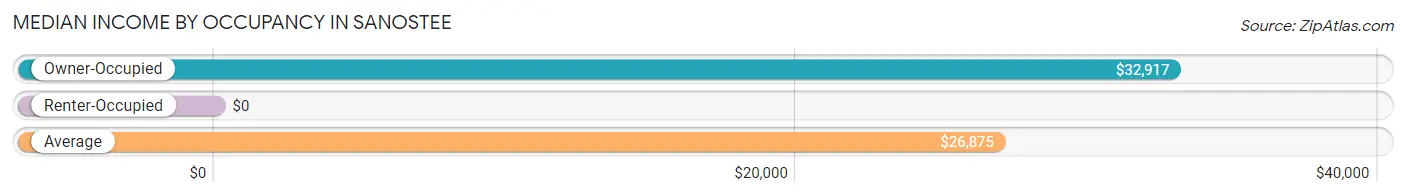
| Occupancy Type | # Households | Median Income |
| Owner-Occupied | 85 (95.5%) | $32,917 |
| Renter-Occupied | 4 (4.5%) | $0 |
| Average | 89 (100.0%) | $26,875 |
Occupancy by Householder Income Bracket in Sanostee
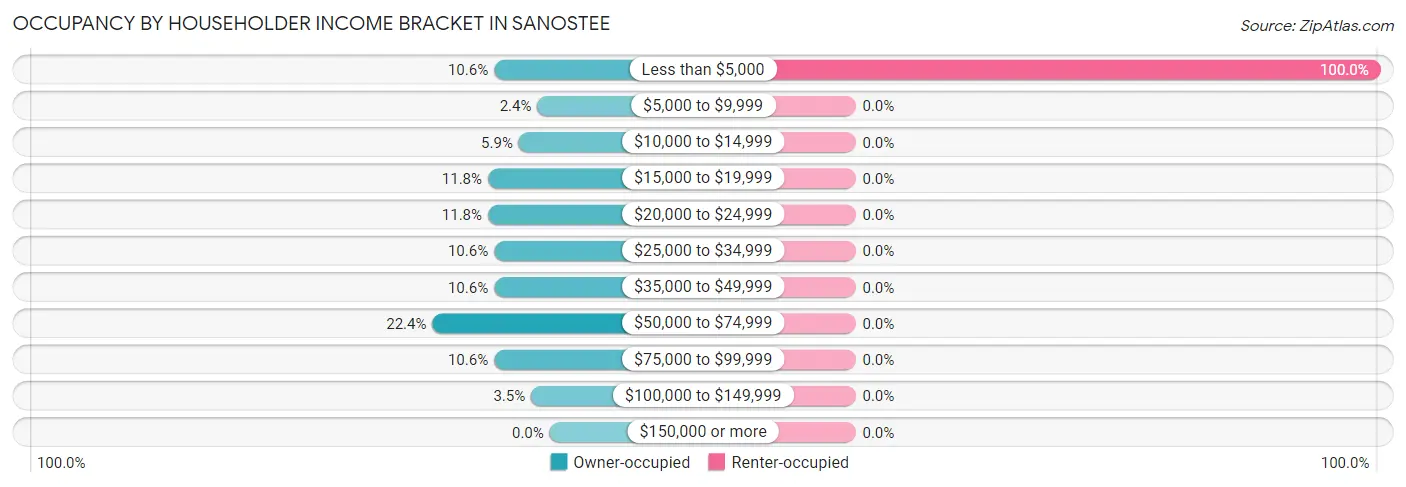
| Income Bracket | Owner-occupied | Renter-occupied |
| Less than $5,000 | 9 (10.6%) | 4 (100.0%) |
| $5,000 to $9,999 | 2 (2.4%) | 0 (0.0%) |
| $10,000 to $14,999 | 5 (5.9%) | 0 (0.0%) |
| $15,000 to $19,999 | 10 (11.8%) | 0 (0.0%) |
| $20,000 to $24,999 | 10 (11.8%) | 0 (0.0%) |
| $25,000 to $34,999 | 9 (10.6%) | 0 (0.0%) |
| $35,000 to $49,999 | 9 (10.6%) | 0 (0.0%) |
| $50,000 to $74,999 | 19 (22.4%) | 0 (0.0%) |
| $75,000 to $99,999 | 9 (10.6%) | 0 (0.0%) |
| $100,000 to $149,999 | 3 (3.5%) | 0 (0.0%) |
| $150,000 or more | 0 (0.0%) | 0 (0.0%) |
| Total | 85 (100.0%) | 4 (100.0%) |
Monthly Housing Cost Tiers in Sanostee
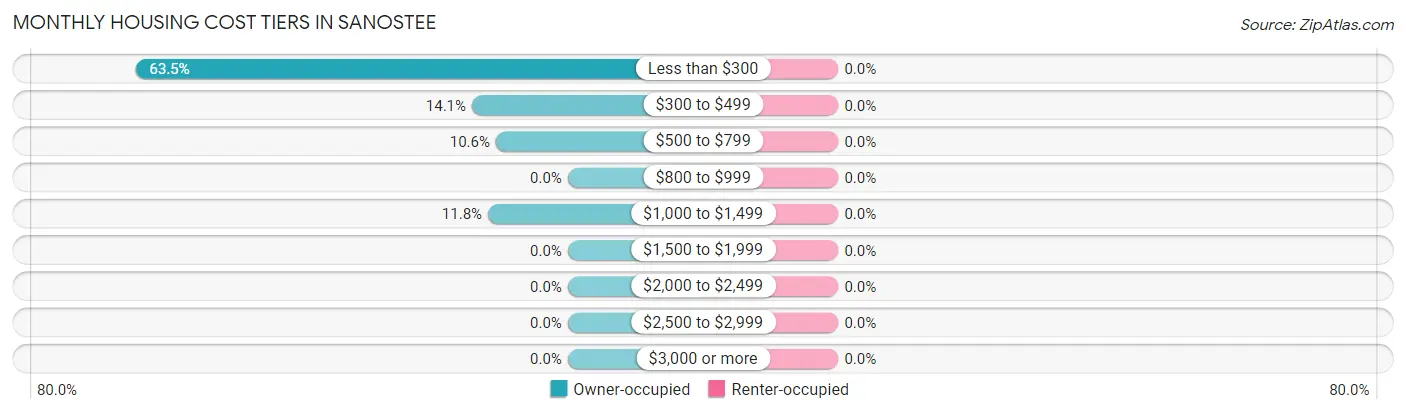
| Monthly Cost | Owner-occupied | Renter-occupied |
| Less than $300 | 54 (63.5%) | 0 (0.0%) |
| $300 to $499 | 12 (14.1%) | 0 (0.0%) |
| $500 to $799 | 9 (10.6%) | 0 (0.0%) |
| $800 to $999 | 0 (0.0%) | 0 (0.0%) |
| $1,000 to $1,499 | 10 (11.8%) | 0 (0.0%) |
| $1,500 to $1,999 | 0 (0.0%) | 0 (0.0%) |
| $2,000 to $2,499 | 0 (0.0%) | 0 (0.0%) |
| $2,500 to $2,999 | 0 (0.0%) | 0 (0.0%) |
| $3,000 or more | 0 (0.0%) | 0 (0.0%) |
| Total | 85 (100.0%) | 4 (100.0%) |
Physical Housing Characteristics in Sanostee
Housing Structures in Sanostee
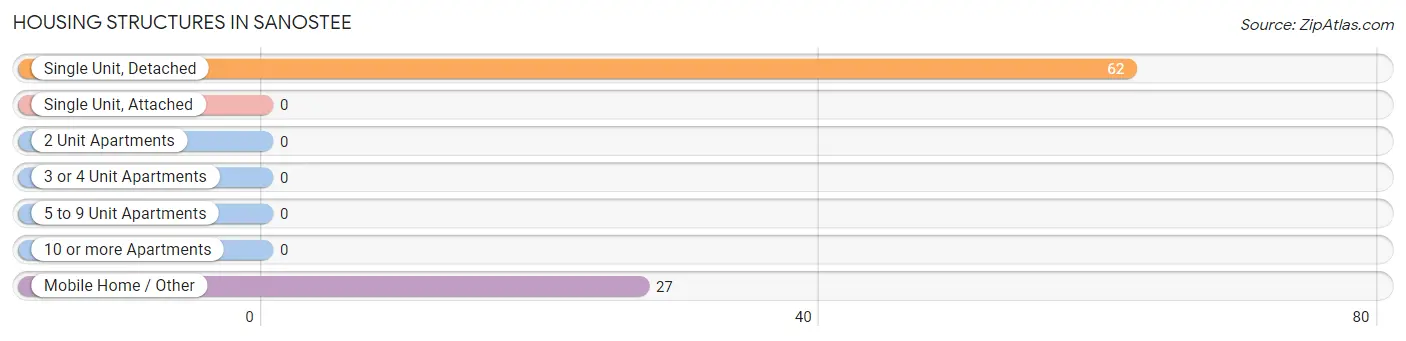
| Structure Type | # Housing Units | % Housing Units |
| Single Unit, Detached | 62 | 69.7% |
| Single Unit, Attached | 0 | 0.0% |
| 2 Unit Apartments | 0 | 0.0% |
| 3 or 4 Unit Apartments | 0 | 0.0% |
| 5 to 9 Unit Apartments | 0 | 0.0% |
| 10 or more Apartments | 0 | 0.0% |
| Mobile Home / Other | 27 | 30.3% |
| Total | 89 | 100.0% |
Housing Structures by Occupancy in Sanostee
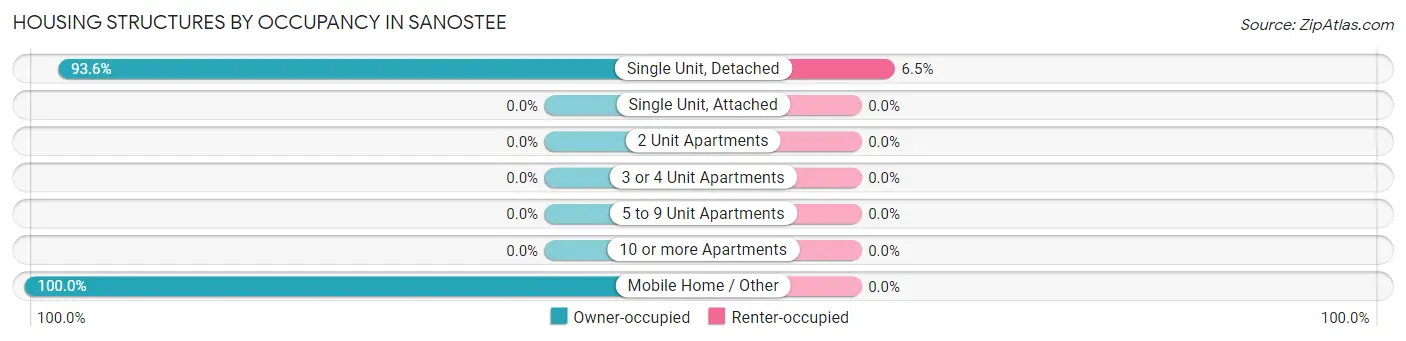
| Structure Type | Owner-occupied | Renter-occupied |
| Single Unit, Detached | 58 (93.5%) | 4 (6.5%) |
| Single Unit, Attached | 0 (0.0%) | 0 (0.0%) |
| 2 Unit Apartments | 0 (0.0%) | 0 (0.0%) |
| 3 or 4 Unit Apartments | 0 (0.0%) | 0 (0.0%) |
| 5 to 9 Unit Apartments | 0 (0.0%) | 0 (0.0%) |
| 10 or more Apartments | 0 (0.0%) | 0 (0.0%) |
| Mobile Home / Other | 27 (100.0%) | 0 (0.0%) |
| Total | 85 (95.5%) | 4 (4.5%) |
Housing Structures by Number of Rooms in Sanostee
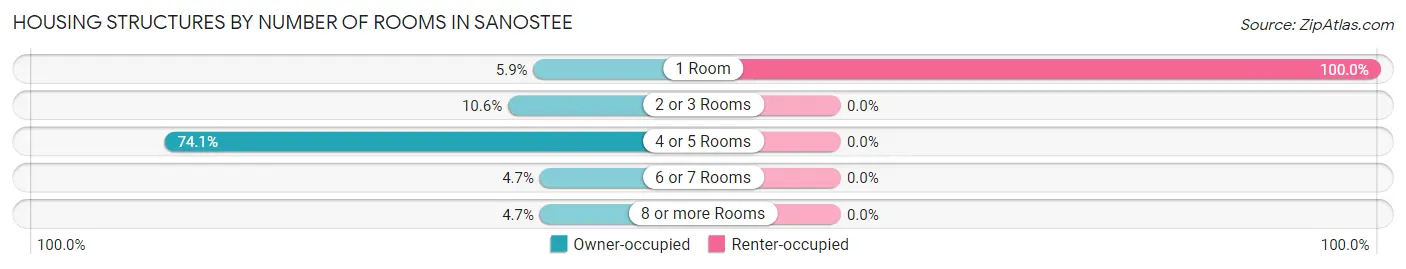
| Number of Rooms | Owner-occupied | Renter-occupied |
| 1 Room | 5 (5.9%) | 4 (100.0%) |
| 2 or 3 Rooms | 9 (10.6%) | 0 (0.0%) |
| 4 or 5 Rooms | 63 (74.1%) | 0 (0.0%) |
| 6 or 7 Rooms | 4 (4.7%) | 0 (0.0%) |
| 8 or more Rooms | 4 (4.7%) | 0 (0.0%) |
| Total | 85 (100.0%) | 4 (100.0%) |
Housing Structure by Heating Type in Sanostee
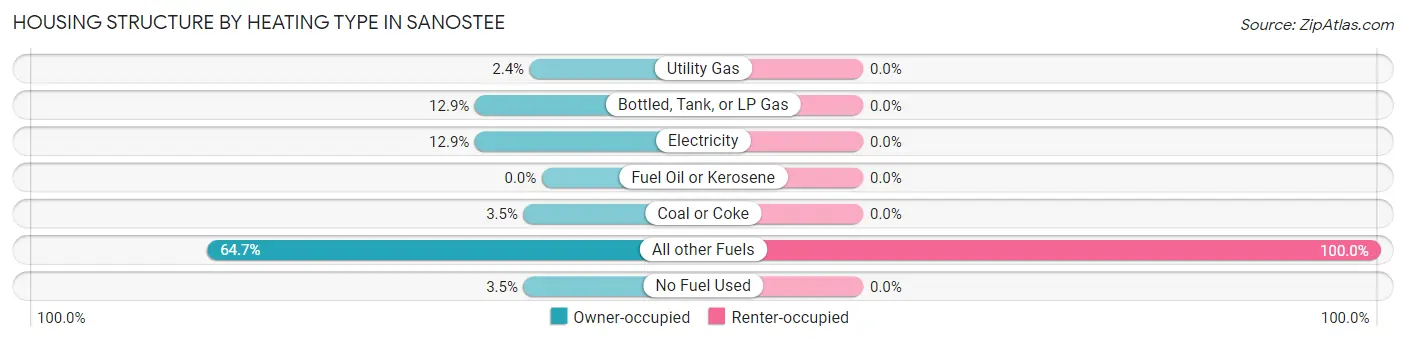
| Heating Type | Owner-occupied | Renter-occupied |
| Utility Gas | 2 (2.4%) | 0 (0.0%) |
| Bottled, Tank, or LP Gas | 11 (12.9%) | 0 (0.0%) |
| Electricity | 11 (12.9%) | 0 (0.0%) |
| Fuel Oil or Kerosene | 0 (0.0%) | 0 (0.0%) |
| Coal or Coke | 3 (3.5%) | 0 (0.0%) |
| All other Fuels | 55 (64.7%) | 4 (100.0%) |
| No Fuel Used | 3 (3.5%) | 0 (0.0%) |
| Total | 85 (100.0%) | 4 (100.0%) |
Household Vehicle Usage in Sanostee
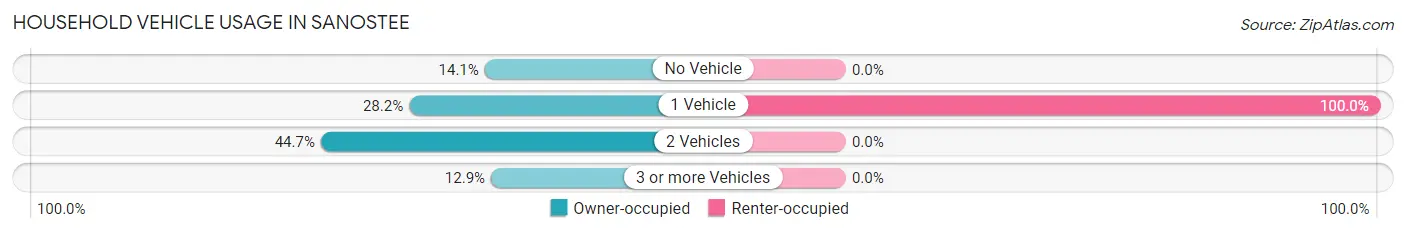
| Vehicles per Household | Owner-occupied | Renter-occupied |
| No Vehicle | 12 (14.1%) | 0 (0.0%) |
| 1 Vehicle | 24 (28.2%) | 4 (100.0%) |
| 2 Vehicles | 38 (44.7%) | 0 (0.0%) |
| 3 or more Vehicles | 11 (12.9%) | 0 (0.0%) |
| Total | 85 (100.0%) | 4 (100.0%) |
Real Estate & Mortgages in Sanostee
Real Estate and Mortgage Overview in Sanostee
| Characteristic | Without Mortgage | With Mortgage |
| Housing Units | 79 | 6 |
| Median Property Value | $41,700 | $0 |
| Median Household Income | $26,458 | $0 |
| Monthly Housing Costs | $252 | $0 |
| Real Estate Taxes | - | - |
Property Value by Mortgage Status in Sanostee
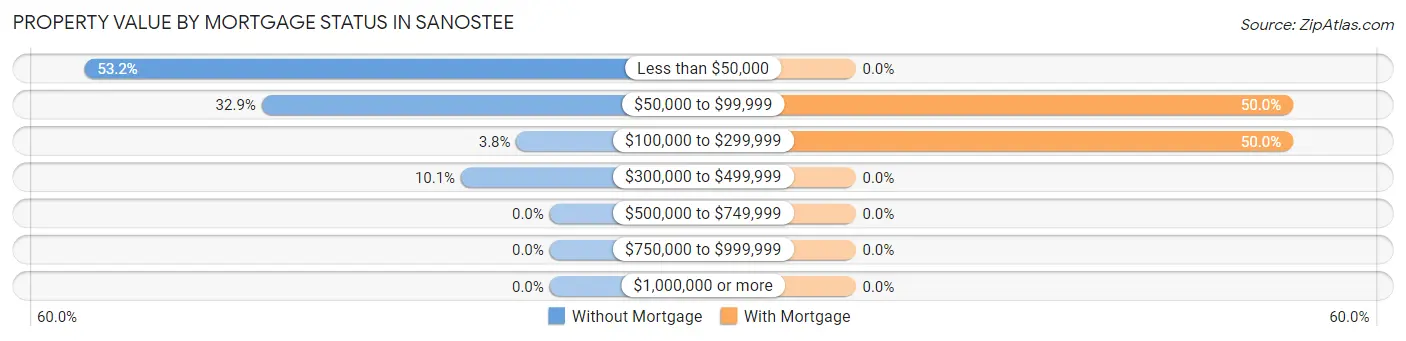
| Property Value | Without Mortgage | With Mortgage |
| Less than $50,000 | 42 (53.2%) | 0 (0.0%) |
| $50,000 to $99,999 | 26 (32.9%) | 3 (50.0%) |
| $100,000 to $299,999 | 3 (3.8%) | 3 (50.0%) |
| $300,000 to $499,999 | 8 (10.1%) | 0 (0.0%) |
| $500,000 to $749,999 | 0 (0.0%) | 0 (0.0%) |
| $750,000 to $999,999 | 0 (0.0%) | 0 (0.0%) |
| $1,000,000 or more | 0 (0.0%) | 0 (0.0%) |
| Total | 79 (100.0%) | 6 (100.0%) |
Household Income by Mortgage Status in Sanostee
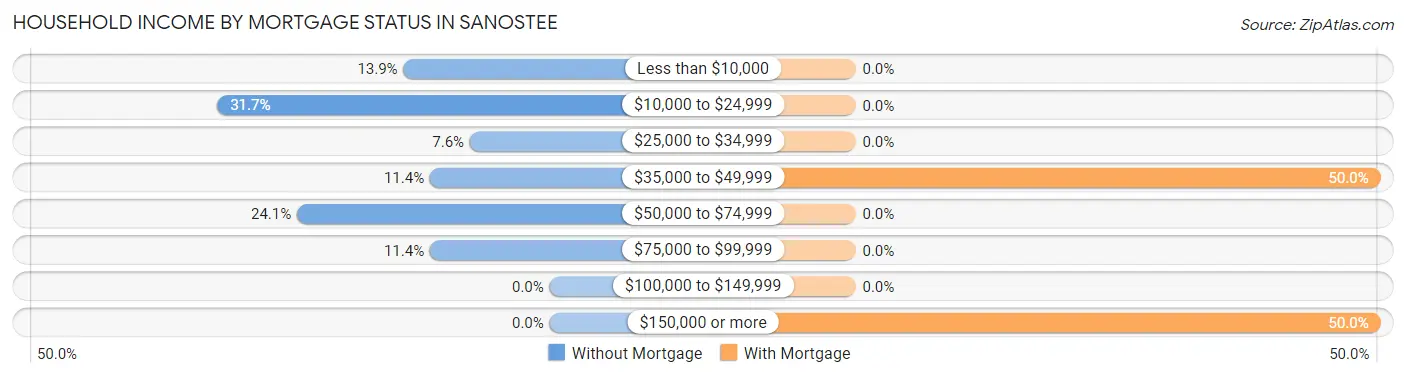
| Household Income | Without Mortgage | With Mortgage |
| Less than $10,000 | 11 (13.9%) | 0 (0.0%) |
| $10,000 to $24,999 | 25 (31.7%) | 0 (0.0%) |
| $25,000 to $34,999 | 6 (7.6%) | 0 (0.0%) |
| $35,000 to $49,999 | 9 (11.4%) | 3 (50.0%) |
| $50,000 to $74,999 | 19 (24.0%) | 0 (0.0%) |
| $75,000 to $99,999 | 9 (11.4%) | 0 (0.0%) |
| $100,000 to $149,999 | 0 (0.0%) | 0 (0.0%) |
| $150,000 or more | 0 (0.0%) | 3 (50.0%) |
| Total | 79 (100.0%) | 6 (100.0%) |
Property Value to Household Income Ratio in Sanostee
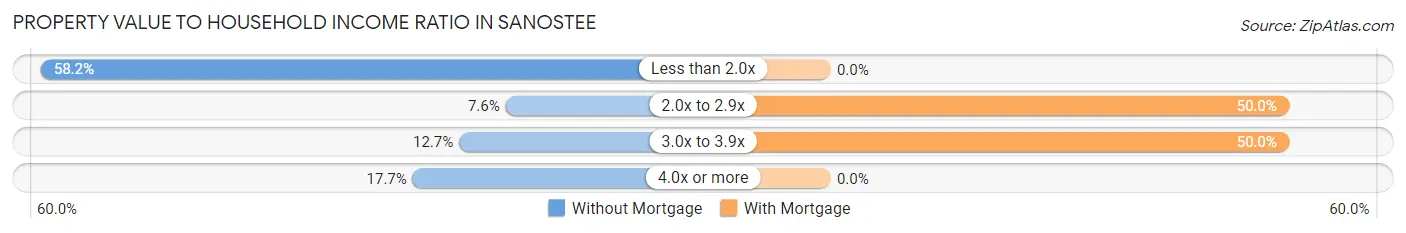
| Value-to-Income Ratio | Without Mortgage | With Mortgage |
| Less than 2.0x | 46 (58.2%) | 0 (0.0%) |
| 2.0x to 2.9x | 6 (7.6%) | 3 (50.0%) |
| 3.0x to 3.9x | 10 (12.7%) | 3 (50.0%) |
| 4.0x or more | 14 (17.7%) | 0 (0.0%) |
| Total | 79 (100.0%) | 6 (100.0%) |
Real Estate Taxes by Mortgage Status in Sanostee
| Property Taxes | Without Mortgage | With Mortgage |
| Less than $800 | 0 (0.0%) | 0 (0.0%) |
| $800 to $1,499 | 0 (0.0%) | 0 (0.0%) |
| $800 to $1,499 | 0 (0.0%) | 0 (0.0%) |
| Total | 79 (100.0%) | 6 (100.0%) |
Health & Disability in Sanostee
Health Insurance Coverage by Age in Sanostee
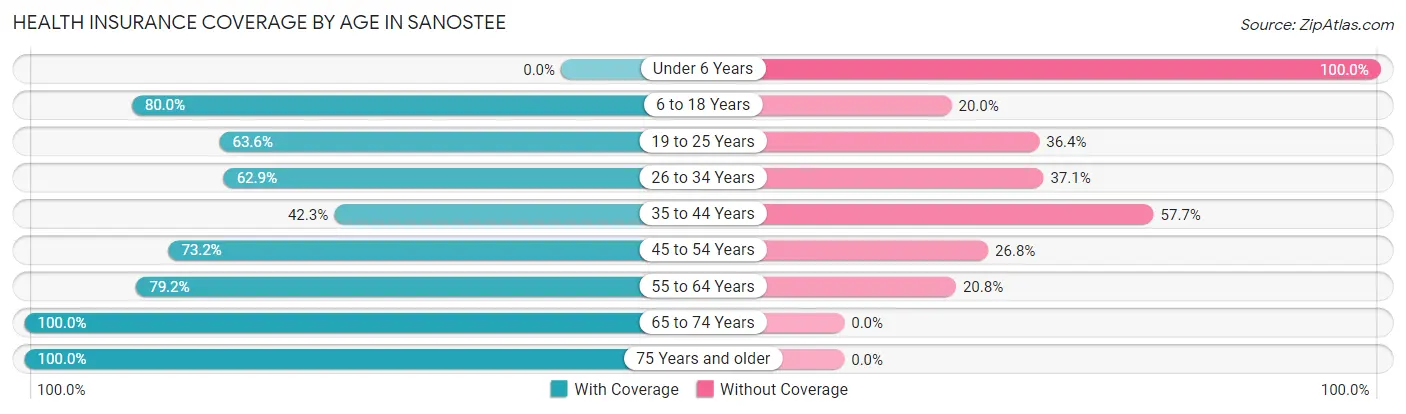
| Age Bracket | With Coverage | Without Coverage |
| Under 6 Years | 0 (0.0%) | 4 (100.0%) |
| 6 to 18 Years | 36 (80.0%) | 9 (20.0%) |
| 19 to 25 Years | 14 (63.6%) | 8 (36.4%) |
| 26 to 34 Years | 22 (62.9%) | 13 (37.1%) |
| 35 to 44 Years | 11 (42.3%) | 15 (57.7%) |
| 45 to 54 Years | 30 (73.2%) | 11 (26.8%) |
| 55 to 64 Years | 38 (79.2%) | 10 (20.8%) |
| 65 to 74 Years | 46 (100.0%) | 0 (0.0%) |
| 75 Years and older | 9 (100.0%) | 0 (0.0%) |
| Total | 206 (74.6%) | 70 (25.4%) |
Health Insurance Coverage by Citizenship Status in Sanostee
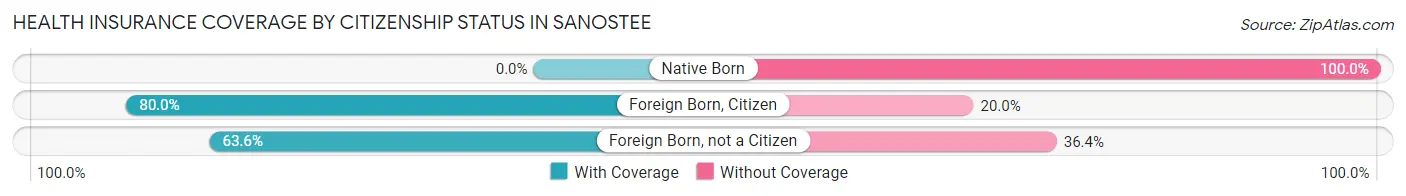
| Citizenship Status | With Coverage | Without Coverage |
| Native Born | 0 (0.0%) | 4 (100.0%) |
| Foreign Born, Citizen | 36 (80.0%) | 9 (20.0%) |
| Foreign Born, not a Citizen | 14 (63.6%) | 8 (36.4%) |
Health Insurance Coverage by Household Income in Sanostee
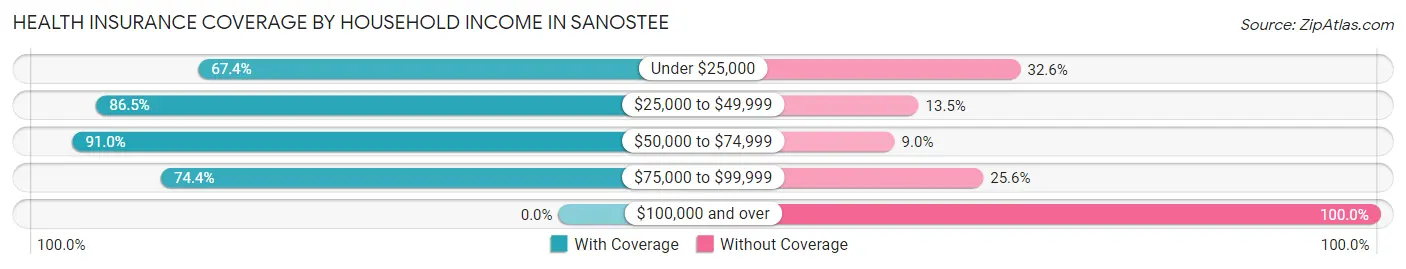
| Household Income | With Coverage | Without Coverage |
| Under $25,000 | 58 (67.4%) | 28 (32.6%) |
| $25,000 to $49,999 | 45 (86.5%) | 7 (13.5%) |
| $50,000 to $74,999 | 71 (91.0%) | 7 (9.0%) |
| $75,000 to $99,999 | 32 (74.4%) | 11 (25.6%) |
| $100,000 and over | 0 (0.0%) | 17 (100.0%) |
Public vs Private Health Insurance Coverage by Age in Sanostee
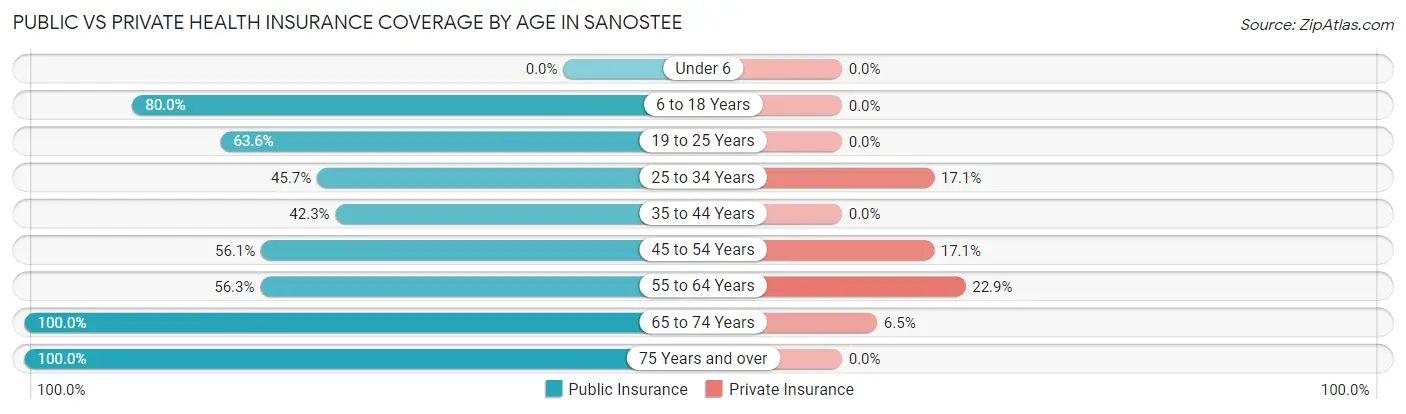
| Age Bracket | Public Insurance | Private Insurance |
| Under 6 | 0 (0.0%) | 0 (0.0%) |
| 6 to 18 Years | 36 (80.0%) | 0 (0.0%) |
| 19 to 25 Years | 14 (63.6%) | 0 (0.0%) |
| 25 to 34 Years | 16 (45.7%) | 6 (17.1%) |
| 35 to 44 Years | 11 (42.3%) | 0 (0.0%) |
| 45 to 54 Years | 23 (56.1%) | 7 (17.1%) |
| 55 to 64 Years | 27 (56.2%) | 11 (22.9%) |
| 65 to 74 Years | 46 (100.0%) | 3 (6.5%) |
| 75 Years and over | 9 (100.0%) | 0 (0.0%) |
| Total | 182 (65.9%) | 27 (9.8%) |
Disability Status by Sex by Age in Sanostee
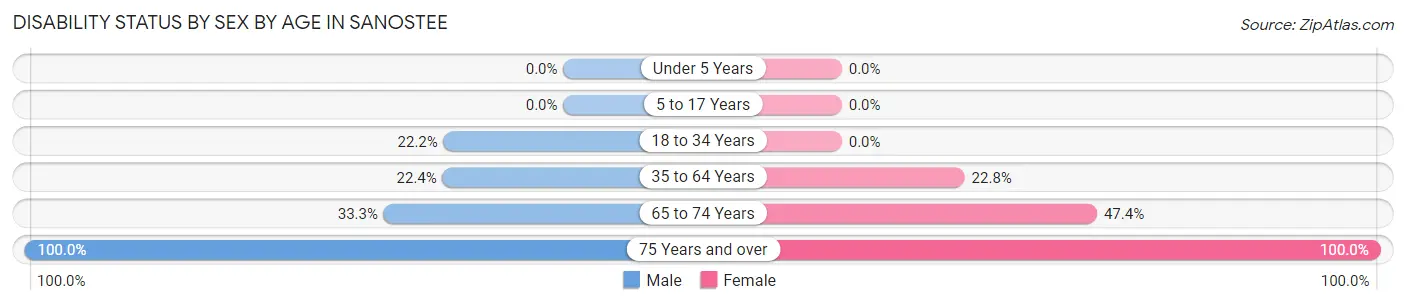
| Age Bracket | Male | Female |
| Under 5 Years | 0 (0.0%) | 0 (0.0%) |
| 5 to 17 Years | 0 (0.0%) | 0 (0.0%) |
| 18 to 34 Years | 6 (22.2%) | 0 (0.0%) |
| 35 to 64 Years | 13 (22.4%) | 13 (22.8%) |
| 65 to 74 Years | 9 (33.3%) | 9 (47.4%) |
| 75 Years and over | 3 (100.0%) | 6 (100.0%) |
Disability Class by Sex by Age in Sanostee
Disability Class: Hearing Difficulty
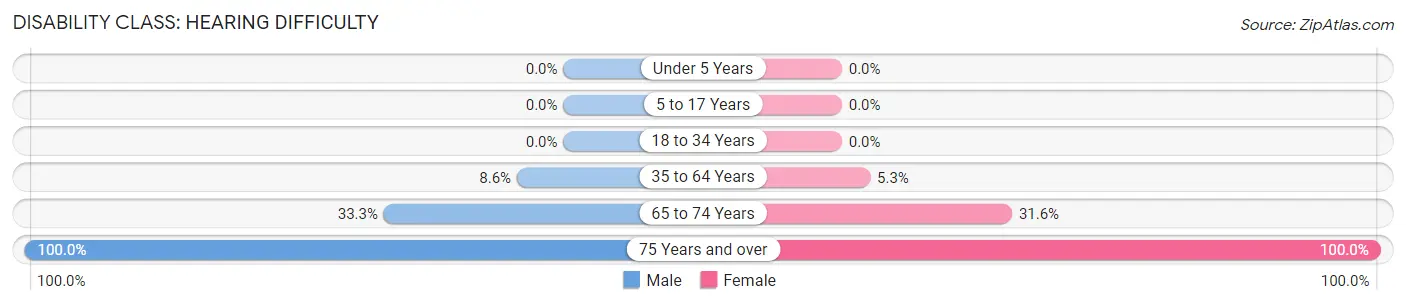
| Age Bracket | Male | Female |
| Under 5 Years | 0 (0.0%) | 0 (0.0%) |
| 5 to 17 Years | 0 (0.0%) | 0 (0.0%) |
| 18 to 34 Years | 0 (0.0%) | 0 (0.0%) |
| 35 to 64 Years | 5 (8.6%) | 3 (5.3%) |
| 65 to 74 Years | 9 (33.3%) | 6 (31.6%) |
| 75 Years and over | 3 (100.0%) | 6 (100.0%) |
Disability Class: Vision Difficulty
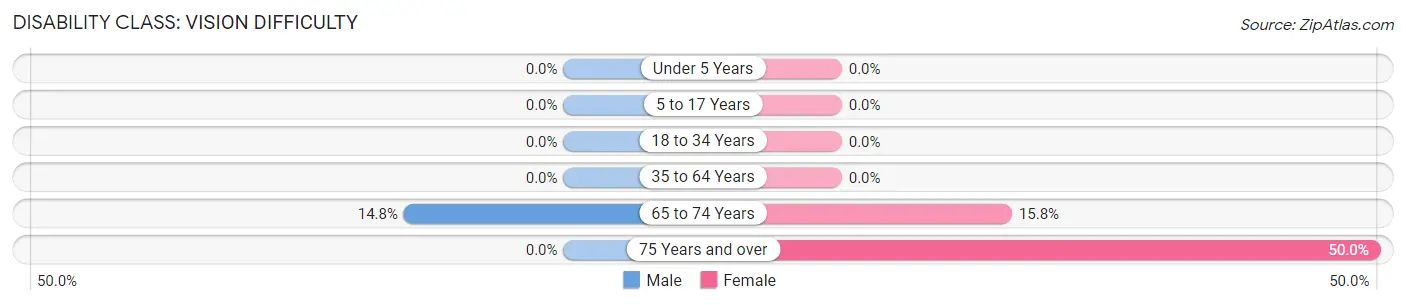
| Age Bracket | Male | Female |
| Under 5 Years | 0 (0.0%) | 0 (0.0%) |
| 5 to 17 Years | 0 (0.0%) | 0 (0.0%) |
| 18 to 34 Years | 0 (0.0%) | 0 (0.0%) |
| 35 to 64 Years | 0 (0.0%) | 0 (0.0%) |
| 65 to 74 Years | 4 (14.8%) | 3 (15.8%) |
| 75 Years and over | 0 (0.0%) | 3 (50.0%) |
Disability Class: Cognitive Difficulty
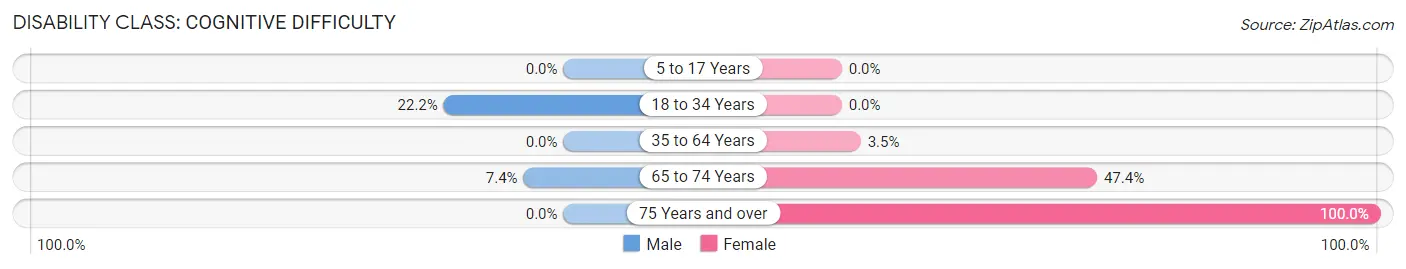
| Age Bracket | Male | Female |
| 5 to 17 Years | 0 (0.0%) | 0 (0.0%) |
| 18 to 34 Years | 6 (22.2%) | 0 (0.0%) |
| 35 to 64 Years | 0 (0.0%) | 2 (3.5%) |
| 65 to 74 Years | 2 (7.4%) | 9 (47.4%) |
| 75 Years and over | 0 (0.0%) | 6 (100.0%) |
Disability Class: Ambulatory Difficulty
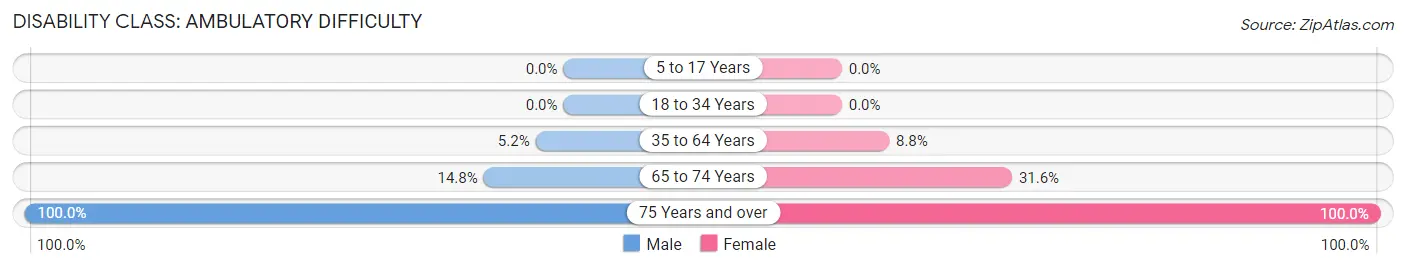
| Age Bracket | Male | Female |
| 5 to 17 Years | 0 (0.0%) | 0 (0.0%) |
| 18 to 34 Years | 0 (0.0%) | 0 (0.0%) |
| 35 to 64 Years | 3 (5.2%) | 5 (8.8%) |
| 65 to 74 Years | 4 (14.8%) | 6 (31.6%) |
| 75 Years and over | 3 (100.0%) | 6 (100.0%) |
Disability Class: Self-Care Difficulty
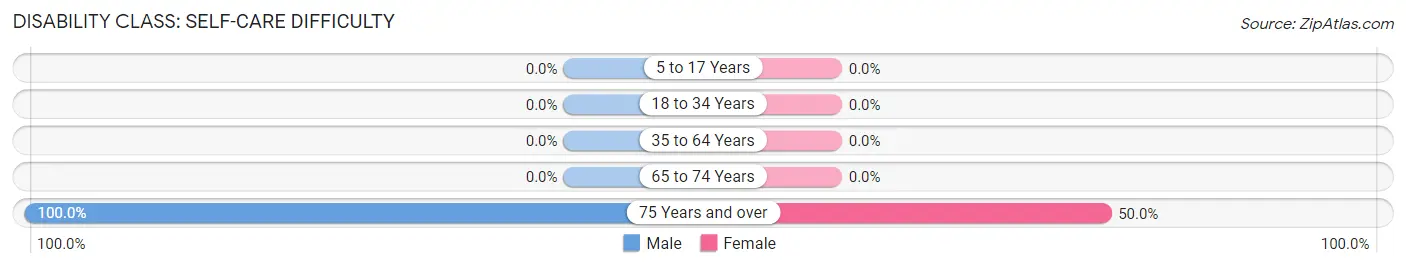
| Age Bracket | Male | Female |
| 5 to 17 Years | 0 (0.0%) | 0 (0.0%) |
| 18 to 34 Years | 0 (0.0%) | 0 (0.0%) |
| 35 to 64 Years | 0 (0.0%) | 0 (0.0%) |
| 65 to 74 Years | 0 (0.0%) | 0 (0.0%) |
| 75 Years and over | 3 (100.0%) | 3 (50.0%) |
Technology Access in Sanostee
Computing Device Access in Sanostee
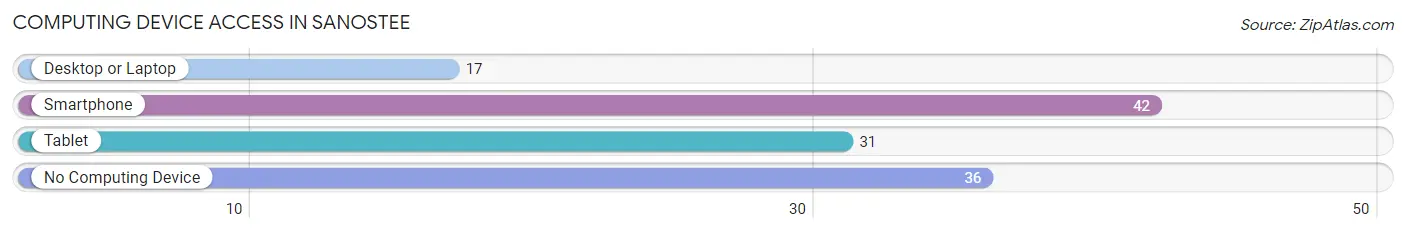
| Device Type | # Households | % Households |
| Desktop or Laptop | 17 | 19.1% |
| Smartphone | 42 | 47.2% |
| Tablet | 31 | 34.8% |
| No Computing Device | 36 | 40.5% |
| Total | 89 | 100.0% |
Internet Access in Sanostee
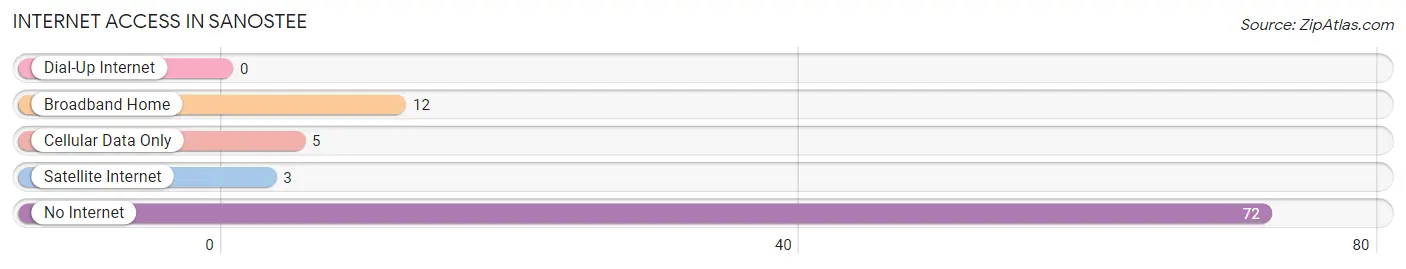
| Internet Type | # Households | % Households |
| Dial-Up Internet | 0 | 0.0% |
| Broadband Home | 12 | 13.5% |
| Cellular Data Only | 5 | 5.6% |
| Satellite Internet | 3 | 3.4% |
| No Internet | 72 | 80.9% |
| Total | 89 | 100.0% |
Sanostee Summary
Sanostee is a small unincorporated community located in San Juan County, New Mexico. It is situated in the northwestern corner of the state, near the Four Corners region. The town is located on the Navajo Nation, and is home to a population of approximately 500 people.
History
Sanostee was established in the late 1800s as a trading post for the Navajo people. The town was originally known as “Sanostee Trading Post”, and was located on the San Juan River. The trading post was a popular destination for Navajo people, who would come to trade goods and services.
In the early 1900s, the trading post was replaced by a general store, which served as the main source of supplies for the local Navajo population. The store was owned and operated by a local family, and was the only store in the area for many years.
In the mid-1900s, the town began to grow and develop. A post office was established in the 1950s, and a school was built in the 1960s. The town also began to attract more visitors, as it was located near the Four Corners region.
Geography
Sanostee is located in the northwestern corner of New Mexico, near the Four Corners region. The town is situated on the Navajo Nation, and is surrounded by the San Juan River. The town is located at an elevation of 5,400 feet, and has a total area of 0.3 square miles.
The climate in Sanostee is semi-arid, with hot summers and cold winters. The average annual temperature is around 50 degrees Fahrenheit, and the average annual precipitation is around 10 inches.
Economy
The economy of Sanostee is largely based on tourism and agriculture. The town is a popular destination for tourists, who come to explore the nearby Four Corners region. The town also has a number of small businesses, including a general store, a post office, and a school.
Agriculture is also an important part of the local economy. The town is home to a number of farms, which produce a variety of crops, including corn, wheat, and hay.
Demographics
As of the 2010 census, the population of Sanostee was 498. The town is predominantly Native American, with the majority of the population being Navajo. The median household income in the town is $25,000, and the median age is 33.
Conclusion
Sanostee is a small unincorporated community located in San Juan County, New Mexico. It is situated in the northwestern corner of the state, near the Four Corners region. The town is located on the Navajo Nation, and is home to a population of approximately 500 people. The economy of Sanostee is largely based on tourism and agriculture, and the town is a popular destination for tourists. The town is predominantly Native American, with the majority of the population being Navajo.
Common Questions
What is Per Capita Income in Sanostee?
Per Capita income in Sanostee is $15,376.
What is the Median Family Income in Sanostee?
Median Family Income in Sanostee is $44,167.
What is the Median Household income in Sanostee?
Median Household Income in Sanostee is $26,875.
What is Income or Wage Gap in Sanostee?
Income or Wage Gap in Sanostee is 50.6%.
Women in Sanostee earn 49.4 cents for every dollar earned by a man.
What is Inequality or Gini Index in Sanostee?
Inequality or Gini Index in Sanostee is 0.43.
What is the Total Population of Sanostee?
Total Population of Sanostee is 276.
What is the Total Male Population of Sanostee?
Total Male Population of Sanostee is 142.
What is the Total Female Population of Sanostee?
Total Female Population of Sanostee is 134.
What is the Ratio of Males per 100 Females in Sanostee?
There are 105.97 Males per 100 Females in Sanostee.
What is the Ratio of Females per 100 Males in Sanostee?
There are 94.37 Females per 100 Males in Sanostee.
What is the Median Population Age in Sanostee?
Median Population Age in Sanostee is 45.8 Years.
What is the Average Family Size in Sanostee
Average Family Size in Sanostee is 3.8 People.
What is the Average Household Size in Sanostee
Average Household Size in Sanostee is 3.1 People.
How Large is the Labor Force in Sanostee?
There are 65 People in the Labor Forcein in Sanostee.
What is the Percentage of People in the Labor Force in Sanostee?
27.0% of People are in the Labor Force in Sanostee.
What is the Unemployment Rate in Sanostee?
Unemployment Rate in Sanostee is 9.2%.