Zip Codes with the Highest Percentage of Population Employed in Food Preparation & Serving in Las Cruces, NM
RELATED REPORTS & OPTIONS
Food Preparation & Serving
Las Cruces
Compare Zip Codes
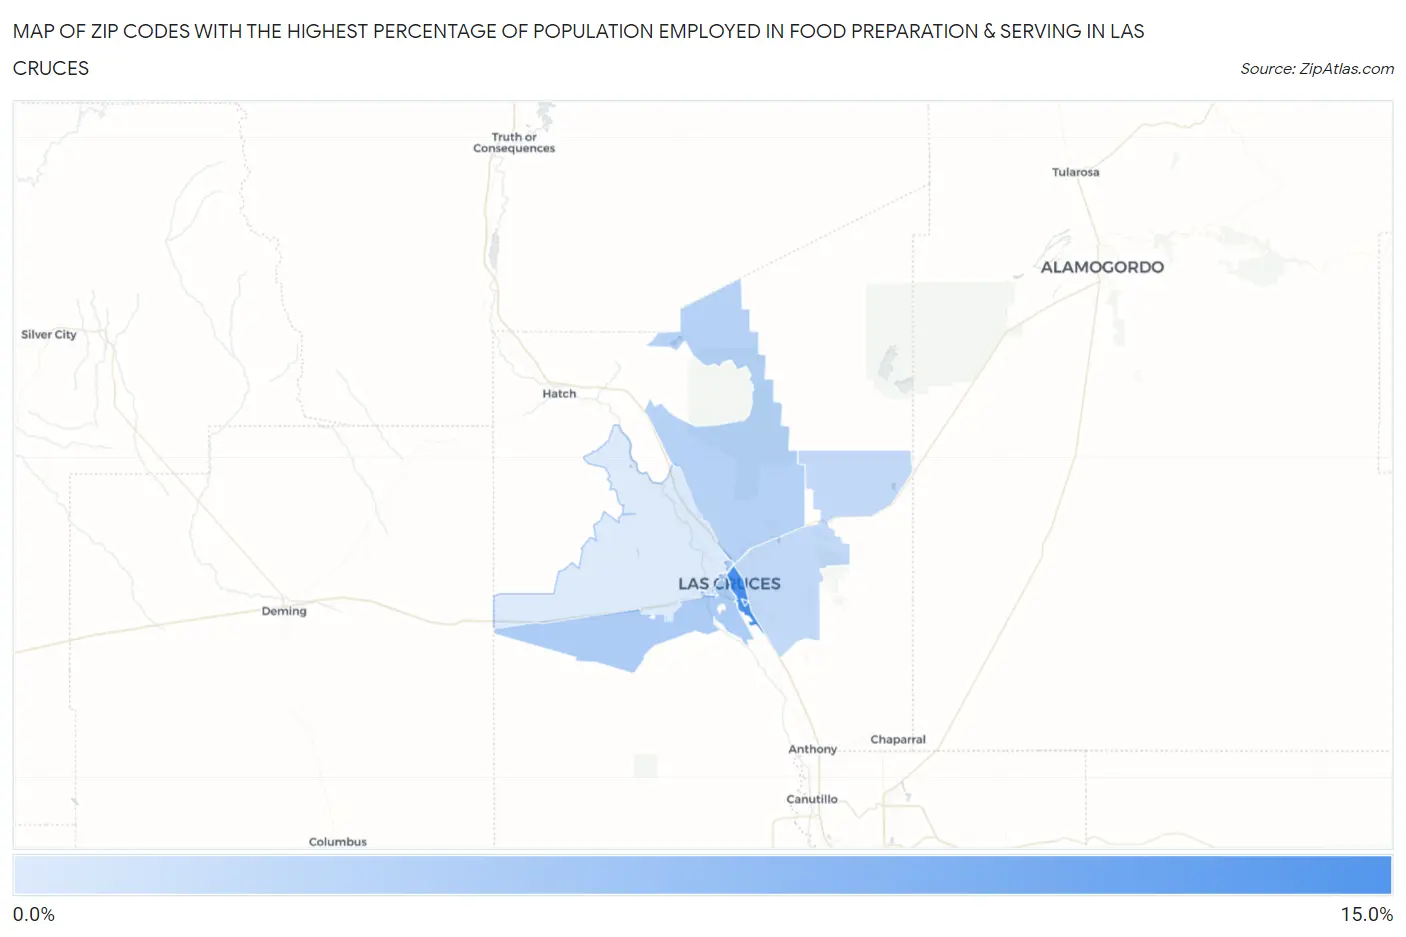
Map of Zip Codes with the Highest Percentage of Population Employed in Food Preparation & Serving in Las Cruces
3.4%
10.4%
Zip Codes with the Highest Percentage of Population Employed in Food Preparation & Serving in Las Cruces, NM
| Zip Code | % Employed | vs State | vs National | |
| 1. | 88001 | 10.4% | 5.8%(+4.66)#36 | 5.3%(+5.13)#2,367 |
| 2. | 88003 | 10.4% | 5.8%(+4.65)#37 | 5.3%(+5.12)#2,370 |
| 3. | 88005 | 5.6% | 5.8%(-0.133)#122 | 5.3%(+0.336)#10,633 |
| 4. | 88012 | 5.2% | 5.8%(-0.601)#130 | 5.3%(-0.131)#12,345 |
| 5. | 88011 | 4.7% | 5.8%(-1.10)#144 | 5.3%(-0.634)#14,359 |
| 6. | 88007 | 3.4% | 5.8%(-2.38)#171 | 5.3%(-1.91)#19,701 |
1
Common Questions
What are the Top 5 Zip Codes with the Highest Percentage of Population Employed in Food Preparation & Serving in Las Cruces, NM?
Top 5 Zip Codes with the Highest Percentage of Population Employed in Food Preparation & Serving in Las Cruces, NM are:
What zip code has the Highest Percentage of Population Employed in Food Preparation & Serving in Las Cruces, NM?
88001 has the Highest Percentage of Population Employed in Food Preparation & Serving in Las Cruces, NM with 10.4%.
What is the Percentage of Population Employed in Food Preparation & Serving in Las Cruces, NM?
Percentage of Population Employed in Food Preparation & Serving in Las Cruces is 6.1%.
What is the Percentage of Population Employed in Food Preparation & Serving in New Mexico?
Percentage of Population Employed in Food Preparation & Serving in New Mexico is 5.8%.
What is the Percentage of Population Employed in Food Preparation & Serving in the United States?
Percentage of Population Employed in Food Preparation & Serving in the United States is 5.3%.