Mora, NM Map & Demographics
Mora Map
Mora Overview
$18,541
PER CAPITA INCOME
$70,670
AVG FAMILY INCOME
$64,375
AVG HOUSEHOLD INCOME
0.33
INEQUALITY / GINI INDEX
793
TOTAL POPULATION
337
MALE POPULATION
456
FEMALE POPULATION
73.90
MALES / 100 FEMALES
135.31
FEMALES / 100 MALES
53.4
MEDIAN AGE
3.4
AVG FAMILY SIZE
3.0
AVG HOUSEHOLD SIZE
371
LABOR FORCE [ PEOPLE ]
53.6%
PERCENT IN LABOR FORCE
Mora Zip Codes
Mora Area Codes
Income in Mora
Income Overview in Mora
Per Capita Income in Mora is $18,541, while median incomes of families and households are $70,670 and $64,375 respectively.
| Characteristic | Number | Measure |
| Per Capita Income | 793 | $18,541 |
| Median Family Income | 219 | $70,670 |
| Mean Family Income | 219 | $65,139 |
| Median Household Income | 269 | $64,375 |
| Mean Household Income | 269 | $54,483 |
| Income Deficit | 219 | $0 |
| Wage / Income Gap (%) | 793 | 0.00% |
| Wage / Income Gap ($) | 793 | 100.00¢ per $1 |
| Gini / Inequality Index | 793 | 0.33 |
Earnings by Sex in Mora
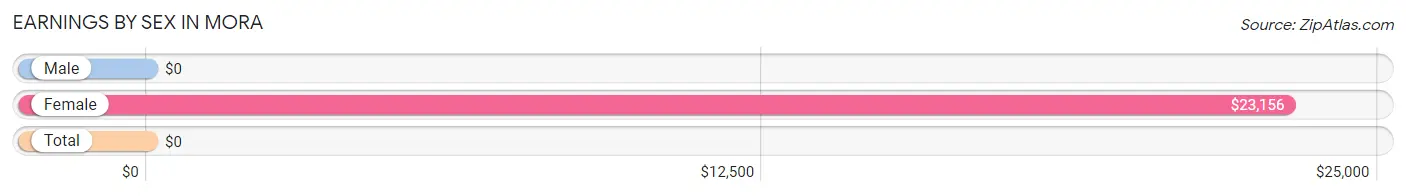
| Sex | Number | Average Earnings |
| Male | 79 (21.8%) | $0 |
| Female | 284 (78.2%) | $23,156 |
| Total | 363 (100.0%) | $0 |
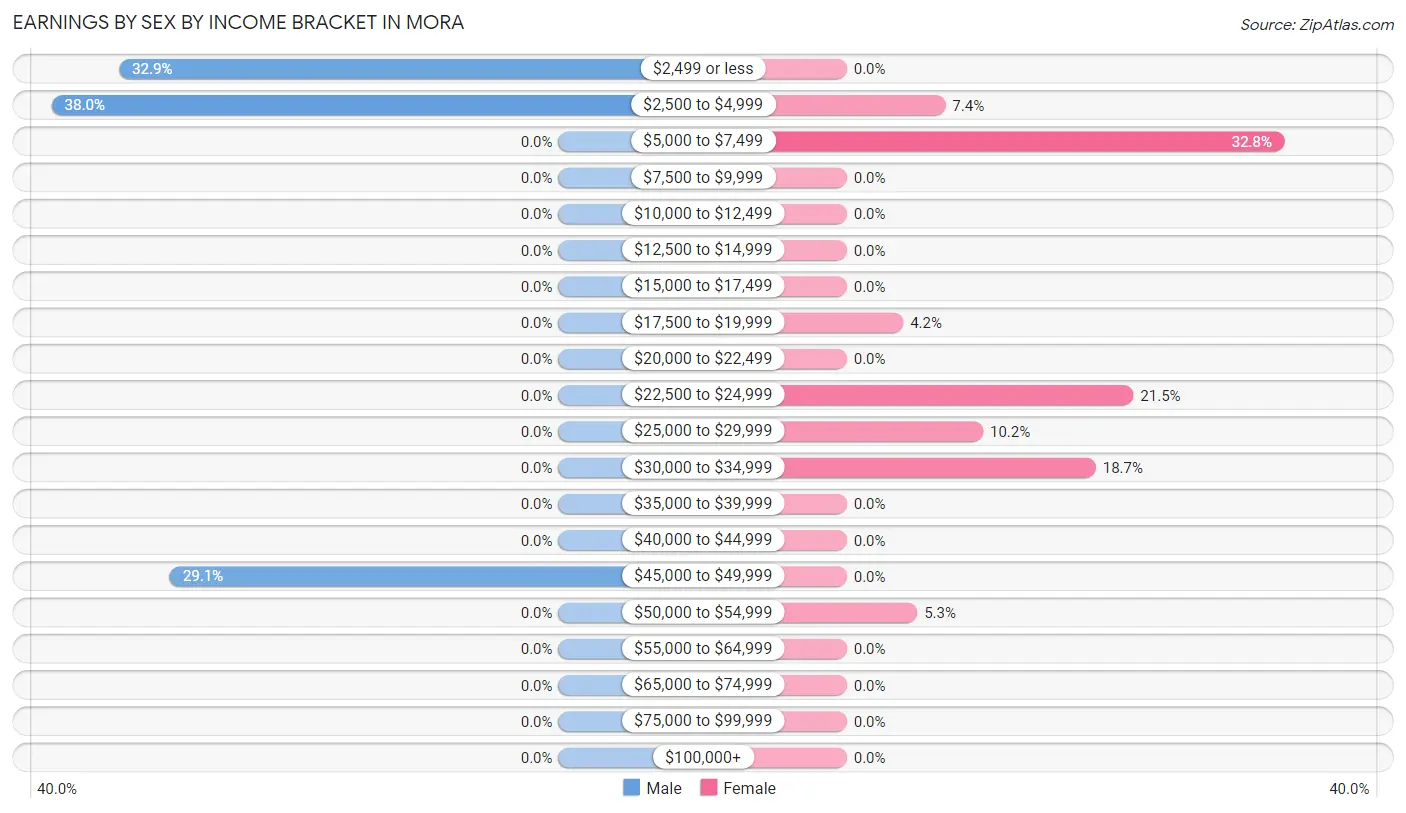
Earnings by Sex by Income Bracket in Mora
The most common earnings brackets in Mora are $2,500 to $4,999 for men (30 | 38.0%) and $5,000 to $7,499 for women (93 | 32.8%).
| Income | Male | Female |
| $2,499 or less | 26 (32.9%) | 0 (0.0%) |
| $2,500 to $4,999 | 30 (38.0%) | 21 (7.4%) |
| $5,000 to $7,499 | 0 (0.0%) | 93 (32.8%) |
| $7,500 to $9,999 | 0 (0.0%) | 0 (0.0%) |
| $10,000 to $12,499 | 0 (0.0%) | 0 (0.0%) |
| $12,500 to $14,999 | 0 (0.0%) | 0 (0.0%) |
| $15,000 to $17,499 | 0 (0.0%) | 0 (0.0%) |
| $17,500 to $19,999 | 0 (0.0%) | 12 (4.2%) |
| $20,000 to $22,499 | 0 (0.0%) | 0 (0.0%) |
| $22,500 to $24,999 | 0 (0.0%) | 61 (21.5%) |
| $25,000 to $29,999 | 0 (0.0%) | 29 (10.2%) |
| $30,000 to $34,999 | 0 (0.0%) | 53 (18.7%) |
| $35,000 to $39,999 | 0 (0.0%) | 0 (0.0%) |
| $40,000 to $44,999 | 0 (0.0%) | 0 (0.0%) |
| $45,000 to $49,999 | 23 (29.1%) | 0 (0.0%) |
| $50,000 to $54,999 | 0 (0.0%) | 15 (5.3%) |
| $55,000 to $64,999 | 0 (0.0%) | 0 (0.0%) |
| $65,000 to $74,999 | 0 (0.0%) | 0 (0.0%) |
| $75,000 to $99,999 | 0 (0.0%) | 0 (0.0%) |
| $100,000+ | 0 (0.0%) | 0 (0.0%) |
| Total | 79 (100.0%) | 284 (100.0%) |
Earnings by Sex by Educational Attainment in Mora
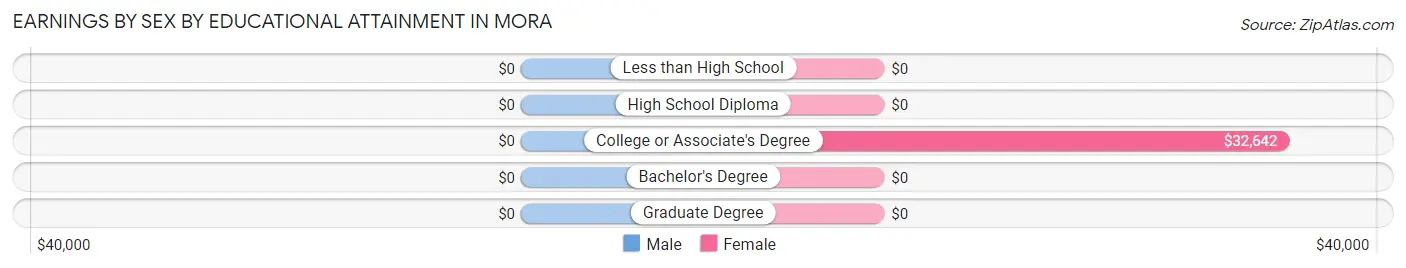
| Educational Attainment | Male Income | Female Income |
| Less than High School | - | - |
| High School Diploma | - | - |
| College or Associate's Degree | - | - |
| Bachelor's Degree | - | - |
| Graduate Degree | - | - |
| Total | - | - |
Family Income in Mora
Family Income Brackets in Mora
According to the Mora family income data, there are 110 families falling into the $50,000 to $74,999 income range, which is the most common income bracket and makes up 50.2% of all families.
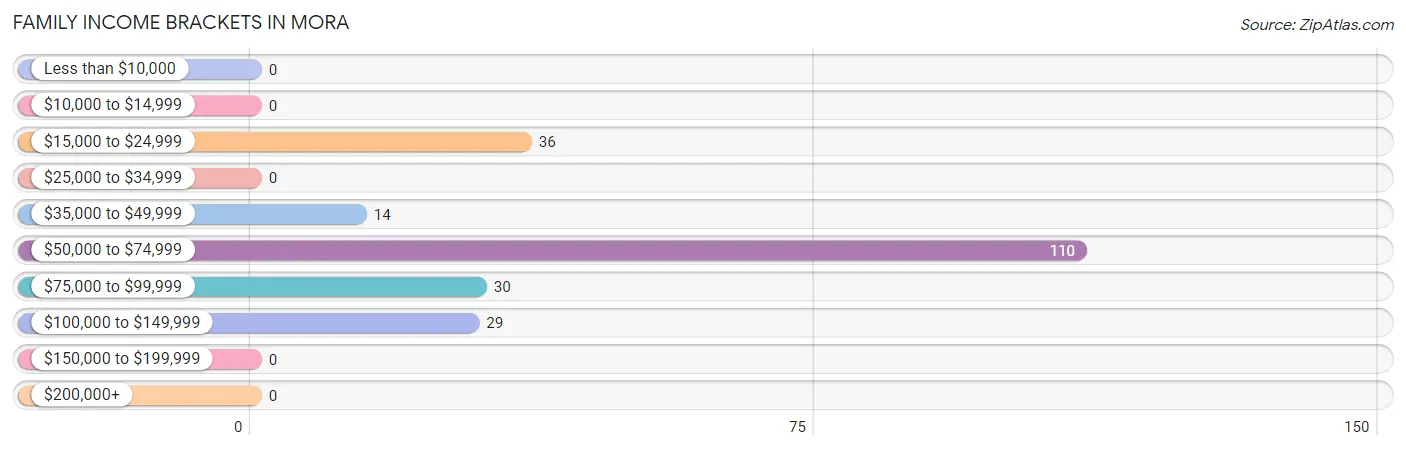
| Income Bracket | # Families | % Families |
| Less than $10,000 | 0 | 0.0% |
| $10,000 to $14,999 | 0 | 0.0% |
| $15,000 to $24,999 | 36 | 16.4% |
| $25,000 to $34,999 | 0 | 0.0% |
| $35,000 to $49,999 | 14 | 6.4% |
| $50,000 to $74,999 | 110 | 50.2% |
| $75,000 to $99,999 | 30 | 13.7% |
| $100,000 to $149,999 | 29 | 13.2% |
| $150,000 to $199,999 | 0 | 0.0% |
| $200,000+ | 0 | 0.0% |
Family Income by Famaliy Size in Mora
4-person families (74 | 33.8%) account for the highest median family income in Mora with $86,833 per family, while 2-person families (131 | 59.8%) have the highest median income of $35,064 per family member.
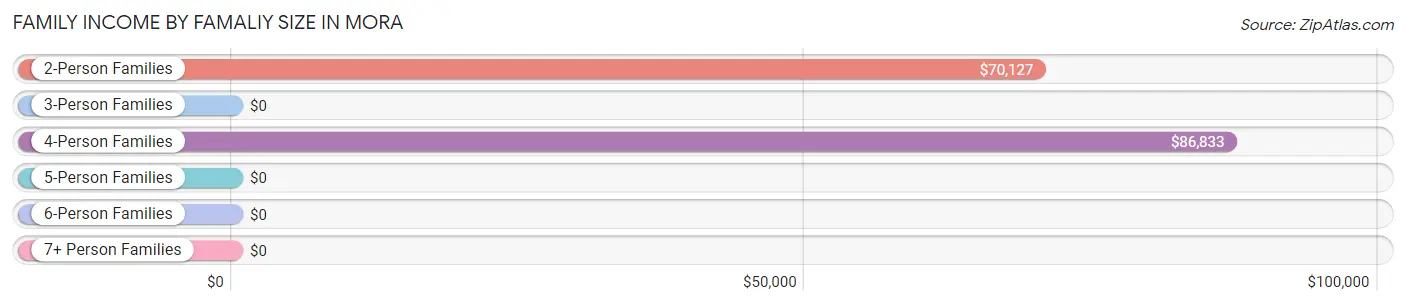
| Income Bracket | # Families | Median Income |
| 2-Person Families | 131 (59.8%) | $70,127 |
| 3-Person Families | 14 (6.4%) | $0 |
| 4-Person Families | 74 (33.8%) | $86,833 |
| 5-Person Families | 0 (0.0%) | $0 |
| 6-Person Families | 0 (0.0%) | $0 |
| 7+ Person Families | 0 (0.0%) | $0 |
| Total | 219 (100.0%) | $70,670 |
Family Income by Number of Earners in Mora
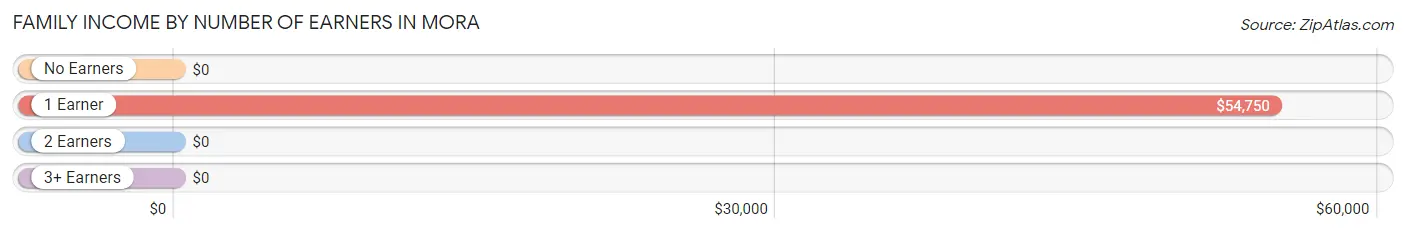
| Number of Earners | # Families | Median Income |
| No Earners | 93 (42.5%) | $0 |
| 1 Earner | 55 (25.1%) | $54,750 |
| 2 Earners | 42 (19.2%) | $0 |
| 3+ Earners | 29 (13.2%) | $0 |
| Total | 219 (100.0%) | $70,670 |
Household Income in Mora
Household Income Brackets in Mora
With 110 households falling in the category, the $50,000 to $74,999 income range is the most frequent in Mora, accounting for 40.9% of all households.
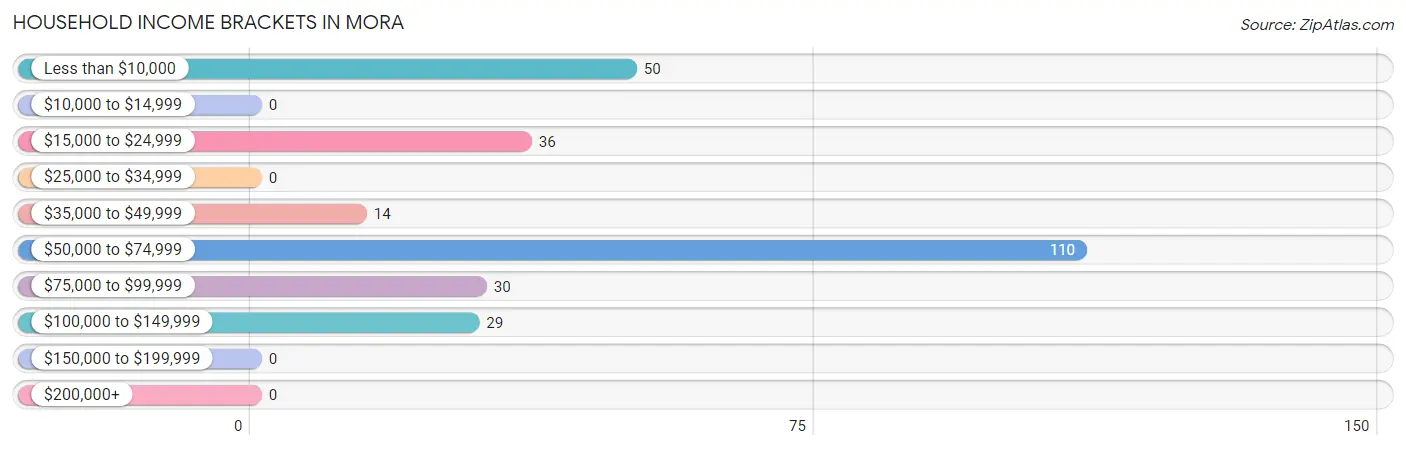
| Income Bracket | # Households | % Households |
| Less than $10,000 | 50 | 18.6% |
| $10,000 to $14,999 | 0 | 0.0% |
| $15,000 to $24,999 | 36 | 13.4% |
| $25,000 to $34,999 | 0 | 0.0% |
| $35,000 to $49,999 | 14 | 5.2% |
| $50,000 to $74,999 | 110 | 40.9% |
| $75,000 to $99,999 | 30 | 11.2% |
| $100,000 to $149,999 | 29 | 10.8% |
| $150,000 to $199,999 | 0 | 0.0% |
| $200,000+ | 0 | 0.0% |
Household Income by Householder Age in Mora
The median household income in Mora is $64,375, with the highest median household income of $70,344 found in the 65+ years age bracket for the primary householder. A total of 119 households (44.2%) fall into this category.
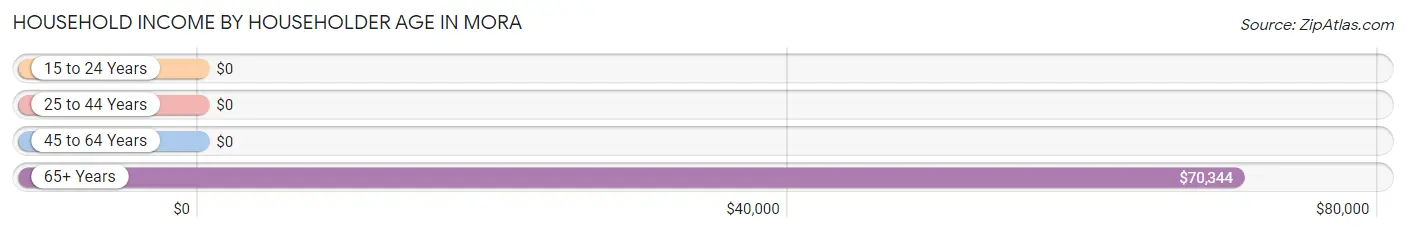
| Income Bracket | # Households | Median Income |
| 15 to 24 Years | 0 (0.0%) | $0 |
| 25 to 44 Years | 15 (5.6%) | $0 |
| 45 to 64 Years | 135 (50.2%) | $0 |
| 65+ Years | 119 (44.2%) | $70,344 |
| Total | 269 (100.0%) | $64,375 |
Poverty in Mora
Income Below Poverty by Sex and Age in Mora
With 22.0% poverty level for males and 4.4% for females among the residents of Mora, 75 year old and over males and 75 year old and over females are the most vulnerable to poverty, with 24 males (64.9%) and 20 females (100.0%) in their respective age groups living below the poverty level.
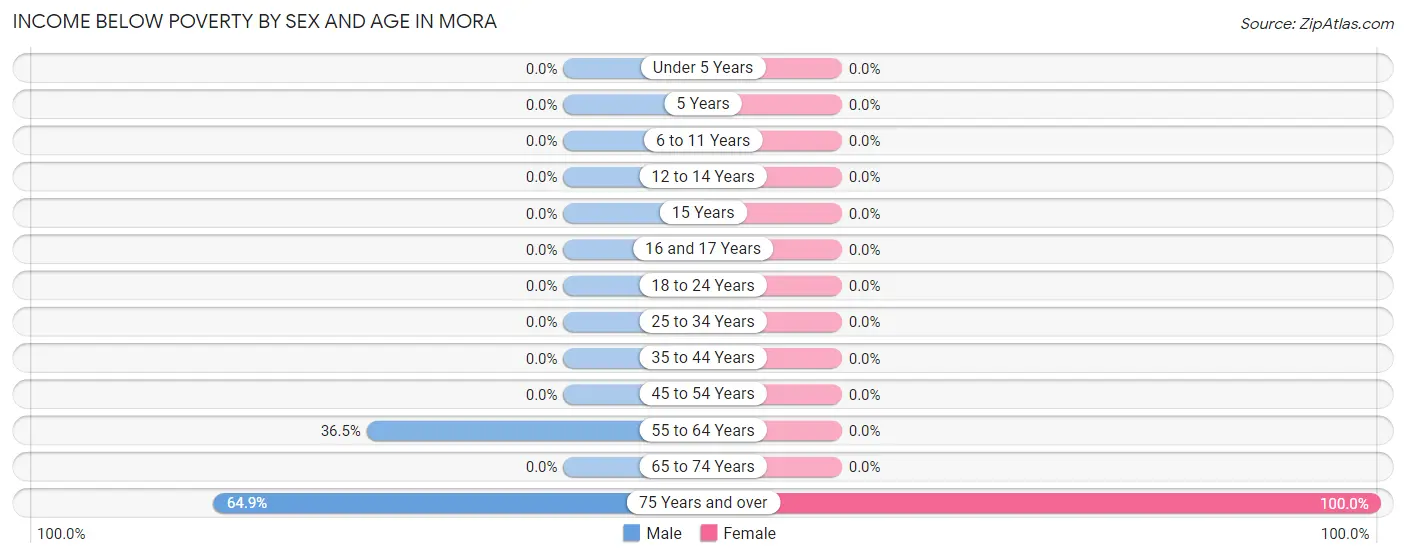
| Age Bracket | Male | Female |
| Under 5 Years | 0 (0.0%) | 0 (0.0%) |
| 5 Years | 0 (0.0%) | 0 (0.0%) |
| 6 to 11 Years | 0 (0.0%) | 0 (0.0%) |
| 12 to 14 Years | 0 (0.0%) | 0 (0.0%) |
| 15 Years | 0 (0.0%) | 0 (0.0%) |
| 16 and 17 Years | 0 (0.0%) | 0 (0.0%) |
| 18 to 24 Years | 0 (0.0%) | 0 (0.0%) |
| 25 to 34 Years | 0 (0.0%) | 0 (0.0%) |
| 35 to 44 Years | 0 (0.0%) | 0 (0.0%) |
| 45 to 54 Years | 0 (0.0%) | 0 (0.0%) |
| 55 to 64 Years | 50 (36.5%) | 0 (0.0%) |
| 65 to 74 Years | 0 (0.0%) | 0 (0.0%) |
| 75 Years and over | 24 (64.9%) | 20 (100.0%) |
| Total | 74 (22.0%) | 20 (4.4%) |
Income Above Poverty by Sex and Age in Mora
According to the poverty statistics in Mora, males aged 6 to 11 years and females aged 6 to 11 years are the age groups that are most secure financially, with 100.0% of males and 100.0% of females in these age groups living above the poverty line.
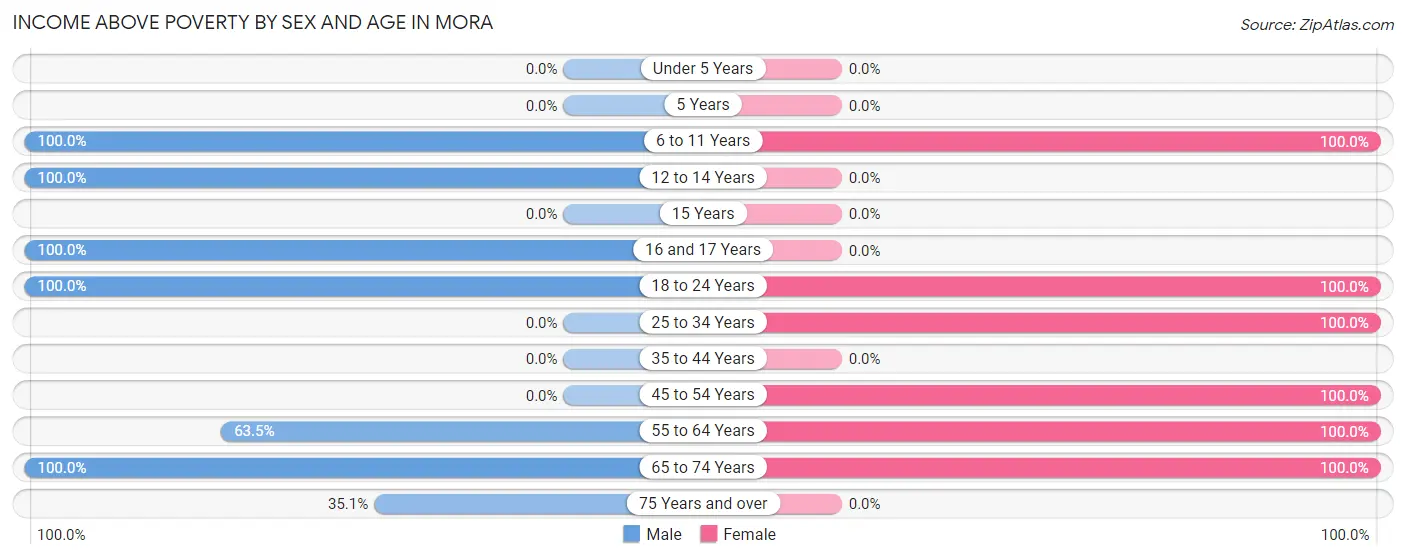
| Age Bracket | Male | Female |
| Under 5 Years | 0 (0.0%) | 0 (0.0%) |
| 5 Years | 0 (0.0%) | 0 (0.0%) |
| 6 to 11 Years | 34 (100.0%) | 31 (100.0%) |
| 12 to 14 Years | 36 (100.0%) | 0 (0.0%) |
| 15 Years | 0 (0.0%) | 0 (0.0%) |
| 16 and 17 Years | 37 (100.0%) | 0 (0.0%) |
| 18 to 24 Years | 30 (100.0%) | 122 (100.0%) |
| 25 to 34 Years | 0 (0.0%) | 89 (100.0%) |
| 35 to 44 Years | 0 (0.0%) | 0 (0.0%) |
| 45 to 54 Years | 0 (0.0%) | 26 (100.0%) |
| 55 to 64 Years | 87 (63.5%) | 61 (100.0%) |
| 65 to 74 Years | 26 (100.0%) | 107 (100.0%) |
| 75 Years and over | 13 (35.1%) | 0 (0.0%) |
| Total | 263 (78.0%) | 436 (95.6%) |
Income Below Poverty Among Married-Couple Families in Mora
The poverty statistics for married-couple families in Mora show that 12.5% or 24 of the total 192 families live below the poverty line. Families with no children have the highest poverty rate of 14.8%, comprising of 24 families. On the other hand, families with 1 or 2 children have the lowest poverty rate of 0.0%, which includes 0 families.
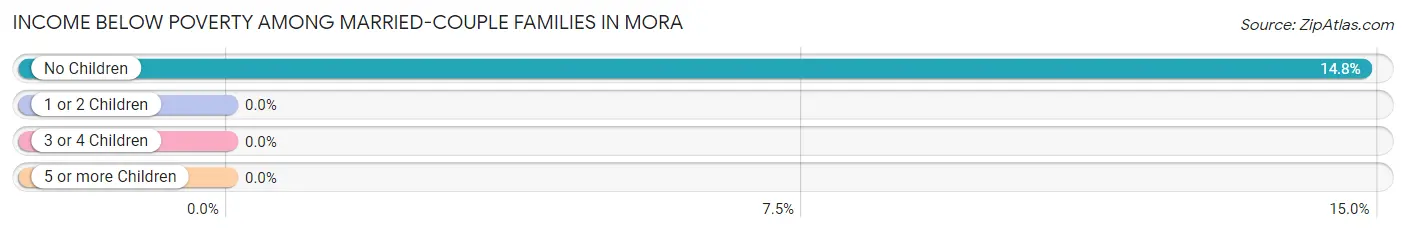
| Children | Above Poverty | Below Poverty |
| No Children | 138 (85.2%) | 24 (14.8%) |
| 1 or 2 Children | 30 (100.0%) | 0 (0.0%) |
| 3 or 4 Children | 0 (0.0%) | 0 (0.0%) |
| 5 or more Children | 0 (0.0%) | 0 (0.0%) |
| Total | 168 (87.5%) | 24 (12.5%) |
Income Below Poverty Among Single-Parent Households in Mora
| Children | Single Father | Single Mother |
| No Children | 0 (0.0%) | 0 (0.0%) |
| 1 or 2 Children | 0 (0.0%) | 0 (0.0%) |
| 3 or 4 Children | 0 (0.0%) | 0 (0.0%) |
| 5 or more Children | 0 (0.0%) | 0 (0.0%) |
| Total | 0 (0.0%) | 0 (0.0%) |
Income Below Poverty Among Married-Couple vs Single-Parent Households in Mora
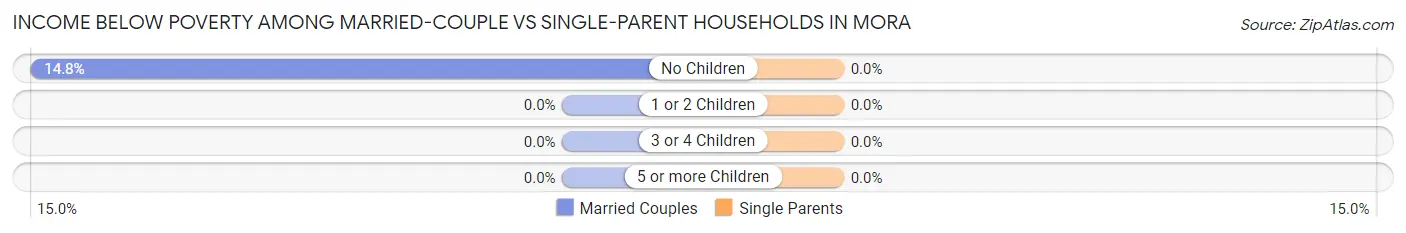
| Children | Married-Couple Families | Single-Parent Households |
| No Children | 24 (14.8%) | 0 (0.0%) |
| 1 or 2 Children | 0 (0.0%) | 0 (0.0%) |
| 3 or 4 Children | 0 (0.0%) | 0 (0.0%) |
| 5 or more Children | 0 (0.0%) | 0 (0.0%) |
| Total | 24 (12.5%) | 0 (0.0%) |
Race in Mora
The most populous races in Mora are Hispanic or Latino (637 | 80.3%), White / Caucasian (525 | 66.2%), and Some other Race (151 | 19.0%).
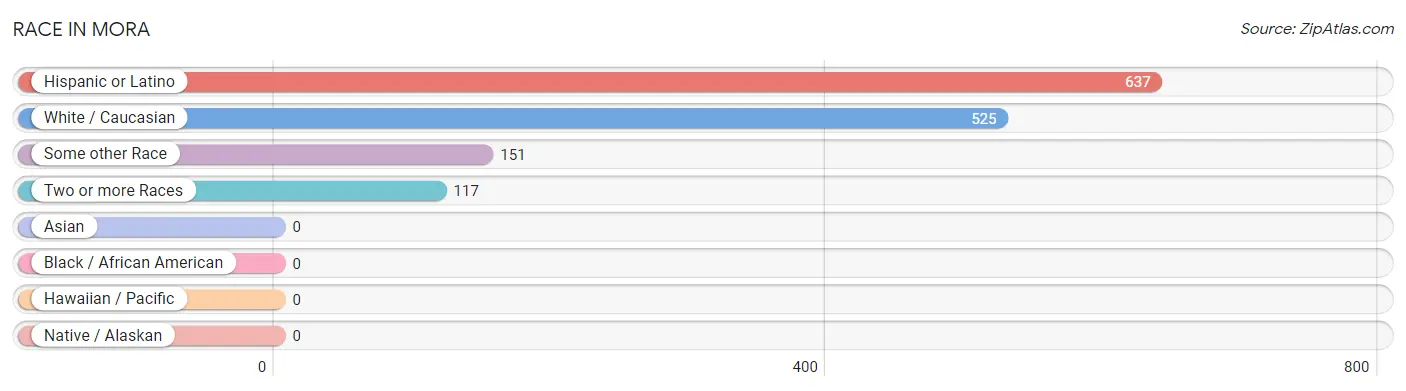
| Race | # Population | % Population |
| Asian | 0 | 0.0% |
| Black / African American | 0 | 0.0% |
| Hawaiian / Pacific | 0 | 0.0% |
| Hispanic or Latino | 637 | 80.3% |
| Native / Alaskan | 0 | 0.0% |
| White / Caucasian | 525 | 66.2% |
| Two or more Races | 117 | 14.7% |
| Some other Race | 151 | 19.0% |
| Total | 793 | 100.0% |
Ancestry in Mora
The most populous ancestries reported in Mora are Spanish (107 | 13.5%), Irish (69 | 8.7%), Norwegian (69 | 8.7%), French (67 | 8.5%), and English (26 | 3.3%), together accounting for 42.6% of all Mora residents.
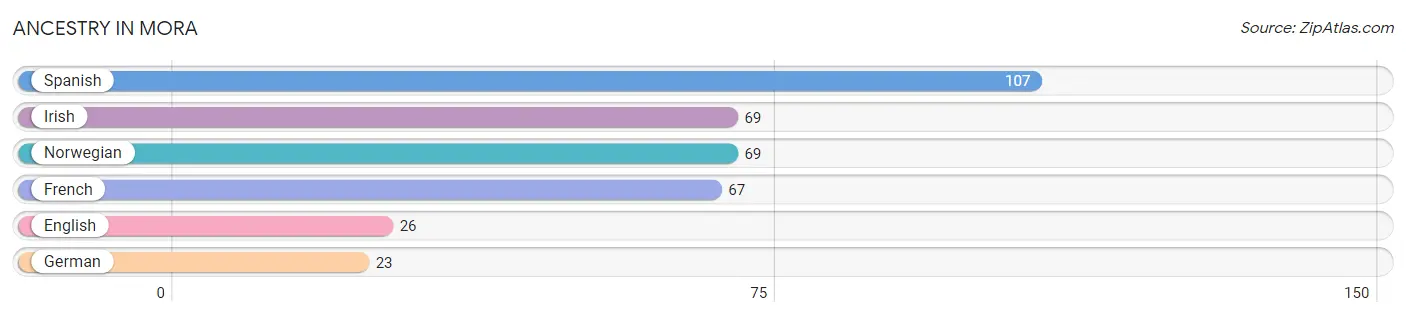
| Ancestry | # Population | % Population |
| English | 26 | 3.3% |
| French | 67 | 8.5% |
| German | 23 | 2.9% |
| Irish | 69 | 8.7% |
| Norwegian | 69 | 8.7% |
| Spanish | 107 | 13.5% | View All 6 Rows |
Immigrants in Mora

| Immigration Origin | # Population | % Population | View All 0 Rows |
Sex and Age in Mora
Sex and Age in Mora
The most populous age groups in Mora are 55 to 59 Years (87 | 25.8%) for men and 70 to 74 Years (107 | 23.5%) for women.
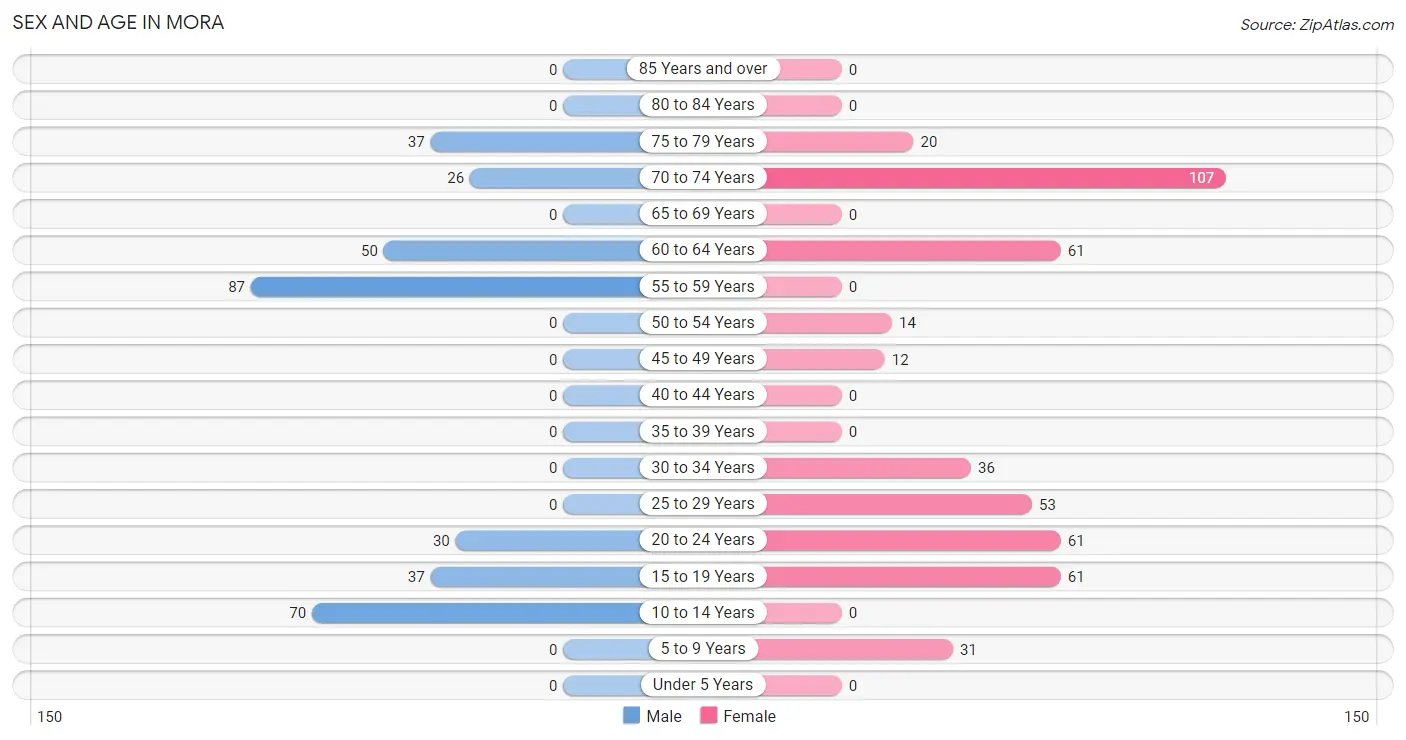
| Age Bracket | Male | Female |
| Under 5 Years | 0 (0.0%) | 0 (0.0%) |
| 5 to 9 Years | 0 (0.0%) | 31 (6.8%) |
| 10 to 14 Years | 70 (20.8%) | 0 (0.0%) |
| 15 to 19 Years | 37 (11.0%) | 61 (13.4%) |
| 20 to 24 Years | 30 (8.9%) | 61 (13.4%) |
| 25 to 29 Years | 0 (0.0%) | 53 (11.6%) |
| 30 to 34 Years | 0 (0.0%) | 36 (7.9%) |
| 35 to 39 Years | 0 (0.0%) | 0 (0.0%) |
| 40 to 44 Years | 0 (0.0%) | 0 (0.0%) |
| 45 to 49 Years | 0 (0.0%) | 12 (2.6%) |
| 50 to 54 Years | 0 (0.0%) | 14 (3.1%) |
| 55 to 59 Years | 87 (25.8%) | 0 (0.0%) |
| 60 to 64 Years | 50 (14.8%) | 61 (13.4%) |
| 65 to 69 Years | 0 (0.0%) | 0 (0.0%) |
| 70 to 74 Years | 26 (7.7%) | 107 (23.5%) |
| 75 to 79 Years | 37 (11.0%) | 20 (4.4%) |
| 80 to 84 Years | 0 (0.0%) | 0 (0.0%) |
| 85 Years and over | 0 (0.0%) | 0 (0.0%) |
| Total | 337 (100.0%) | 456 (100.0%) |
Families and Households in Mora
Median Family Size in Mora
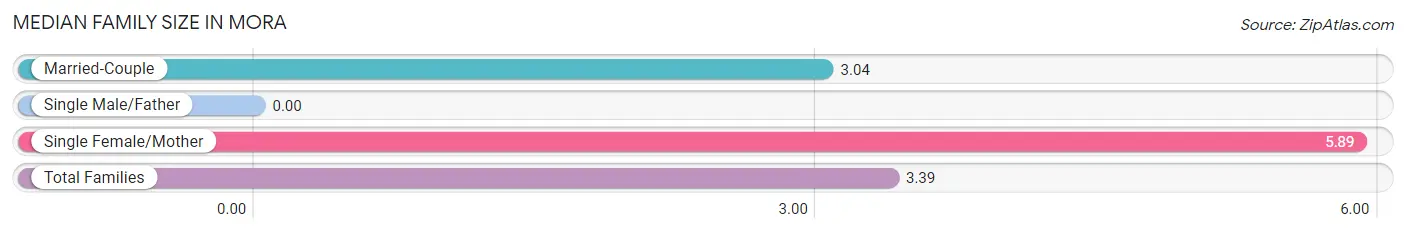
| Family Type | # Families | Family Size |
| Married-Couple | 192 (87.7%) | 3.04 |
| Single Male/Father | 0 (0.0%) | - |
| Single Female/Mother | 27 (12.3%) | 5.89 |
| Total Families | 219 (100.0%) | 3.39 |
Median Household Size in Mora
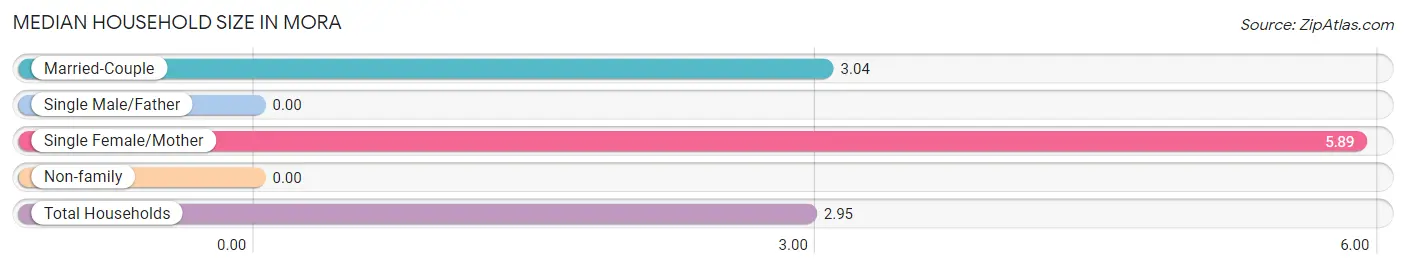
| Household Type | # Households | Household Size |
| Married-Couple | 192 (71.4%) | 3.04 |
| Single Male/Father | 0 (0.0%) | - |
| Single Female/Mother | 27 (10.0%) | 5.89 |
| Non-family | 50 (18.6%) | - |
| Total Households | 269 (100.0%) | 2.95 |
Household Size by Marriage Status in Mora
Out of a total of 269 households in Mora, 219 (81.4%) are family households, while 50 (18.6%) are nonfamily households. The most numerous type of family households are 2-person households, comprising 131, and the most common type of nonfamily households are 1-person households, comprising 50.
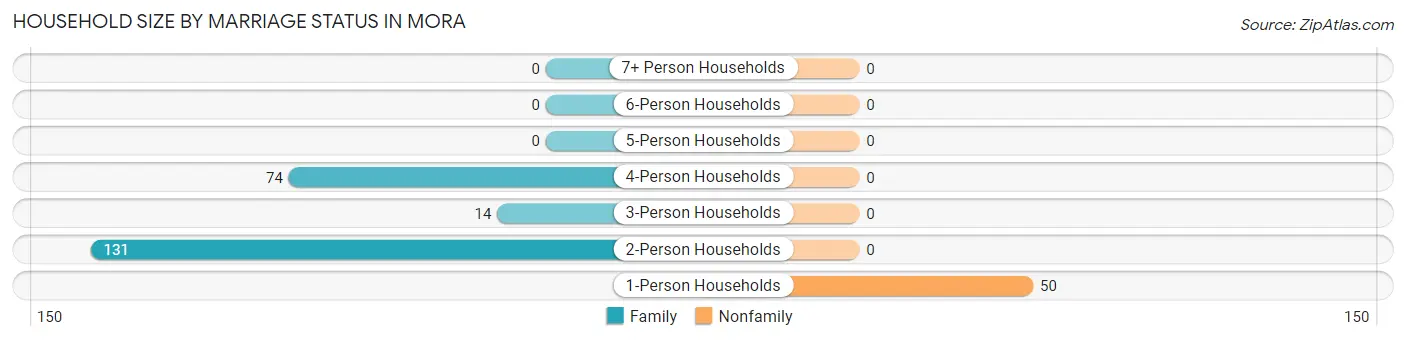
| Household Size | Family Households | Nonfamily Households |
| 1-Person Households | - | 50 (18.6%) |
| 2-Person Households | 131 (48.7%) | 0 (0.0%) |
| 3-Person Households | 14 (5.2%) | 0 (0.0%) |
| 4-Person Households | 74 (27.5%) | 0 (0.0%) |
| 5-Person Households | 0 (0.0%) | 0 (0.0%) |
| 6-Person Households | 0 (0.0%) | 0 (0.0%) |
| 7+ Person Households | 0 (0.0%) | 0 (0.0%) |
| Total | 219 (81.4%) | 50 (18.6%) |
Female Fertility in Mora
Fertility by Age in Mora
| Age Bracket | Women with Births | Births / 1,000 Women |
| 15 to 19 years | 0 (0.0%) | 0.0 |
| 20 to 34 years | 0 (0.0%) | 0.0 |
| 35 to 50 years | 0 (0.0%) | 0.0 |
| Total | 0 (0.0%) | 0.0 |
Fertility by Age by Marriage Status in Mora
| Age Bracket | Married | Unmarried |
| 15 to 19 years | 0 (0.0%) | 0 (0.0%) |
| 20 to 34 years | 0 (0.0%) | 0 (0.0%) |
| 35 to 50 years | 0 (0.0%) | 0 (0.0%) |
| Total | 0 (0.0%) | 0 (0.0%) |
Fertility by Education in Mora
| Educational Attainment | Women with Births | Births / 1,000 Women |
| Less than High School | 0 (0.0%) | 0.0 |
| High School Diploma | 0 (0.0%) | 0.0 |
| College or Associate's Degree | 0 (0.0%) | 0.0 |
| Bachelor's Degree | 0 (0.0%) | 0.0 |
| Graduate Degree | 0 (0.0%) | 0.0 |
| Total | 0 (0.0%) | 0.0 |
Fertility by Education by Marriage Status in Mora
| Educational Attainment | Married | Unmarried |
| Less than High School | 0 (0.0%) | 0 (0.0%) |
| High School Diploma | 0 (0.0%) | 0 (0.0%) |
| College or Associate's Degree | 0 (0.0%) | 0 (0.0%) |
| Bachelor's Degree | 0 (0.0%) | 0 (0.0%) |
| Graduate Degree | 0 (0.0%) | 0 (0.0%) |
| Total | 0 (0.0%) | 0 (0.0%) |
Employment Characteristics in Mora
Employment by Class of Employer in Mora
Among the 371 employed individuals in Mora, private company employees (198 | 53.4%), unpaid family workers (67 | 18.1%), and state government employees (33 | 8.9%) make up the most common classes of employment.
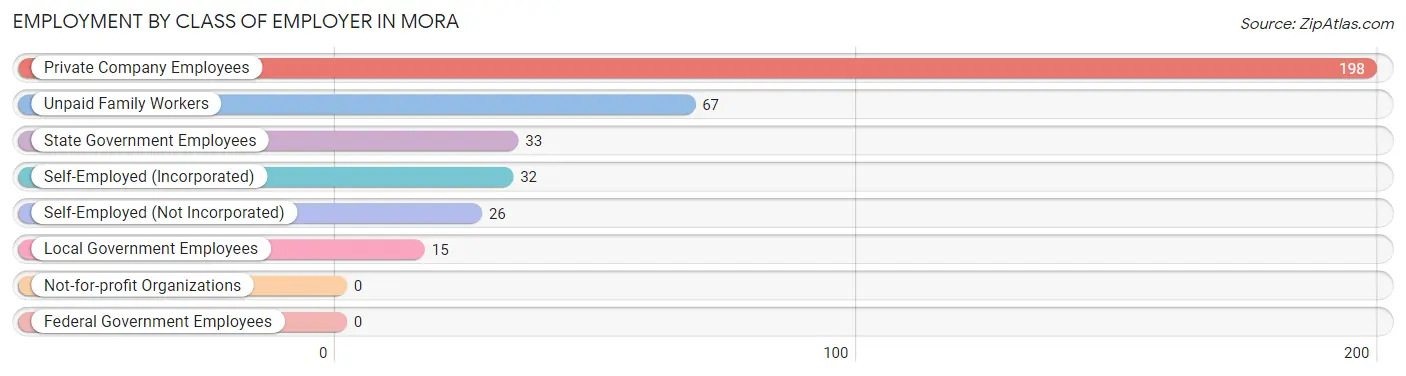
| Employer Class | # Employees | % Employees |
| Private Company Employees | 198 | 53.4% |
| Self-Employed (Incorporated) | 32 | 8.6% |
| Self-Employed (Not Incorporated) | 26 | 7.0% |
| Not-for-profit Organizations | 0 | 0.0% |
| Local Government Employees | 15 | 4.0% |
| State Government Employees | 33 | 8.9% |
| Federal Government Employees | 0 | 0.0% |
| Unpaid Family Workers | 67 | 18.1% |
| Total | 371 | 100.0% |
Employment Status by Age in Mora
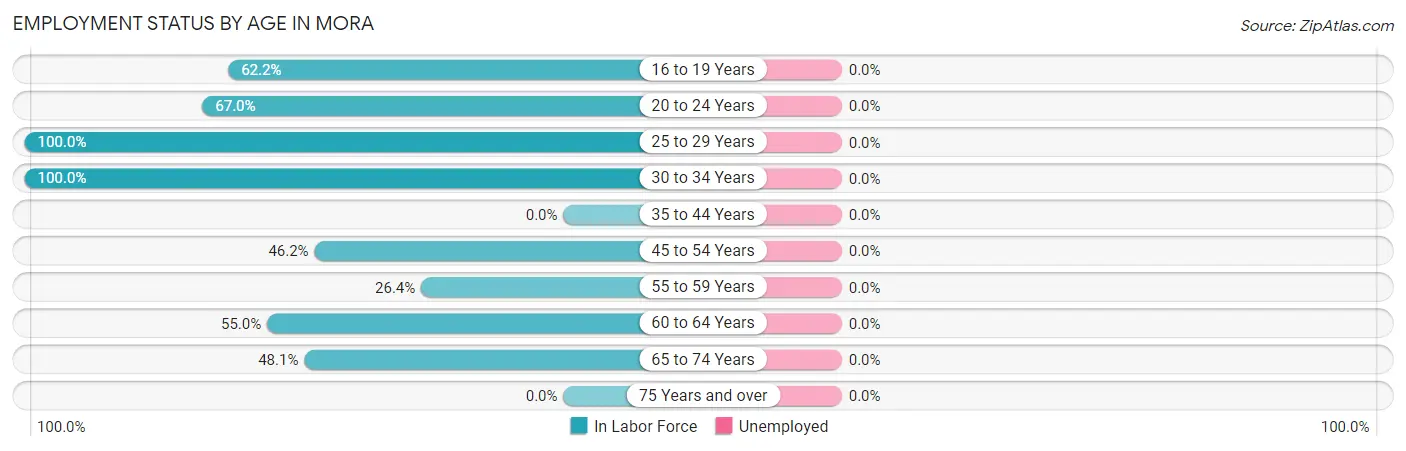
| Age Bracket | In Labor Force | Unemployed |
| 16 to 19 Years | 61 (62.2%) | 0 (0.0%) |
| 20 to 24 Years | 61 (67.0%) | 0 (0.0%) |
| 25 to 29 Years | 53 (100.0%) | 0 (0.0%) |
| 30 to 34 Years | 36 (100.0%) | 0 (0.0%) |
| 35 to 44 Years | 0 (0.0%) | 0 (0.0%) |
| 45 to 54 Years | 12 (46.2%) | 0 (0.0%) |
| 55 to 59 Years | 23 (26.4%) | 0 (0.0%) |
| 60 to 64 Years | 61 (55.0%) | 0 (0.0%) |
| 65 to 74 Years | 64 (48.1%) | 0 (0.0%) |
| 75 Years and over | 0 (0.0%) | 0 (0.0%) |
| Total | 371 (53.6%) | 0 (0.0%) |
Employment Status by Educational Attainment in Mora
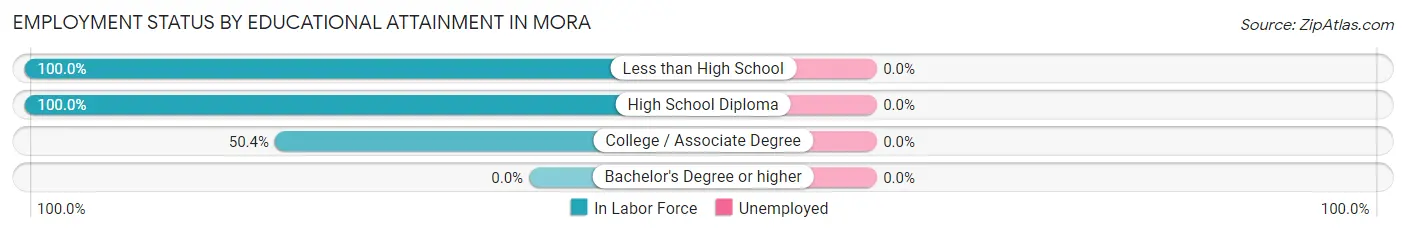
| Educational Attainment | In Labor Force | Unemployed |
| Less than High School | 23 (100.0%) | 0 (0.0%) |
| High School Diploma | 32 (100.0%) | 0 (0.0%) |
| College / Associate Degree | 130 (50.4%) | 0 (0.0%) |
| Bachelor's Degree or higher | 0 (0.0%) | 0 (0.0%) |
| Total | 185 (59.1%) | 0 (0.0%) |
Employment Occupations by Sex in Mora
Management, Business, Science and Arts Occupations
The most common Management, Business, Science and Arts occupations in Mora are Management (29 | 7.8%), Community & Social Service (21 | 5.7%), and Education Instruction & Library (21 | 5.7%).
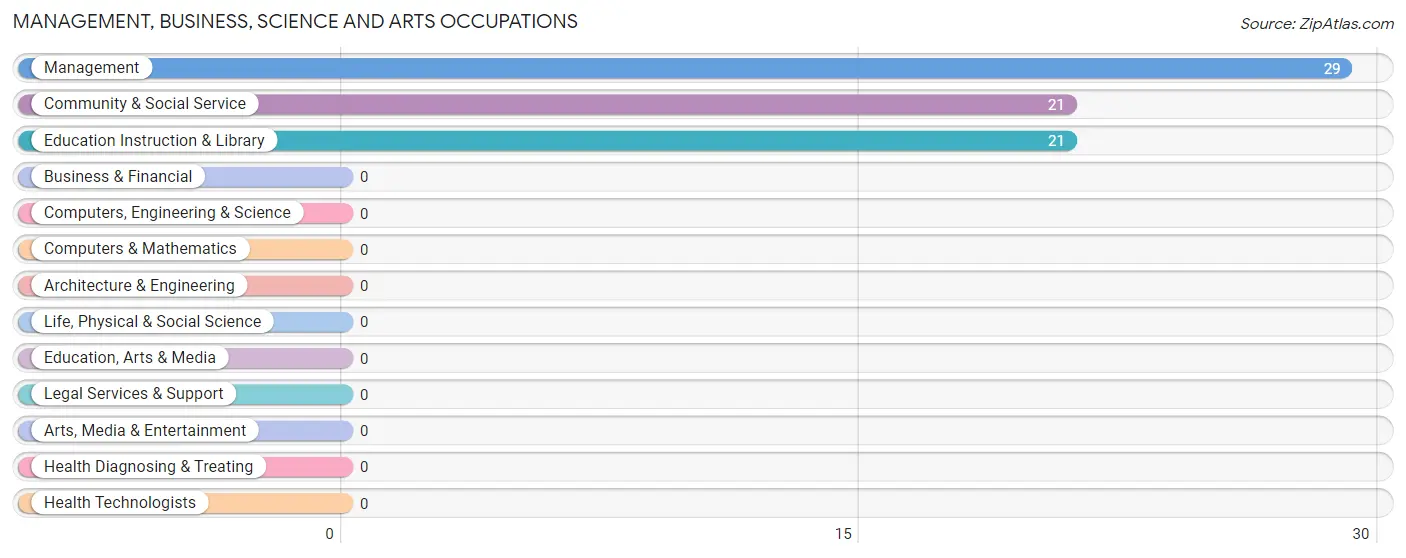
Management, Business, Science and Arts Occupations by Sex
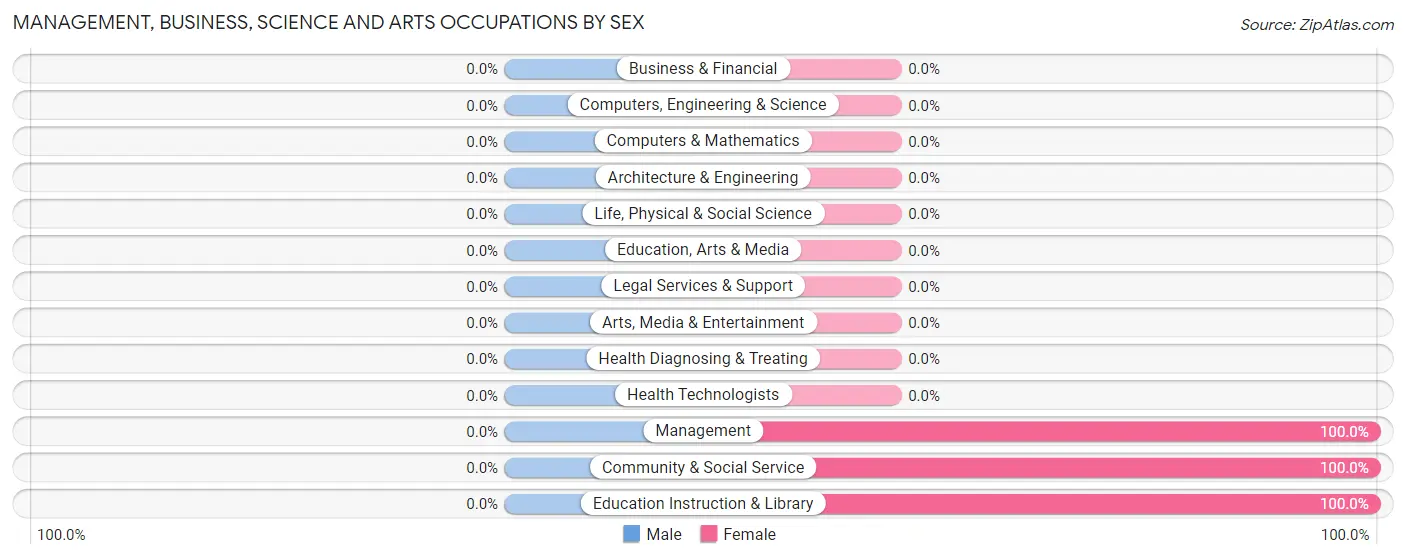
| Occupation | Male | Female |
| Management | 0 (0.0%) | 29 (100.0%) |
| Business & Financial | 0 (0.0%) | 0 (0.0%) |
| Computers, Engineering & Science | 0 (0.0%) | 0 (0.0%) |
| Computers & Mathematics | 0 (0.0%) | 0 (0.0%) |
| Architecture & Engineering | 0 (0.0%) | 0 (0.0%) |
| Life, Physical & Social Science | 0 (0.0%) | 0 (0.0%) |
| Community & Social Service | 0 (0.0%) | 21 (100.0%) |
| Education, Arts & Media | 0 (0.0%) | 0 (0.0%) |
| Legal Services & Support | 0 (0.0%) | 0 (0.0%) |
| Education Instruction & Library | 0 (0.0%) | 21 (100.0%) |
| Arts, Media & Entertainment | 0 (0.0%) | 0 (0.0%) |
| Health Diagnosing & Treating | 0 (0.0%) | 0 (0.0%) |
| Health Technologists | 0 (0.0%) | 0 (0.0%) |
| Total (Category) | 0 (0.0%) | 50 (100.0%) |
| Total (Overall) | 49 (13.2%) | 322 (86.8%) |
Services Occupations
The most common Services occupations in Mora are Personal Care & Service (93 | 25.1%), Food Preparation & Serving (73 | 19.7%), and Healthcare Support (53 | 14.3%).
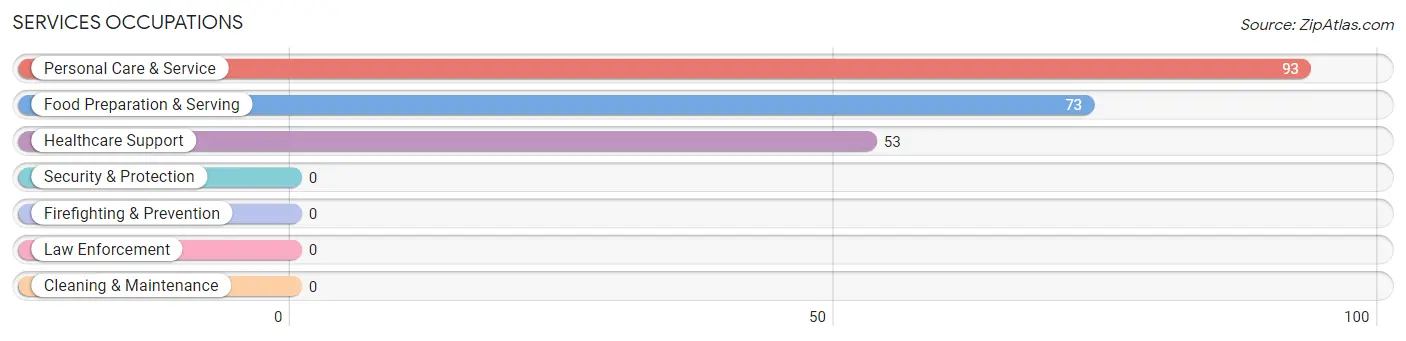
Services Occupations by Sex
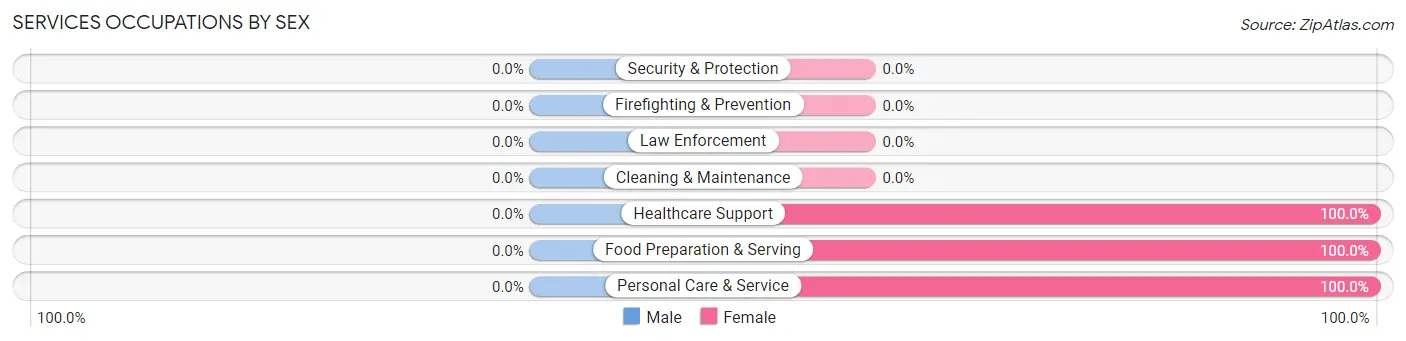
| Occupation | Male | Female |
| Healthcare Support | 0 (0.0%) | 53 (100.0%) |
| Security & Protection | 0 (0.0%) | 0 (0.0%) |
| Firefighting & Prevention | 0 (0.0%) | 0 (0.0%) |
| Law Enforcement | 0 (0.0%) | 0 (0.0%) |
| Food Preparation & Serving | 0 (0.0%) | 73 (100.0%) |
| Cleaning & Maintenance | 0 (0.0%) | 0 (0.0%) |
| Personal Care & Service | 0 (0.0%) | 93 (100.0%) |
| Total (Category) | 0 (0.0%) | 219 (100.0%) |
| Total (Overall) | 49 (13.2%) | 322 (86.8%) |
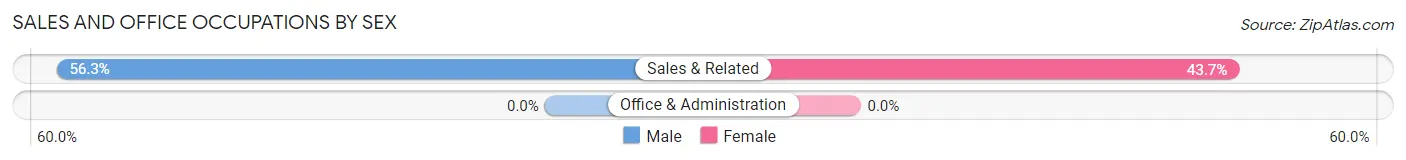
Sales and Office Occupations
The most common Sales and Office occupations in Mora are , and Sales & Related (87 | 23.4%).
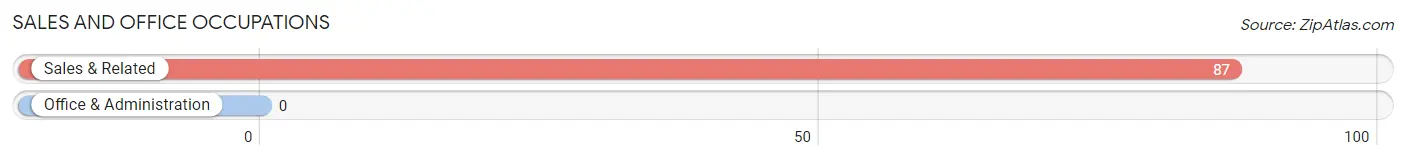
Sales and Office Occupations by Sex
| Occupation | Male | Female |
| Sales & Related | 49 (56.3%) | 38 (43.7%) |
| Office & Administration | 0 (0.0%) | 0 (0.0%) |
| Total (Category) | 49 (56.3%) | 38 (43.7%) |
| Total (Overall) | 49 (13.2%) | 322 (86.8%) |
Natural Resources, Construction and Maintenance Occupations
Natural Resources, Construction and Maintenance Occupations by Sex
| Occupation | Male | Female |
| Farming, Fishing & Forestry | 0 (0.0%) | 0 (0.0%) |
| Construction & Extraction | 0 (0.0%) | 0 (0.0%) |
| Installation, Maintenance & Repair | 0 (0.0%) | 0 (0.0%) |
| Total (Category) | 0 (0.0%) | 0 (0.0%) |
| Total (Overall) | 49 (13.2%) | 322 (86.8%) |
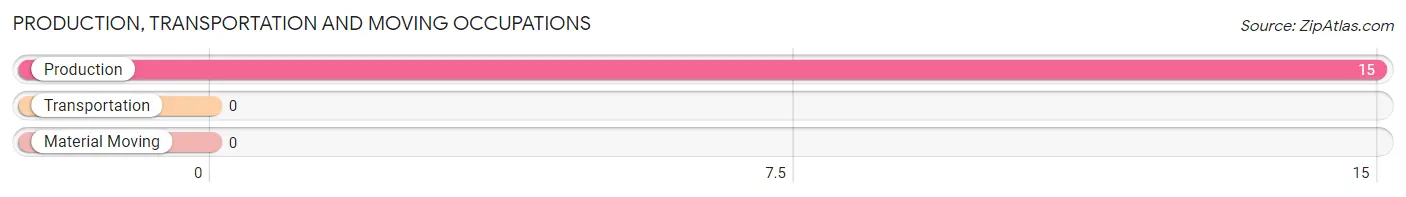
Production, Transportation and Moving Occupations
The most common Production, Transportation and Moving occupations in Mora are , and Production (15 | 4.0%).
Production, Transportation and Moving Occupations by Sex
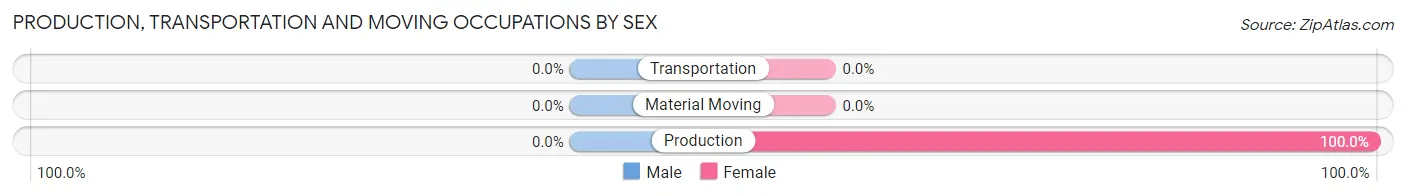
| Occupation | Male | Female |
| Production | 0 (0.0%) | 15 (100.0%) |
| Transportation | 0 (0.0%) | 0 (0.0%) |
| Material Moving | 0 (0.0%) | 0 (0.0%) |
| Total (Category) | 0 (0.0%) | 15 (100.0%) |
| Total (Overall) | 49 (13.2%) | 322 (86.8%) |
Employment Industries by Sex in Mora
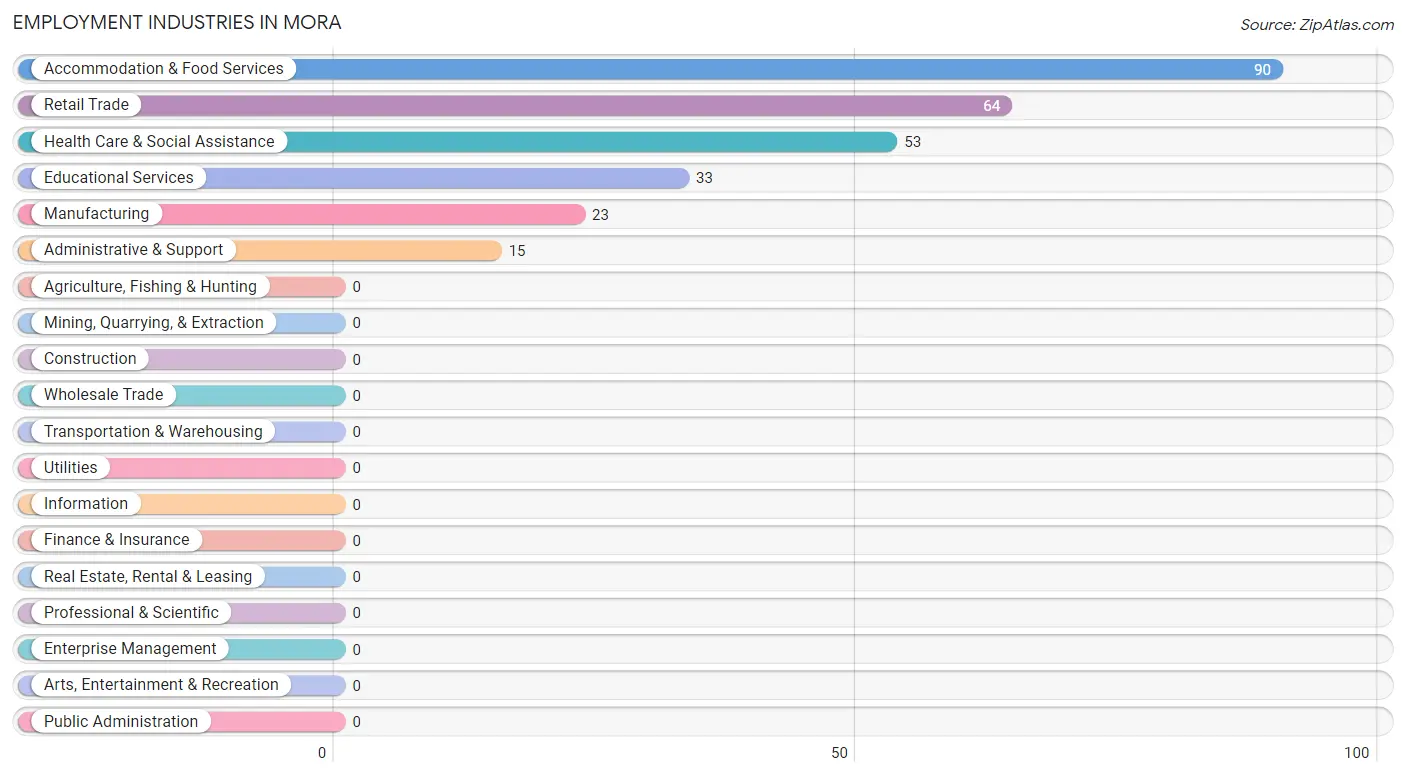
Employment Industries in Mora
The major employment industries in Mora include Accommodation & Food Services (90 | 24.3%), Retail Trade (64 | 17.2%), Health Care & Social Assistance (53 | 14.3%), Educational Services (33 | 8.9%), and Manufacturing (23 | 6.2%).
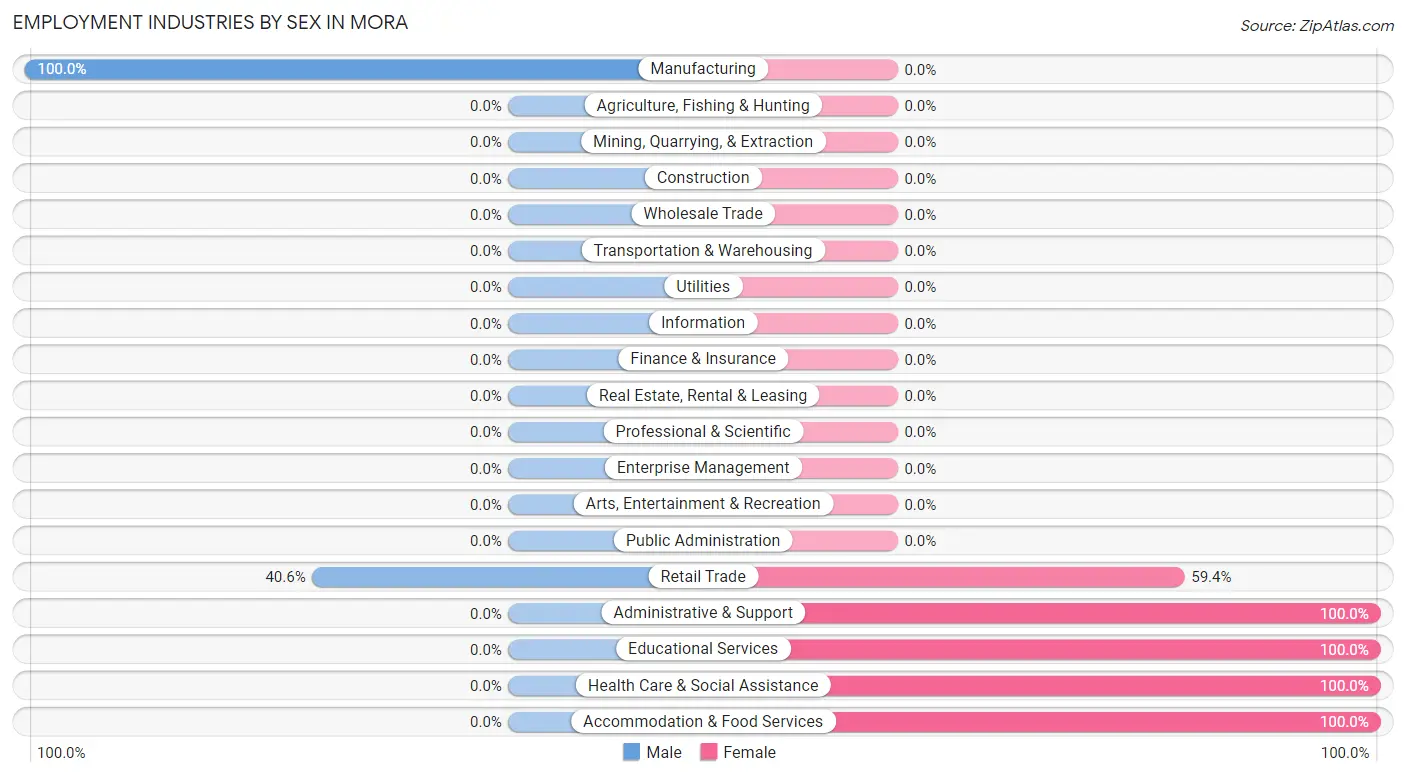
Employment Industries by Sex in Mora
The Mora industries that see more men than women are Manufacturing (100.0%), and Retail Trade (40.6%), whereas the industries that tend to have a higher number of women are Administrative & Support (100.0%), Educational Services (100.0%), and Health Care & Social Assistance (100.0%).
| Industry | Male | Female |
| Agriculture, Fishing & Hunting | 0 (0.0%) | 0 (0.0%) |
| Mining, Quarrying, & Extraction | 0 (0.0%) | 0 (0.0%) |
| Construction | 0 (0.0%) | 0 (0.0%) |
| Manufacturing | 23 (100.0%) | 0 (0.0%) |
| Wholesale Trade | 0 (0.0%) | 0 (0.0%) |
| Retail Trade | 26 (40.6%) | 38 (59.4%) |
| Transportation & Warehousing | 0 (0.0%) | 0 (0.0%) |
| Utilities | 0 (0.0%) | 0 (0.0%) |
| Information | 0 (0.0%) | 0 (0.0%) |
| Finance & Insurance | 0 (0.0%) | 0 (0.0%) |
| Real Estate, Rental & Leasing | 0 (0.0%) | 0 (0.0%) |
| Professional & Scientific | 0 (0.0%) | 0 (0.0%) |
| Enterprise Management | 0 (0.0%) | 0 (0.0%) |
| Administrative & Support | 0 (0.0%) | 15 (100.0%) |
| Educational Services | 0 (0.0%) | 33 (100.0%) |
| Health Care & Social Assistance | 0 (0.0%) | 53 (100.0%) |
| Arts, Entertainment & Recreation | 0 (0.0%) | 0 (0.0%) |
| Accommodation & Food Services | 0 (0.0%) | 90 (100.0%) |
| Public Administration | 0 (0.0%) | 0 (0.0%) |
| Total | 49 (13.2%) | 322 (86.8%) |
Education in Mora
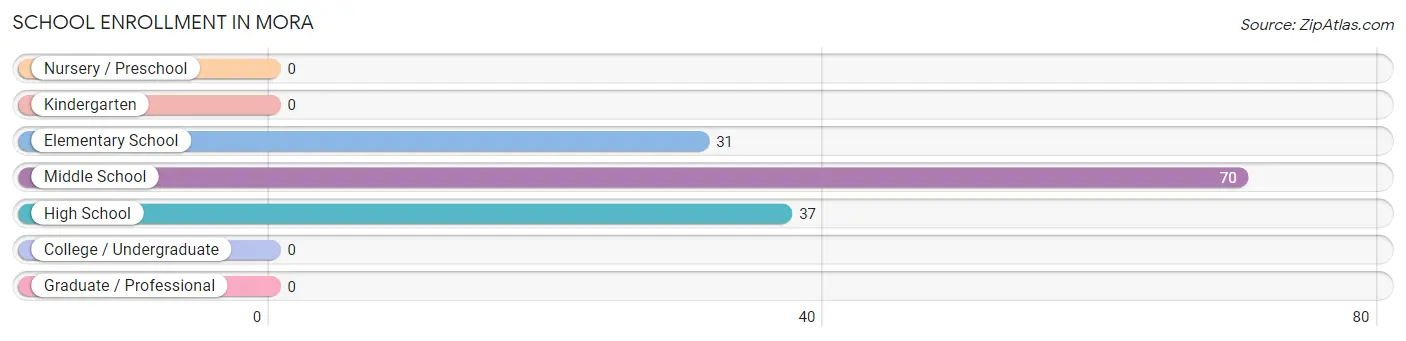
School Enrollment in Mora
The most common levels of schooling among the 138 students in Mora are middle school (70 | 50.7%), high school (37 | 26.8%), and elementary school (31 | 22.5%).
| School Level | # Students | % Students |
| Nursery / Preschool | 0 | 0.0% |
| Kindergarten | 0 | 0.0% |
| Elementary School | 31 | 22.5% |
| Middle School | 70 | 50.7% |
| High School | 37 | 26.8% |
| College / Undergraduate | 0 | 0.0% |
| Graduate / Professional | 0 | 0.0% |
| Total | 138 | 100.0% |
School Enrollment by Age by Funding Source in Mora
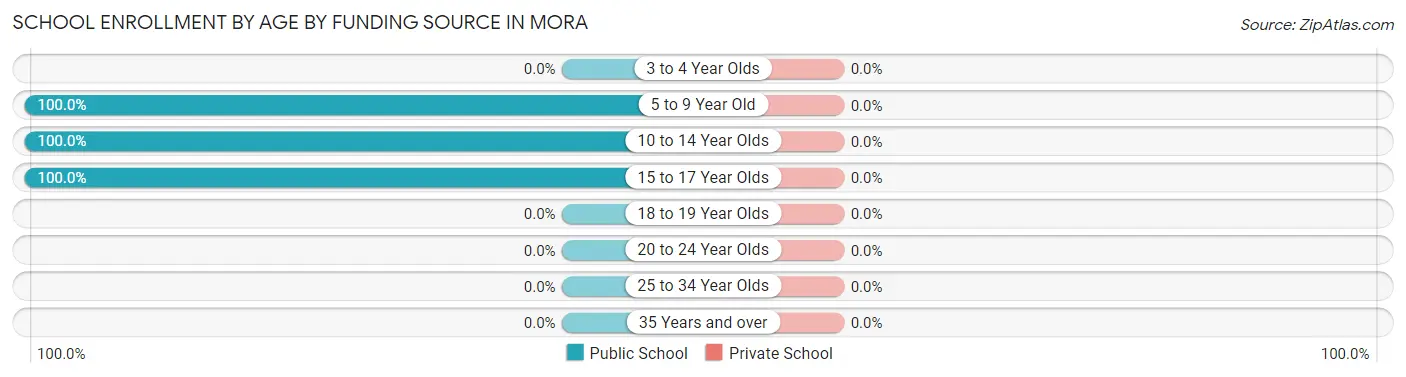
| Age Bracket | Public School | Private School |
| 3 to 4 Year Olds | 0 (0.0%) | 0 (0.0%) |
| 5 to 9 Year Old | 31 (100.0%) | 0 (0.0%) |
| 10 to 14 Year Olds | 70 (100.0%) | 0 (0.0%) |
| 15 to 17 Year Olds | 37 (100.0%) | 0 (0.0%) |
| 18 to 19 Year Olds | 0 (0.0%) | 0 (0.0%) |
| 20 to 24 Year Olds | 0 (0.0%) | 0 (0.0%) |
| 25 to 34 Year Olds | 0 (0.0%) | 0 (0.0%) |
| 35 Years and over | 0 (0.0%) | 0 (0.0%) |
| Total | 138 (100.0%) | 0 (0.0%) |
Educational Attainment by Field of Study in Mora
Education (95 | 65.1%), business (38 | 26.0%), and physical & health sciences (13 | 8.9%) are the most common fields of study among 146 individuals in Mora who have obtained a bachelor's degree or higher.
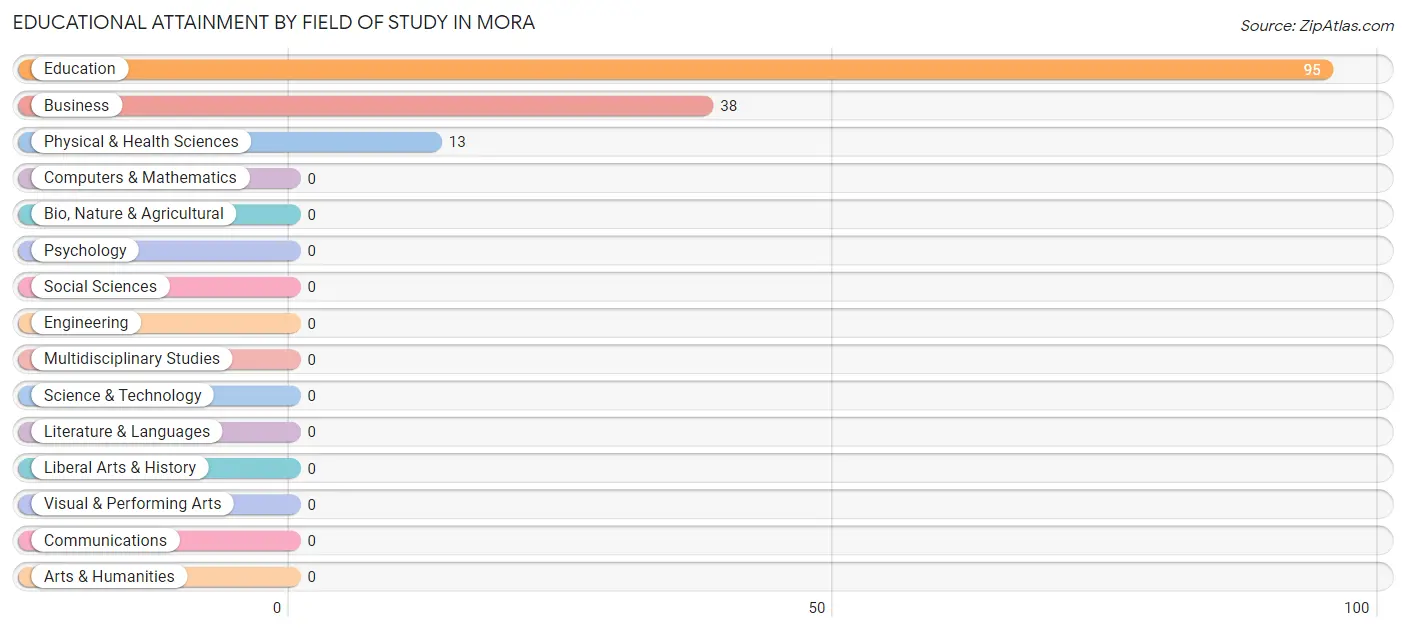
| Field of Study | # Graduates | % Graduates |
| Computers & Mathematics | 0 | 0.0% |
| Bio, Nature & Agricultural | 0 | 0.0% |
| Physical & Health Sciences | 13 | 8.9% |
| Psychology | 0 | 0.0% |
| Social Sciences | 0 | 0.0% |
| Engineering | 0 | 0.0% |
| Multidisciplinary Studies | 0 | 0.0% |
| Science & Technology | 0 | 0.0% |
| Business | 38 | 26.0% |
| Education | 95 | 65.1% |
| Literature & Languages | 0 | 0.0% |
| Liberal Arts & History | 0 | 0.0% |
| Visual & Performing Arts | 0 | 0.0% |
| Communications | 0 | 0.0% |
| Arts & Humanities | 0 | 0.0% |
| Total | 146 | 100.0% |
Transportation & Commute in Mora
Vehicle Availability by Sex in Mora
The most prevalent vehicle ownership categories in Mora are males with 3 vehicles (26, accounting for 53.1%) and females with 3 vehicles (91, making up 8.1%).
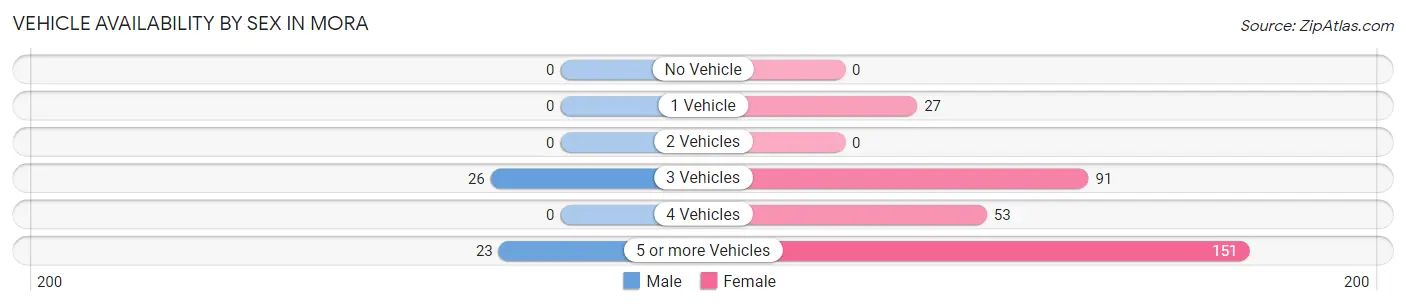
| Vehicles Available | Male | Female |
| No Vehicle | 0 (0.0%) | 0 (0.0%) |
| 1 Vehicle | 0 (0.0%) | 27 (8.4%) |
| 2 Vehicles | 0 (0.0%) | 0 (0.0%) |
| 3 Vehicles | 26 (53.1%) | 91 (28.3%) |
| 4 Vehicles | 0 (0.0%) | 53 (16.5%) |
| 5 or more Vehicles | 23 (46.9%) | 151 (46.9%) |
| Total | 49 (100.0%) | 322 (100.0%) |
Commute Time in Mora
The most frequently occuring commute durations in Mora are 90 or more minutes (198 commuters, 60.6%), less than 5 minutes (96 commuters, 29.4%), and 5 to 9 minutes (33 commuters, 10.1%).
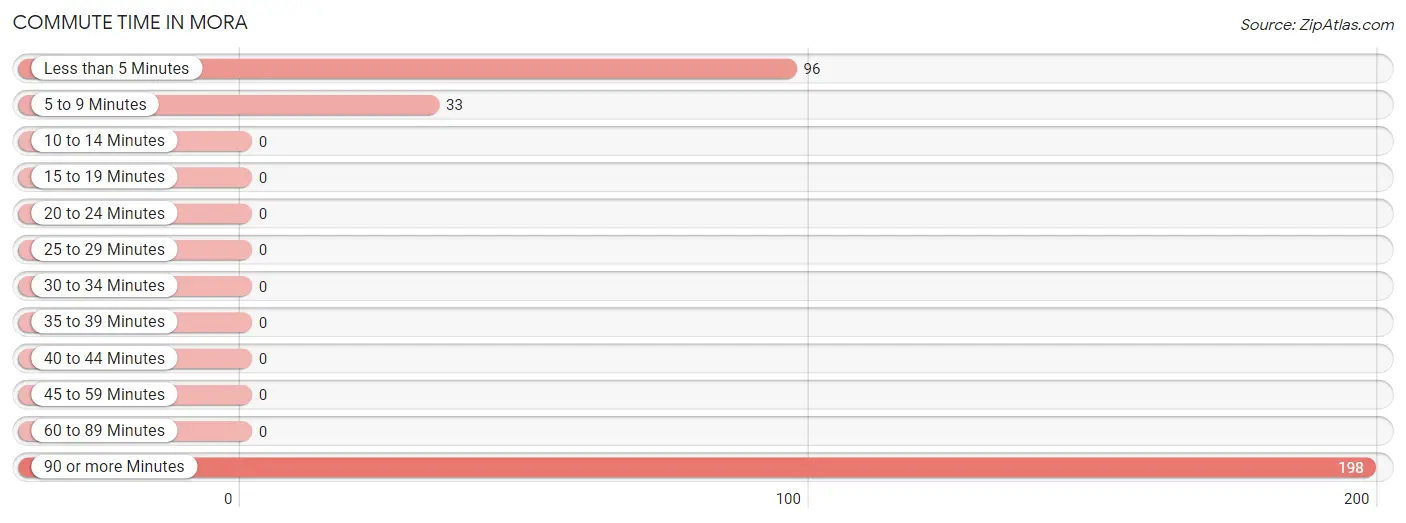
| Commute Time | # Commuters | % Commuters |
| Less than 5 Minutes | 96 | 29.4% |
| 5 to 9 Minutes | 33 | 10.1% |
| 10 to 14 Minutes | 0 | 0.0% |
| 15 to 19 Minutes | 0 | 0.0% |
| 20 to 24 Minutes | 0 | 0.0% |
| 25 to 29 Minutes | 0 | 0.0% |
| 30 to 34 Minutes | 0 | 0.0% |
| 35 to 39 Minutes | 0 | 0.0% |
| 40 to 44 Minutes | 0 | 0.0% |
| 45 to 59 Minutes | 0 | 0.0% |
| 60 to 89 Minutes | 0 | 0.0% |
| 90 or more Minutes | 198 | 60.6% |
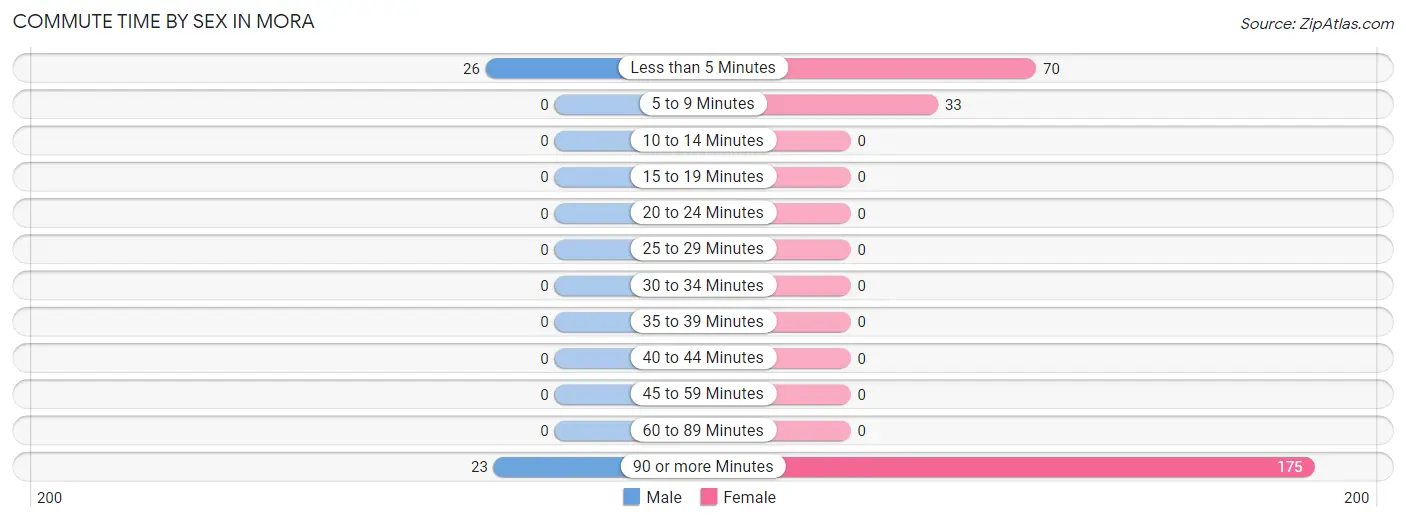
Commute Time by Sex in Mora
The most common commute times in Mora are less than 5 minutes (26 commuters, 53.1%) for males and 90 or more minutes (175 commuters, 62.9%) for females.
| Commute Time | Male | Female |
| Less than 5 Minutes | 26 (53.1%) | 70 (25.2%) |
| 5 to 9 Minutes | 0 (0.0%) | 33 (11.9%) |
| 10 to 14 Minutes | 0 (0.0%) | 0 (0.0%) |
| 15 to 19 Minutes | 0 (0.0%) | 0 (0.0%) |
| 20 to 24 Minutes | 0 (0.0%) | 0 (0.0%) |
| 25 to 29 Minutes | 0 (0.0%) | 0 (0.0%) |
| 30 to 34 Minutes | 0 (0.0%) | 0 (0.0%) |
| 35 to 39 Minutes | 0 (0.0%) | 0 (0.0%) |
| 40 to 44 Minutes | 0 (0.0%) | 0 (0.0%) |
| 45 to 59 Minutes | 0 (0.0%) | 0 (0.0%) |
| 60 to 89 Minutes | 0 (0.0%) | 0 (0.0%) |
| 90 or more Minutes | 23 (46.9%) | 175 (62.9%) |
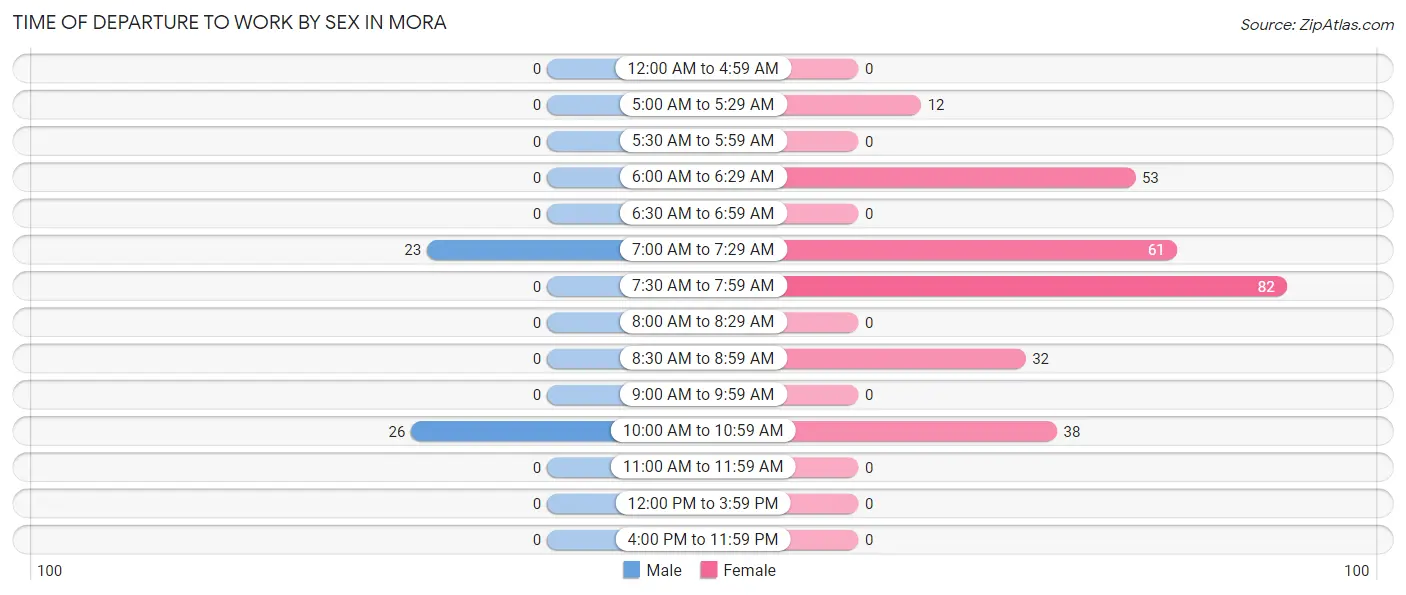
Time of Departure to Work by Sex in Mora
The most frequent times of departure to work in Mora are 10:00 AM to 10:59 AM (26, 53.1%) for males and 7:30 AM to 7:59 AM (82, 29.5%) for females.
| Time of Departure | Male | Female |
| 12:00 AM to 4:59 AM | 0 (0.0%) | 0 (0.0%) |
| 5:00 AM to 5:29 AM | 0 (0.0%) | 12 (4.3%) |
| 5:30 AM to 5:59 AM | 0 (0.0%) | 0 (0.0%) |
| 6:00 AM to 6:29 AM | 0 (0.0%) | 53 (19.1%) |
| 6:30 AM to 6:59 AM | 0 (0.0%) | 0 (0.0%) |
| 7:00 AM to 7:29 AM | 23 (46.9%) | 61 (21.9%) |
| 7:30 AM to 7:59 AM | 0 (0.0%) | 82 (29.5%) |
| 8:00 AM to 8:29 AM | 0 (0.0%) | 0 (0.0%) |
| 8:30 AM to 8:59 AM | 0 (0.0%) | 32 (11.5%) |
| 9:00 AM to 9:59 AM | 0 (0.0%) | 0 (0.0%) |
| 10:00 AM to 10:59 AM | 26 (53.1%) | 38 (13.7%) |
| 11:00 AM to 11:59 AM | 0 (0.0%) | 0 (0.0%) |
| 12:00 PM to 3:59 PM | 0 (0.0%) | 0 (0.0%) |
| 4:00 PM to 11:59 PM | 0 (0.0%) | 0 (0.0%) |
| Total | 49 (100.0%) | 278 (100.0%) |
Housing Occupancy in Mora
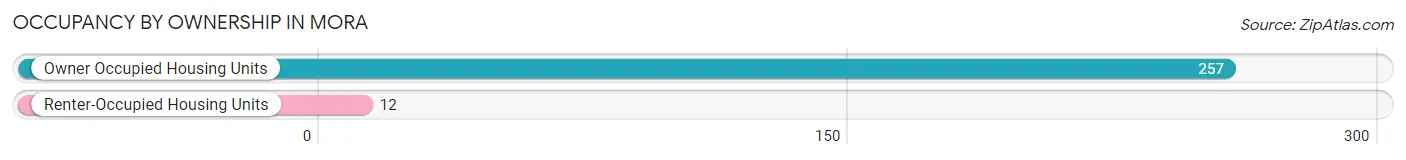
Occupancy by Ownership in Mora
Of the total 269 dwellings in Mora, owner-occupied units account for 257 (95.5%), while renter-occupied units make up 12 (4.5%).
| Occupancy | # Housing Units | % Housing Units |
| Owner Occupied Housing Units | 257 | 95.5% |
| Renter-Occupied Housing Units | 12 | 4.5% |
| Total Occupied Housing Units | 269 | 100.0% |
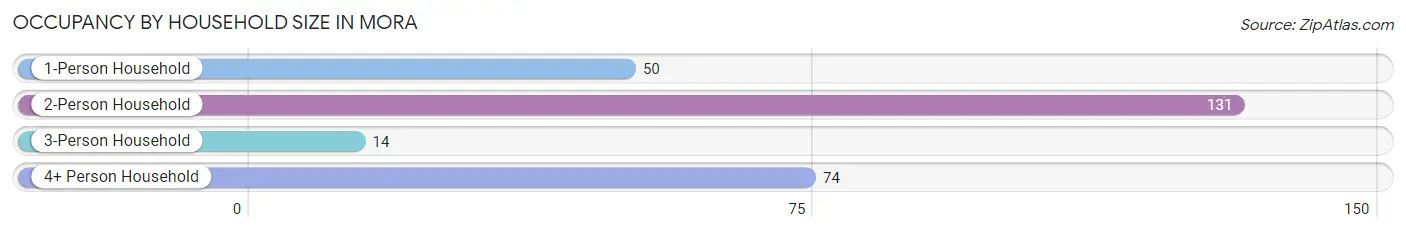
Occupancy by Household Size in Mora
| Household Size | # Housing Units | % Housing Units |
| 1-Person Household | 50 | 18.6% |
| 2-Person Household | 131 | 48.7% |
| 3-Person Household | 14 | 5.2% |
| 4+ Person Household | 74 | 27.5% |
| Total Housing Units | 269 | 100.0% |
Occupancy by Ownership by Household Size in Mora
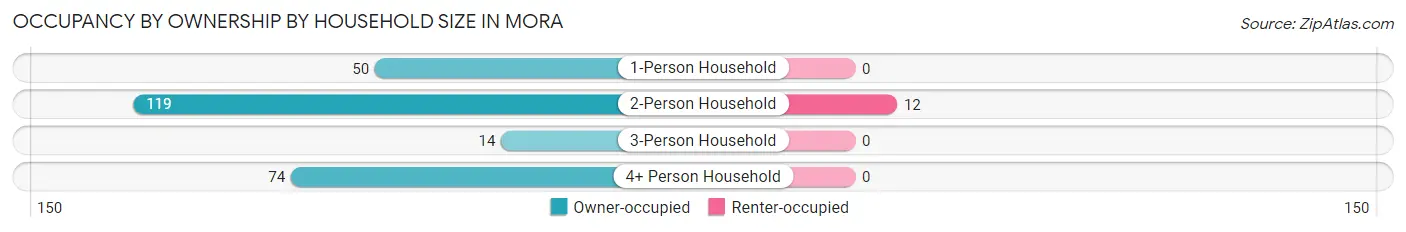
| Household Size | Owner-occupied | Renter-occupied |
| 1-Person Household | 50 (100.0%) | 0 (0.0%) |
| 2-Person Household | 119 (90.8%) | 12 (9.2%) |
| 3-Person Household | 14 (100.0%) | 0 (0.0%) |
| 4+ Person Household | 74 (100.0%) | 0 (0.0%) |
| Total Housing Units | 257 (95.5%) | 12 (4.5%) |
Occupancy by Educational Attainment in Mora
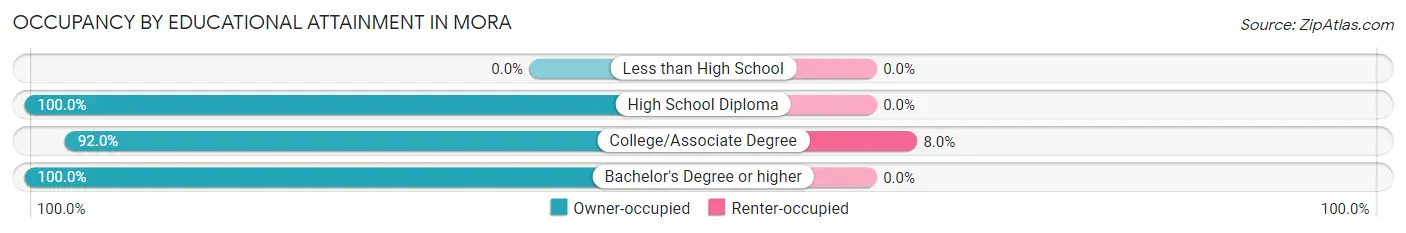
| Household Size | Owner-occupied | Renter-occupied |
| Less than High School | 0 (0.0%) | 0 (0.0%) |
| High School Diploma | 24 (100.0%) | 0 (0.0%) |
| College/Associate Degree | 138 (92.0%) | 12 (8.0%) |
| Bachelor's Degree or higher | 95 (100.0%) | 0 (0.0%) |
Occupancy by Age of Householder in Mora
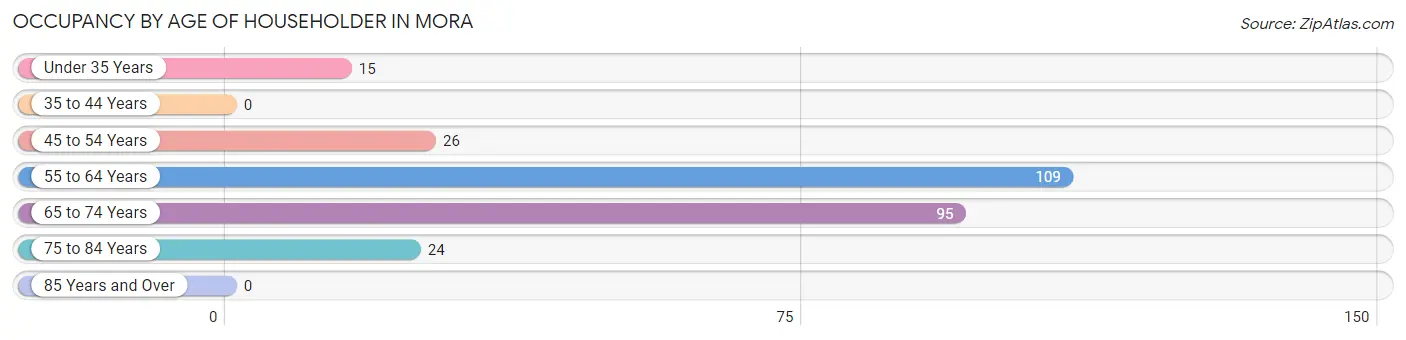
| Age Bracket | # Households | % Households |
| Under 35 Years | 15 | 5.6% |
| 35 to 44 Years | 0 | 0.0% |
| 45 to 54 Years | 26 | 9.7% |
| 55 to 64 Years | 109 | 40.5% |
| 65 to 74 Years | 95 | 35.3% |
| 75 to 84 Years | 24 | 8.9% |
| 85 Years and Over | 0 | 0.0% |
| Total | 269 | 100.0% |
Housing Finances in Mora
Median Income by Occupancy in Mora
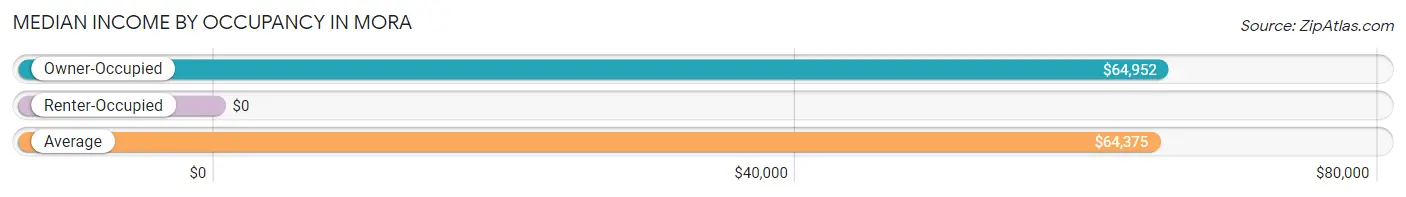
| Occupancy Type | # Households | Median Income |
| Owner-Occupied | 257 (95.5%) | $64,952 |
| Renter-Occupied | 12 (4.5%) | $0 |
| Average | 269 (100.0%) | $64,375 |
Occupancy by Householder Income Bracket in Mora
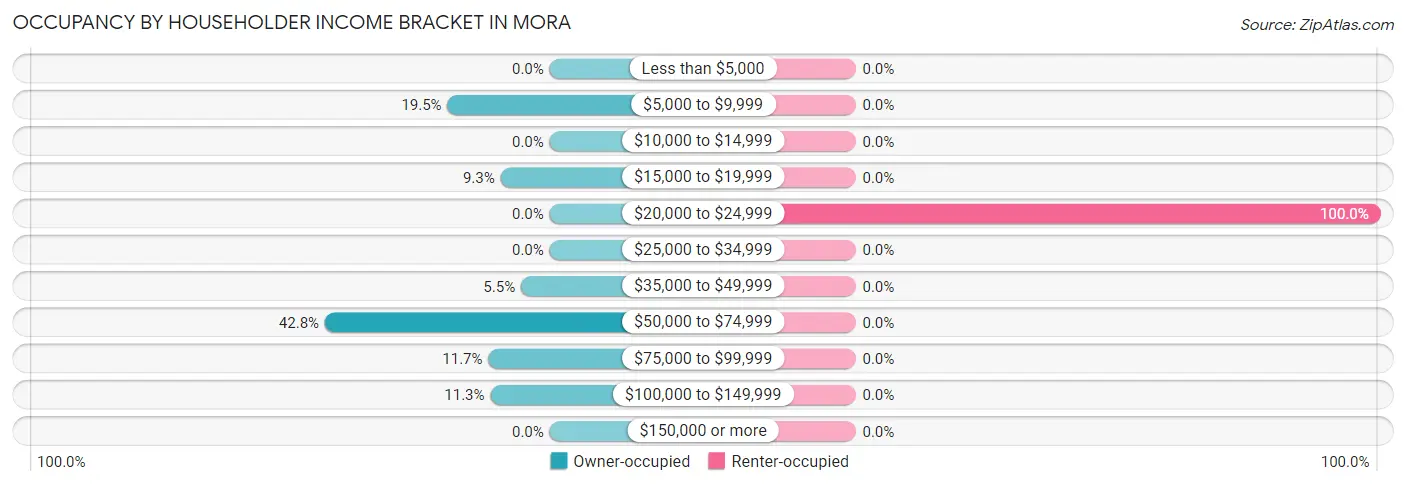
| Income Bracket | Owner-occupied | Renter-occupied |
| Less than $5,000 | 0 (0.0%) | 0 (0.0%) |
| $5,000 to $9,999 | 50 (19.5%) | 0 (0.0%) |
| $10,000 to $14,999 | 0 (0.0%) | 0 (0.0%) |
| $15,000 to $19,999 | 24 (9.3%) | 0 (0.0%) |
| $20,000 to $24,999 | 0 (0.0%) | 12 (100.0%) |
| $25,000 to $34,999 | 0 (0.0%) | 0 (0.0%) |
| $35,000 to $49,999 | 14 (5.4%) | 0 (0.0%) |
| $50,000 to $74,999 | 110 (42.8%) | 0 (0.0%) |
| $75,000 to $99,999 | 30 (11.7%) | 0 (0.0%) |
| $100,000 to $149,999 | 29 (11.3%) | 0 (0.0%) |
| $150,000 or more | 0 (0.0%) | 0 (0.0%) |
| Total | 257 (100.0%) | 12 (100.0%) |
Monthly Housing Cost Tiers in Mora
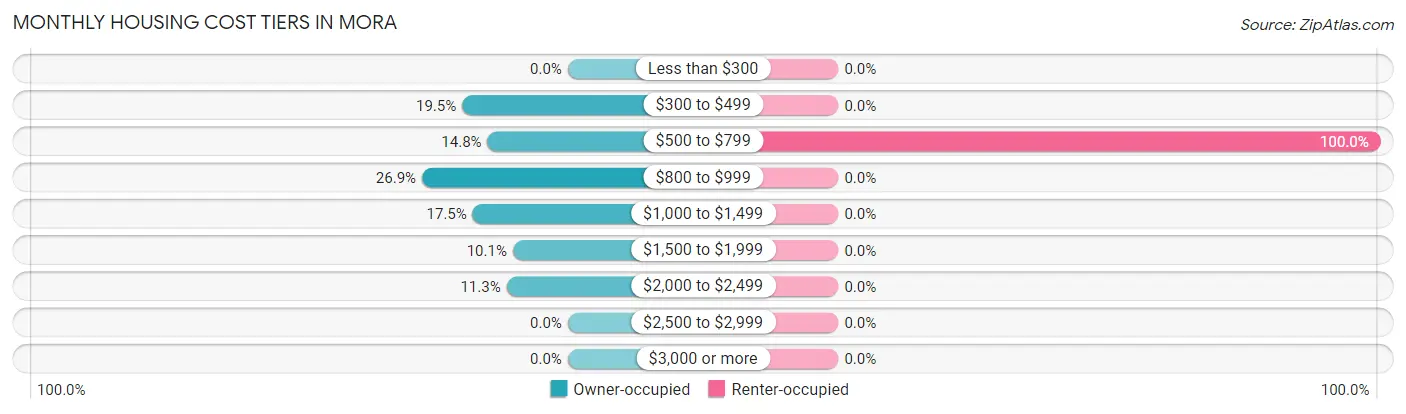
| Monthly Cost | Owner-occupied | Renter-occupied |
| Less than $300 | 0 (0.0%) | 0 (0.0%) |
| $300 to $499 | 50 (19.5%) | 0 (0.0%) |
| $500 to $799 | 38 (14.8%) | 12 (100.0%) |
| $800 to $999 | 69 (26.9%) | 0 (0.0%) |
| $1,000 to $1,499 | 45 (17.5%) | 0 (0.0%) |
| $1,500 to $1,999 | 26 (10.1%) | 0 (0.0%) |
| $2,000 to $2,499 | 29 (11.3%) | 0 (0.0%) |
| $2,500 to $2,999 | 0 (0.0%) | 0 (0.0%) |
| $3,000 or more | 0 (0.0%) | 0 (0.0%) |
| Total | 257 (100.0%) | 12 (100.0%) |
Physical Housing Characteristics in Mora
Housing Structures in Mora
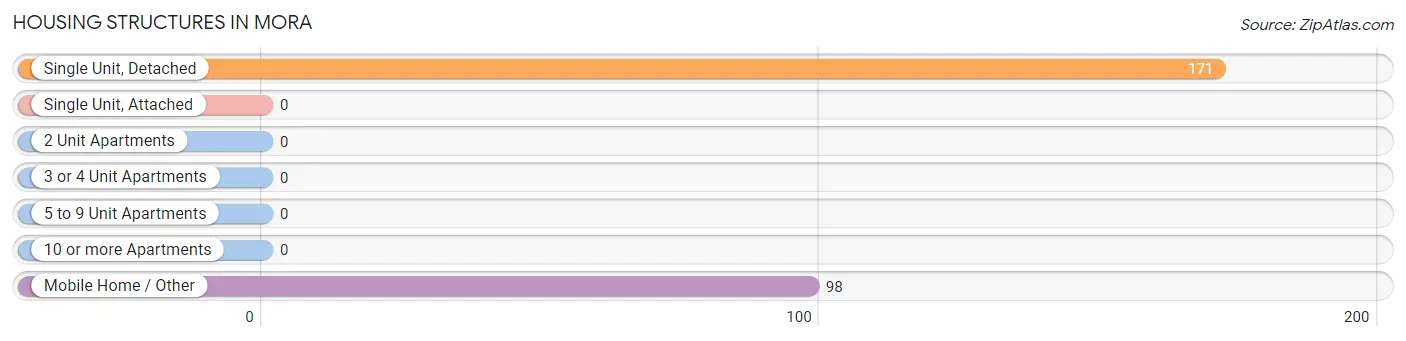
| Structure Type | # Housing Units | % Housing Units |
| Single Unit, Detached | 171 | 63.6% |
| Single Unit, Attached | 0 | 0.0% |
| 2 Unit Apartments | 0 | 0.0% |
| 3 or 4 Unit Apartments | 0 | 0.0% |
| 5 to 9 Unit Apartments | 0 | 0.0% |
| 10 or more Apartments | 0 | 0.0% |
| Mobile Home / Other | 98 | 36.4% |
| Total | 269 | 100.0% |
Housing Structures by Occupancy in Mora
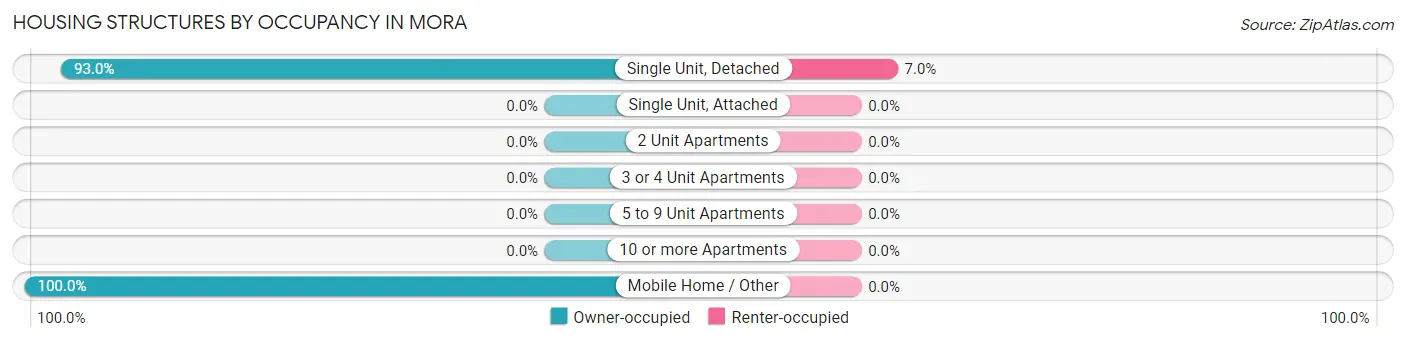
| Structure Type | Owner-occupied | Renter-occupied |
| Single Unit, Detached | 159 (93.0%) | 12 (7.0%) |
| Single Unit, Attached | 0 (0.0%) | 0 (0.0%) |
| 2 Unit Apartments | 0 (0.0%) | 0 (0.0%) |
| 3 or 4 Unit Apartments | 0 (0.0%) | 0 (0.0%) |
| 5 to 9 Unit Apartments | 0 (0.0%) | 0 (0.0%) |
| 10 or more Apartments | 0 (0.0%) | 0 (0.0%) |
| Mobile Home / Other | 98 (100.0%) | 0 (0.0%) |
| Total | 257 (95.5%) | 12 (4.5%) |
Housing Structures by Number of Rooms in Mora
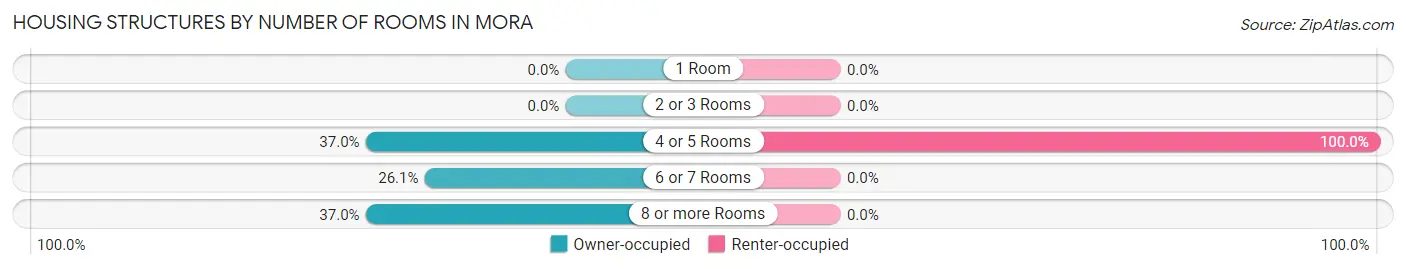
| Number of Rooms | Owner-occupied | Renter-occupied |
| 1 Room | 0 (0.0%) | 0 (0.0%) |
| 2 or 3 Rooms | 0 (0.0%) | 0 (0.0%) |
| 4 or 5 Rooms | 95 (37.0%) | 12 (100.0%) |
| 6 or 7 Rooms | 67 (26.1%) | 0 (0.0%) |
| 8 or more Rooms | 95 (37.0%) | 0 (0.0%) |
| Total | 257 (100.0%) | 12 (100.0%) |
Housing Structure by Heating Type in Mora
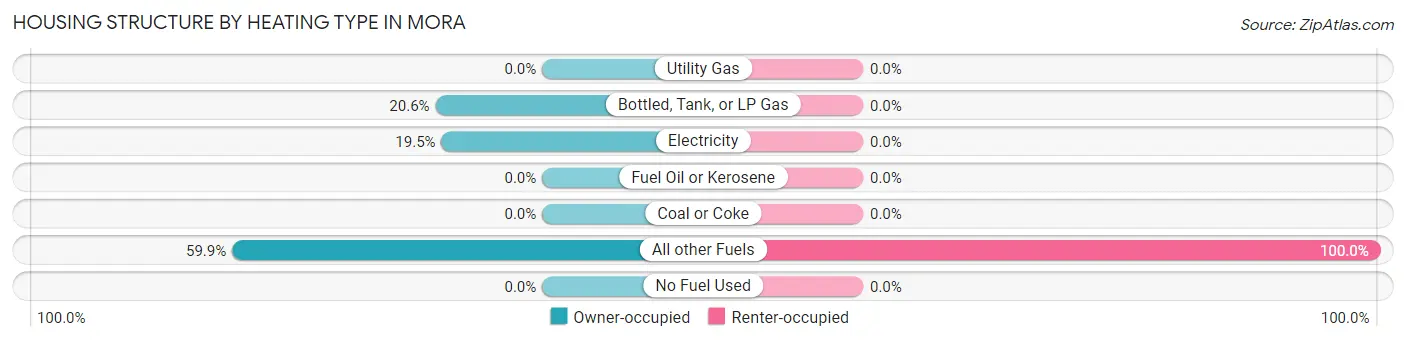
| Heating Type | Owner-occupied | Renter-occupied |
| Utility Gas | 0 (0.0%) | 0 (0.0%) |
| Bottled, Tank, or LP Gas | 53 (20.6%) | 0 (0.0%) |
| Electricity | 50 (19.5%) | 0 (0.0%) |
| Fuel Oil or Kerosene | 0 (0.0%) | 0 (0.0%) |
| Coal or Coke | 0 (0.0%) | 0 (0.0%) |
| All other Fuels | 154 (59.9%) | 12 (100.0%) |
| No Fuel Used | 0 (0.0%) | 0 (0.0%) |
| Total | 257 (100.0%) | 12 (100.0%) |
Household Vehicle Usage in Mora
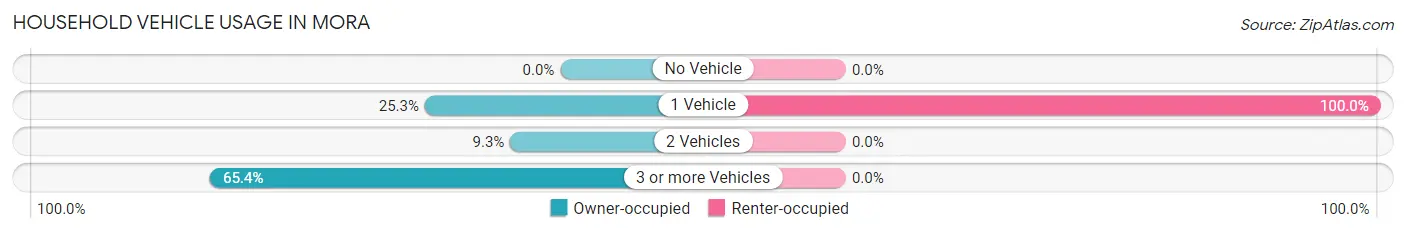
| Vehicles per Household | Owner-occupied | Renter-occupied |
| No Vehicle | 0 (0.0%) | 0 (0.0%) |
| 1 Vehicle | 65 (25.3%) | 12 (100.0%) |
| 2 Vehicles | 24 (9.3%) | 0 (0.0%) |
| 3 or more Vehicles | 168 (65.4%) | 0 (0.0%) |
| Total | 257 (100.0%) | 12 (100.0%) |
Real Estate & Mortgages in Mora
Real Estate and Mortgage Overview in Mora
| Characteristic | Without Mortgage | With Mortgage |
| Housing Units | 158 | 99 |
| Median Property Value | - | - |
| Median Household Income | - | - |
| Monthly Housing Costs | $807 | $0 |
| Real Estate Taxes | - | - |
Property Value by Mortgage Status in Mora
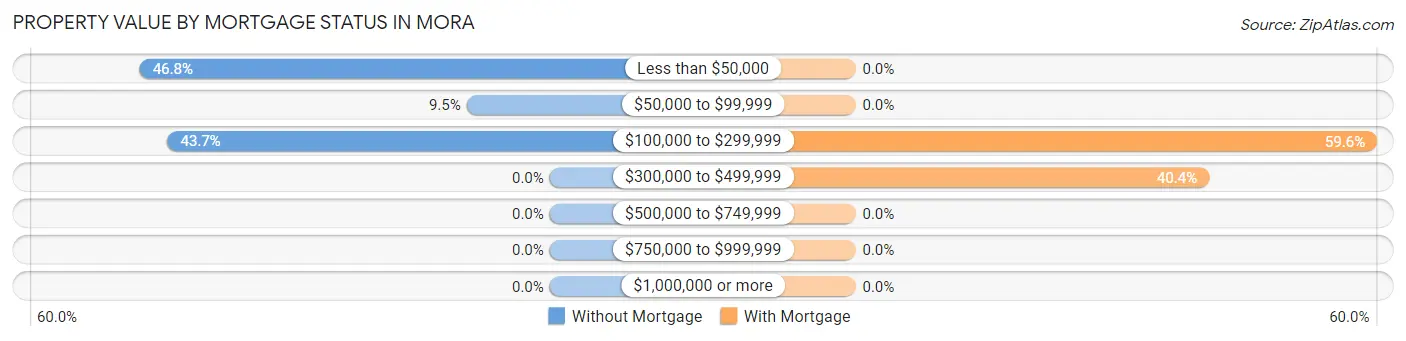
| Property Value | Without Mortgage | With Mortgage |
| Less than $50,000 | 74 (46.8%) | 0 (0.0%) |
| $50,000 to $99,999 | 15 (9.5%) | 0 (0.0%) |
| $100,000 to $299,999 | 69 (43.7%) | 59 (59.6%) |
| $300,000 to $499,999 | 0 (0.0%) | 40 (40.4%) |
| $500,000 to $749,999 | 0 (0.0%) | 0 (0.0%) |
| $750,000 to $999,999 | 0 (0.0%) | 0 (0.0%) |
| $1,000,000 or more | 0 (0.0%) | 0 (0.0%) |
| Total | 158 (100.0%) | 99 (100.0%) |
Household Income by Mortgage Status in Mora
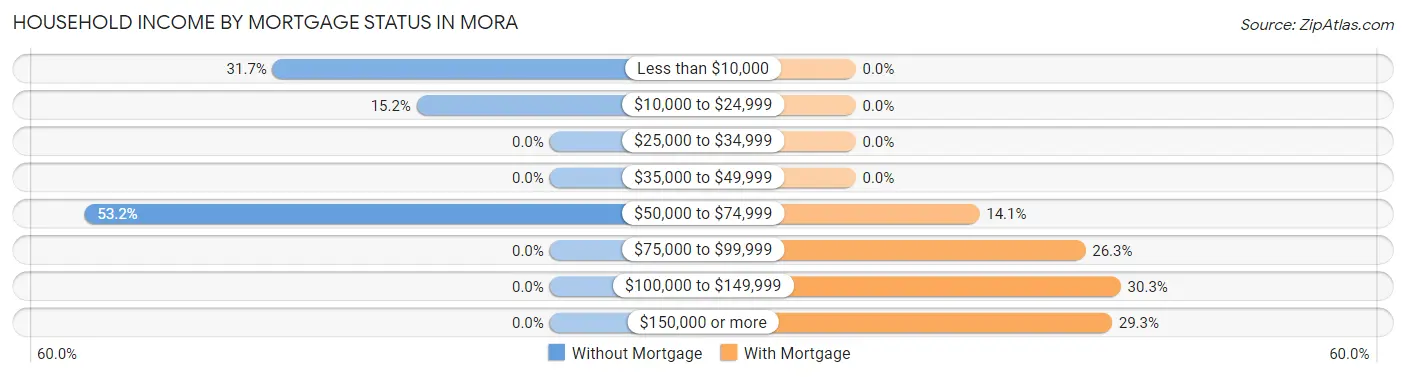
| Household Income | Without Mortgage | With Mortgage |
| Less than $10,000 | 50 (31.7%) | 0 (0.0%) |
| $10,000 to $24,999 | 24 (15.2%) | 0 (0.0%) |
| $25,000 to $34,999 | 0 (0.0%) | 0 (0.0%) |
| $35,000 to $49,999 | 0 (0.0%) | 0 (0.0%) |
| $50,000 to $74,999 | 84 (53.2%) | 14 (14.1%) |
| $75,000 to $99,999 | 0 (0.0%) | 26 (26.3%) |
| $100,000 to $149,999 | 0 (0.0%) | 30 (30.3%) |
| $150,000 or more | 0 (0.0%) | 29 (29.3%) |
| Total | 158 (100.0%) | 99 (100.0%) |
Property Value to Household Income Ratio in Mora
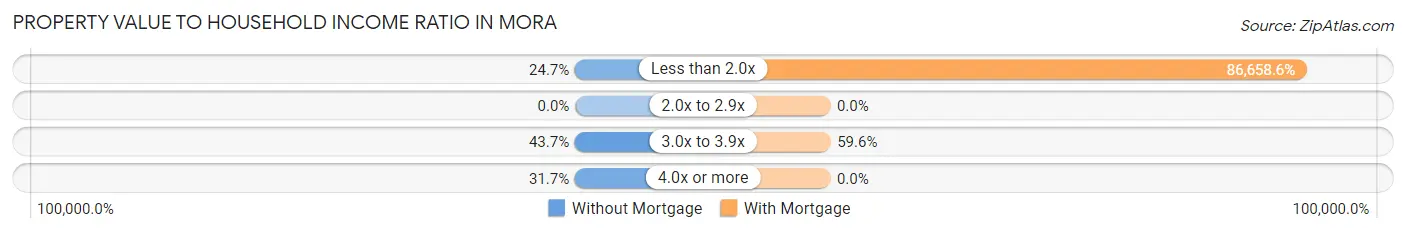
| Value-to-Income Ratio | Without Mortgage | With Mortgage |
| Less than 2.0x | 39 (24.7%) | 85,792 (86,658.6%) |
| 2.0x to 2.9x | 0 (0.0%) | 0 (0.0%) |
| 3.0x to 3.9x | 69 (43.7%) | 59 (59.6%) |
| 4.0x or more | 50 (31.7%) | 0 (0.0%) |
| Total | 158 (100.0%) | 99 (100.0%) |
Real Estate Taxes by Mortgage Status in Mora
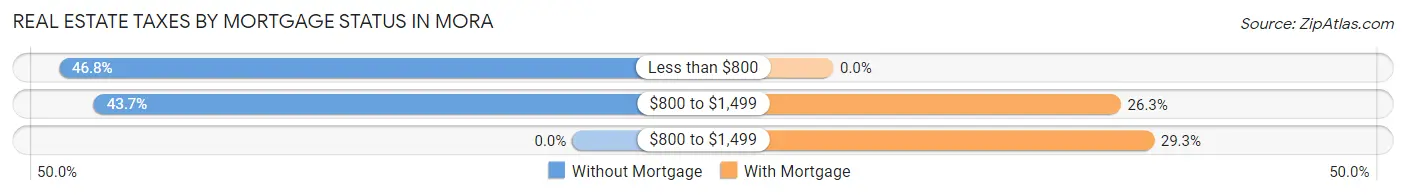
| Property Taxes | Without Mortgage | With Mortgage |
| Less than $800 | 74 (46.8%) | 0 (0.0%) |
| $800 to $1,499 | 69 (43.7%) | 26 (26.3%) |
| $800 to $1,499 | 0 (0.0%) | 29 (29.3%) |
| Total | 158 (100.0%) | 99 (100.0%) |
Health & Disability in Mora
Health Insurance Coverage by Age in Mora
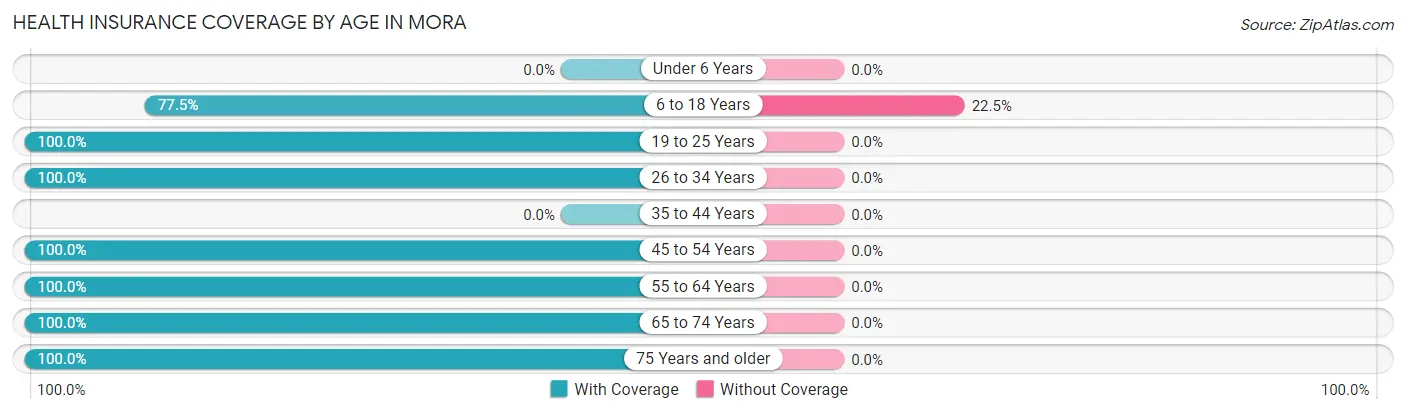
| Age Bracket | With Coverage | Without Coverage |
| Under 6 Years | 0 (0.0%) | 0 (0.0%) |
| 6 to 18 Years | 107 (77.5%) | 31 (22.5%) |
| 19 to 25 Years | 205 (100.0%) | 0 (0.0%) |
| 26 to 34 Years | 36 (100.0%) | 0 (0.0%) |
| 35 to 44 Years | 0 (0.0%) | 0 (0.0%) |
| 45 to 54 Years | 26 (100.0%) | 0 (0.0%) |
| 55 to 64 Years | 198 (100.0%) | 0 (0.0%) |
| 65 to 74 Years | 133 (100.0%) | 0 (0.0%) |
| 75 Years and older | 57 (100.0%) | 0 (0.0%) |
| Total | 762 (96.1%) | 31 (3.9%) |
Health Insurance Coverage by Citizenship Status in Mora
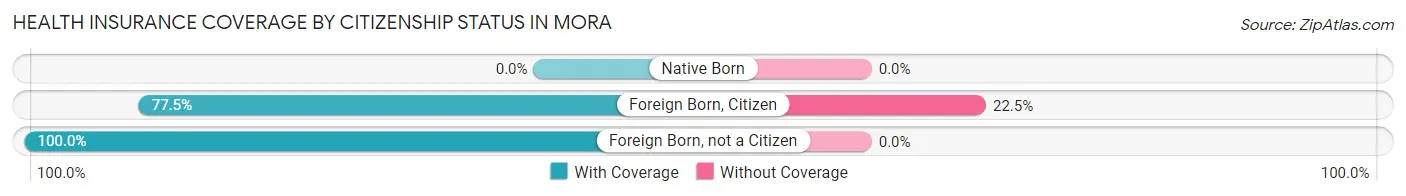
| Citizenship Status | With Coverage | Without Coverage |
| Native Born | 0 (0.0%) | 0 (0.0%) |
| Foreign Born, Citizen | 107 (77.5%) | 31 (22.5%) |
| Foreign Born, not a Citizen | 205 (100.0%) | 0 (0.0%) |
Health Insurance Coverage by Household Income in Mora
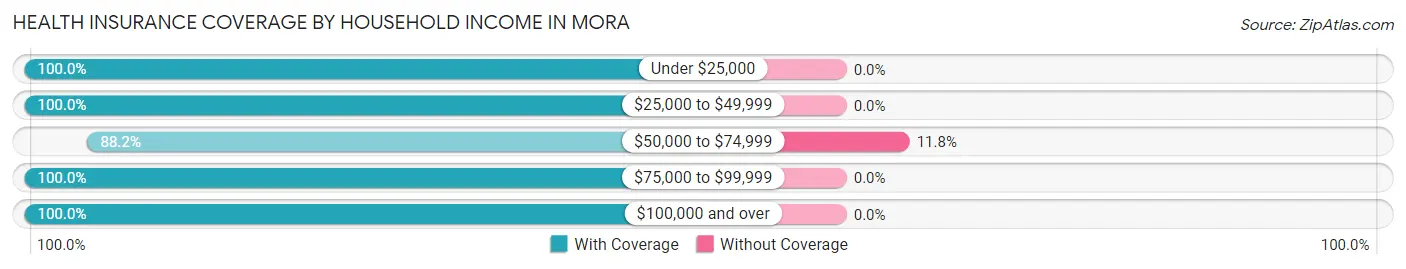
| Household Income | With Coverage | Without Coverage |
| Under $25,000 | 136 (100.0%) | 0 (0.0%) |
| $25,000 to $49,999 | 101 (100.0%) | 0 (0.0%) |
| $50,000 to $74,999 | 232 (88.2%) | 31 (11.8%) |
| $75,000 to $99,999 | 119 (100.0%) | 0 (0.0%) |
| $100,000 and over | 174 (100.0%) | 0 (0.0%) |
Public vs Private Health Insurance Coverage by Age in Mora
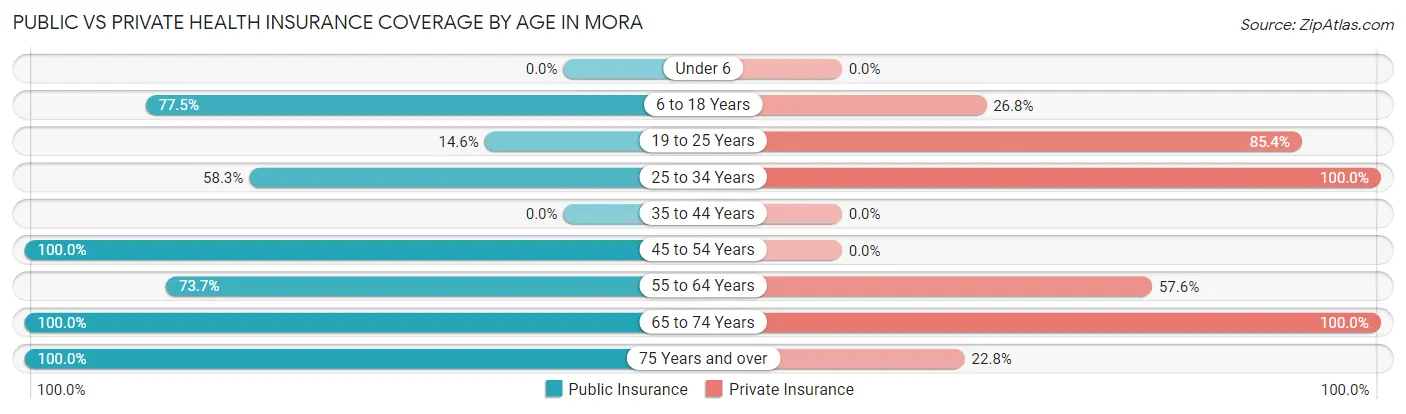
| Age Bracket | Public Insurance | Private Insurance |
| Under 6 | 0 (0.0%) | 0 (0.0%) |
| 6 to 18 Years | 107 (77.5%) | 37 (26.8%) |
| 19 to 25 Years | 30 (14.6%) | 175 (85.4%) |
| 25 to 34 Years | 21 (58.3%) | 36 (100.0%) |
| 35 to 44 Years | 0 (0.0%) | 0 (0.0%) |
| 45 to 54 Years | 26 (100.0%) | 0 (0.0%) |
| 55 to 64 Years | 146 (73.7%) | 114 (57.6%) |
| 65 to 74 Years | 133 (100.0%) | 133 (100.0%) |
| 75 Years and over | 57 (100.0%) | 13 (22.8%) |
| Total | 520 (65.6%) | 508 (64.1%) |
Disability Status by Sex by Age in Mora
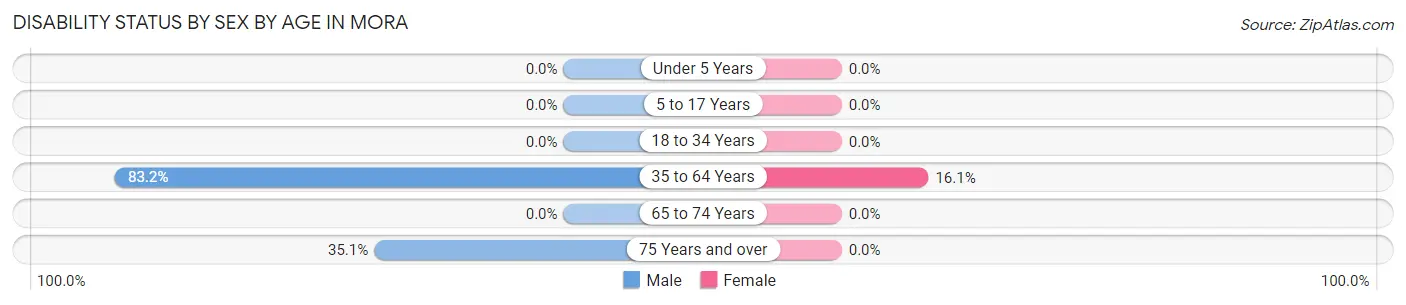
| Age Bracket | Male | Female |
| Under 5 Years | 0 (0.0%) | 0 (0.0%) |
| 5 to 17 Years | 0 (0.0%) | 0 (0.0%) |
| 18 to 34 Years | 0 (0.0%) | 0 (0.0%) |
| 35 to 64 Years | 114 (83.2%) | 14 (16.1%) |
| 65 to 74 Years | 0 (0.0%) | 0 (0.0%) |
| 75 Years and over | 13 (35.1%) | 0 (0.0%) |
Disability Class by Sex by Age in Mora
Disability Class: Hearing Difficulty
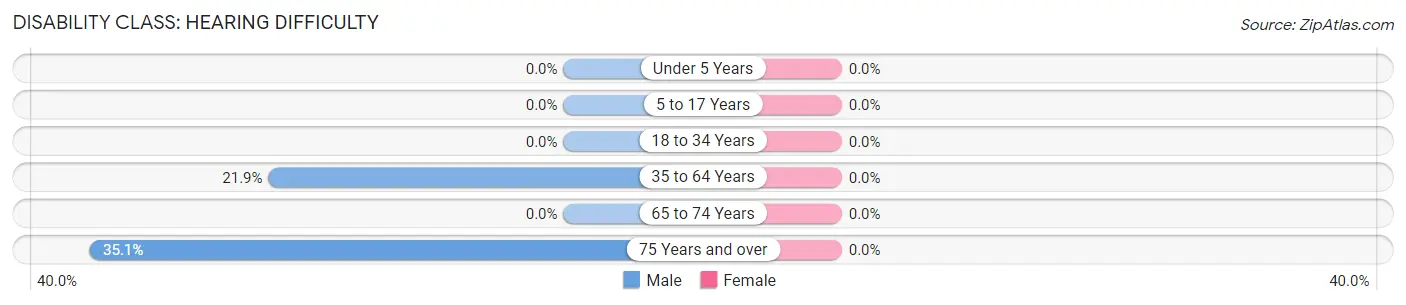
| Age Bracket | Male | Female |
| Under 5 Years | 0 (0.0%) | 0 (0.0%) |
| 5 to 17 Years | 0 (0.0%) | 0 (0.0%) |
| 18 to 34 Years | 0 (0.0%) | 0 (0.0%) |
| 35 to 64 Years | 30 (21.9%) | 0 (0.0%) |
| 65 to 74 Years | 0 (0.0%) | 0 (0.0%) |
| 75 Years and over | 13 (35.1%) | 0 (0.0%) |
Disability Class: Vision Difficulty
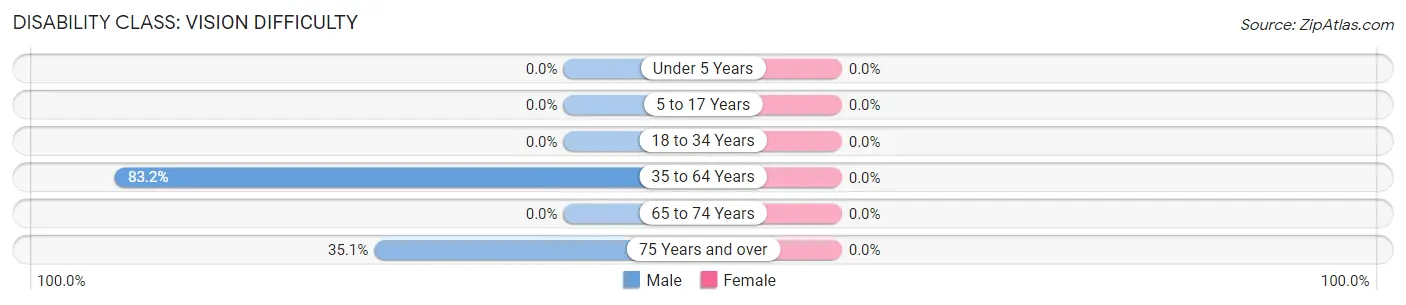
| Age Bracket | Male | Female |
| Under 5 Years | 0 (0.0%) | 0 (0.0%) |
| 5 to 17 Years | 0 (0.0%) | 0 (0.0%) |
| 18 to 34 Years | 0 (0.0%) | 0 (0.0%) |
| 35 to 64 Years | 114 (83.2%) | 0 (0.0%) |
| 65 to 74 Years | 0 (0.0%) | 0 (0.0%) |
| 75 Years and over | 13 (35.1%) | 0 (0.0%) |
Disability Class: Cognitive Difficulty
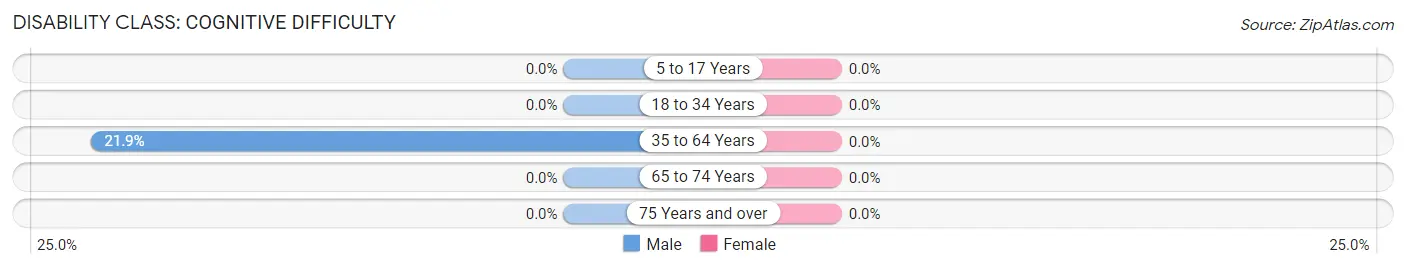
| Age Bracket | Male | Female |
| 5 to 17 Years | 0 (0.0%) | 0 (0.0%) |
| 18 to 34 Years | 0 (0.0%) | 0 (0.0%) |
| 35 to 64 Years | 30 (21.9%) | 0 (0.0%) |
| 65 to 74 Years | 0 (0.0%) | 0 (0.0%) |
| 75 Years and over | 0 (0.0%) | 0 (0.0%) |
Disability Class: Ambulatory Difficulty
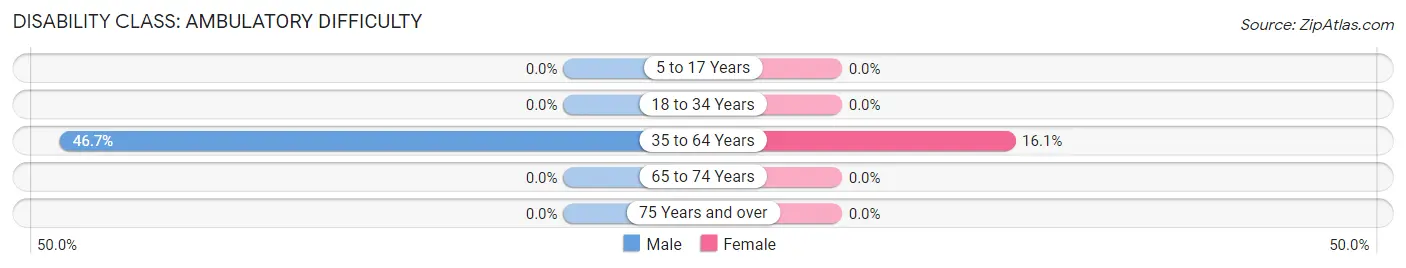
| Age Bracket | Male | Female |
| 5 to 17 Years | 0 (0.0%) | 0 (0.0%) |
| 18 to 34 Years | 0 (0.0%) | 0 (0.0%) |
| 35 to 64 Years | 64 (46.7%) | 14 (16.1%) |
| 65 to 74 Years | 0 (0.0%) | 0 (0.0%) |
| 75 Years and over | 0 (0.0%) | 0 (0.0%) |
Disability Class: Self-Care Difficulty
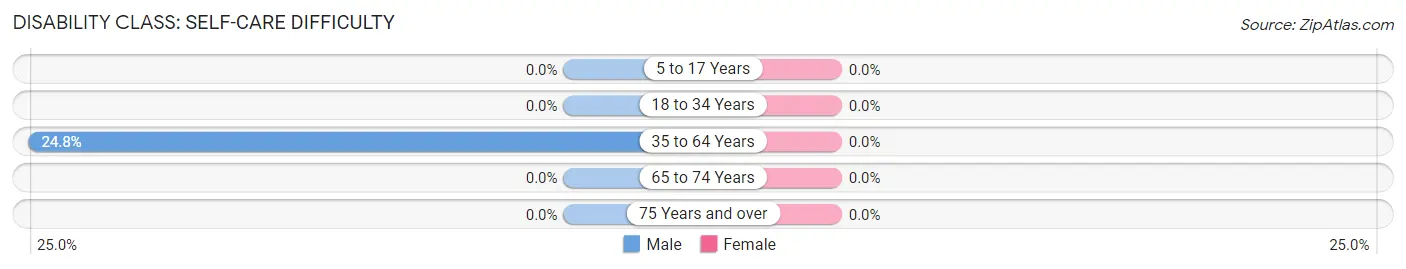
| Age Bracket | Male | Female |
| 5 to 17 Years | 0 (0.0%) | 0 (0.0%) |
| 18 to 34 Years | 0 (0.0%) | 0 (0.0%) |
| 35 to 64 Years | 34 (24.8%) | 0 (0.0%) |
| 65 to 74 Years | 0 (0.0%) | 0 (0.0%) |
| 75 Years and over | 0 (0.0%) | 0 (0.0%) |
Technology Access in Mora
Computing Device Access in Mora
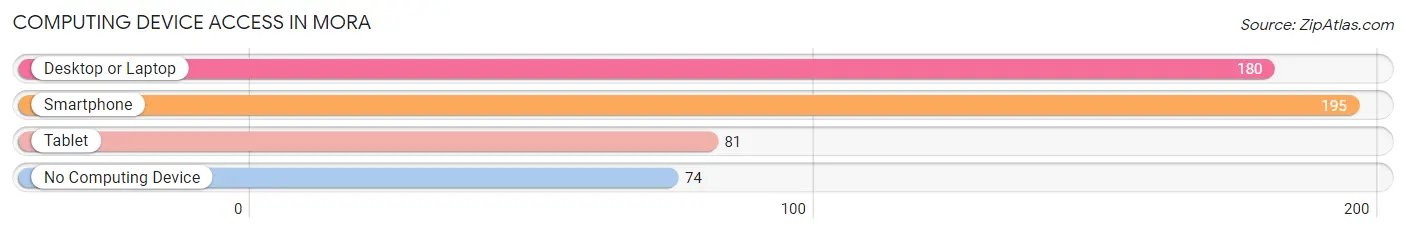
| Device Type | # Households | % Households |
| Desktop or Laptop | 180 | 66.9% |
| Smartphone | 195 | 72.5% |
| Tablet | 81 | 30.1% |
| No Computing Device | 74 | 27.5% |
| Total | 269 | 100.0% |
Internet Access in Mora
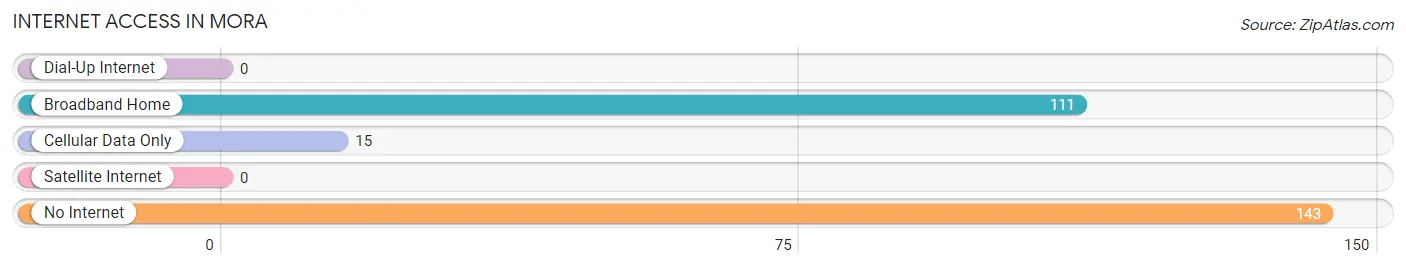
| Internet Type | # Households | % Households |
| Dial-Up Internet | 0 | 0.0% |
| Broadband Home | 111 | 41.3% |
| Cellular Data Only | 15 | 5.6% |
| Satellite Internet | 0 | 0.0% |
| No Internet | 143 | 53.2% |
| Total | 269 | 100.0% |
Mora Summary
Mora, New Mexico is a small town located in the northeastern part of the state. It is situated in Mora County, which is part of the Sangre de Cristo Mountains. The town is located at an elevation of 6,890 feet and has a population of approximately 1,800 people.
History
Mora was founded in 1835 by Spanish settlers who were looking for a place to settle and raise their families. The town was originally called El Rito de los Frijoles, which translates to “the river of beans”. The name was changed to Mora in 1846, after the Mora River which runs through the area.
The town was an important stop on the Santa Fe Trail, and was a major trading post for the area. In the late 1800s, the town was a major center for sheep and cattle ranching. The town was also home to a number of mines, including the Mora Mine, which was one of the largest silver mines in the state.
Geography
Mora is located in the northeastern part of New Mexico, in Mora County. The town is situated in the Sangre de Cristo Mountains, at an elevation of 6,890 feet. The town is surrounded by the Carson National Forest, which provides a variety of outdoor activities for visitors.
The town is located along the Mora River, which is a tributary of the Rio Grande. The river is a popular spot for fishing, and is home to a variety of species including trout, bass, and catfish.
Economy
Mora’s economy is largely based on agriculture and tourism. The town is home to a number of farms and ranches, which produce a variety of crops including hay, corn, and wheat. The town is also home to a number of tourist attractions, including the Mora Valley Winery, the Mora Valley Museum, and the Mora Valley Golf Course.
The town is also home to a number of small businesses, including restaurants, shops, and galleries. The town is also home to a number of manufacturing companies, which produce a variety of products including furniture, clothing, and jewelry.
Demographics
As of the 2010 census, the population of Mora was 1,811. The town is predominantly Hispanic, with a population that is approximately 80% Hispanic. The median household income in the town is $30,000, and the median age is 37.
Mora is a small town with a rich history and a vibrant economy. The town is home to a variety of attractions, including the Mora Valley Winery, the Mora Valley Museum, and the Mora Valley Golf Course. The town is also home to a number of small businesses, which provide a variety of goods and services to the local community. The town is predominantly Hispanic, and has a median household income of $30,000.
Common Questions
What is Per Capita Income in Mora?
Per Capita income in Mora is $18,541.
What is the Median Family Income in Mora?
Median Family Income in Mora is $70,670.
What is the Median Household income in Mora?
Median Household Income in Mora is $64,375.
What is Inequality or Gini Index in Mora?
Inequality or Gini Index in Mora is 0.33.
What is the Total Population of Mora?
Total Population of Mora is 793.
What is the Total Male Population of Mora?
Total Male Population of Mora is 337.
What is the Total Female Population of Mora?
Total Female Population of Mora is 456.
What is the Ratio of Males per 100 Females in Mora?
There are 73.90 Males per 100 Females in Mora.
What is the Ratio of Females per 100 Males in Mora?
There are 135.31 Females per 100 Males in Mora.
What is the Median Population Age in Mora?
Median Population Age in Mora is 53.4 Years.
What is the Average Family Size in Mora
Average Family Size in Mora is 3.4 People.
What is the Average Household Size in Mora
Average Household Size in Mora is 3.0 People.
How Large is the Labor Force in Mora?
There are 371 People in the Labor Forcein in Mora.
What is the Percentage of People in the Labor Force in Mora?
53.6% of People are in the Labor Force in Mora.