Zip Codes with the Highest Percentage of Population Employed in Food Preparation & Serving in Rio Rancho, NM
RELATED REPORTS & OPTIONS
Food Preparation & Serving
Rio Rancho
Compare Zip Codes
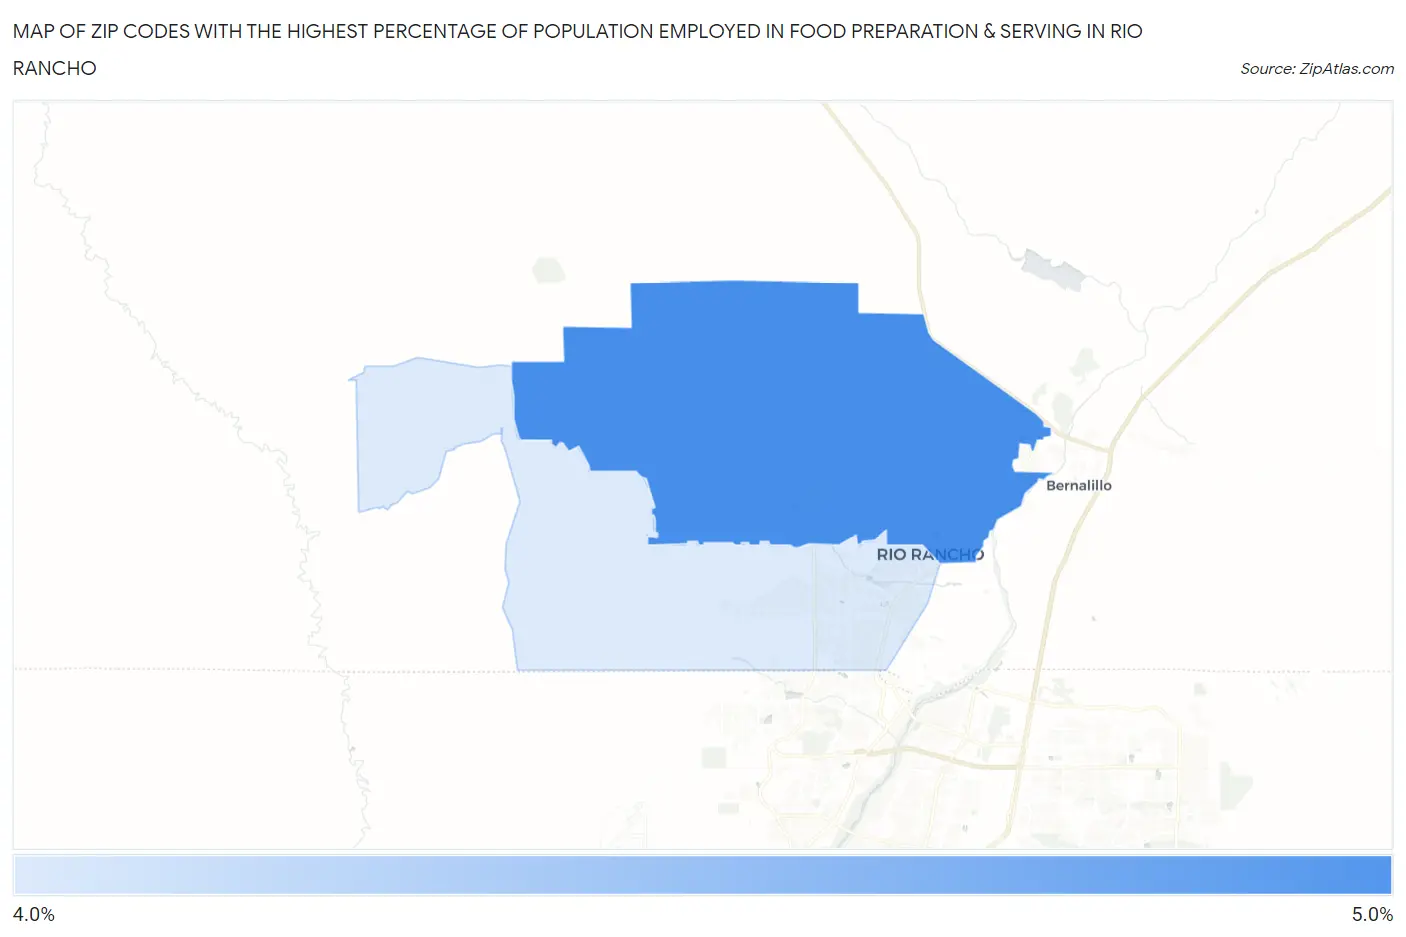
Map of Zip Codes with the Highest Percentage of Population Employed in Food Preparation & Serving in Rio Rancho
4.5%
4.8%
Zip Codes with the Highest Percentage of Population Employed in Food Preparation & Serving in Rio Rancho, NM
| Zip Code | % Employed | vs State | vs National | |
| 1. | 87144 | 4.8% | 5.8%(-0.980)#140 | 5.3%(-0.511)#13,841 |
| 2. | 87124 | 4.5% | 5.8%(-1.22)#146 | 5.3%(-0.752)#14,882 |
1
Common Questions
What are the Top Zip Codes with the Highest Percentage of Population Employed in Food Preparation & Serving in Rio Rancho, NM?
Top Zip Codes with the Highest Percentage of Population Employed in Food Preparation & Serving in Rio Rancho, NM are:
What zip code has the Highest Percentage of Population Employed in Food Preparation & Serving in Rio Rancho, NM?
87144 has the Highest Percentage of Population Employed in Food Preparation & Serving in Rio Rancho, NM with 4.8%.
What is the Percentage of Population Employed in Food Preparation & Serving in Rio Rancho, NM?
Percentage of Population Employed in Food Preparation & Serving in Rio Rancho is 4.6%.
What is the Percentage of Population Employed in Food Preparation & Serving in New Mexico?
Percentage of Population Employed in Food Preparation & Serving in New Mexico is 5.8%.
What is the Percentage of Population Employed in Food Preparation & Serving in the United States?
Percentage of Population Employed in Food Preparation & Serving in the United States is 5.3%.