Lake Park, NC Map & Demographics
Lake Park Map
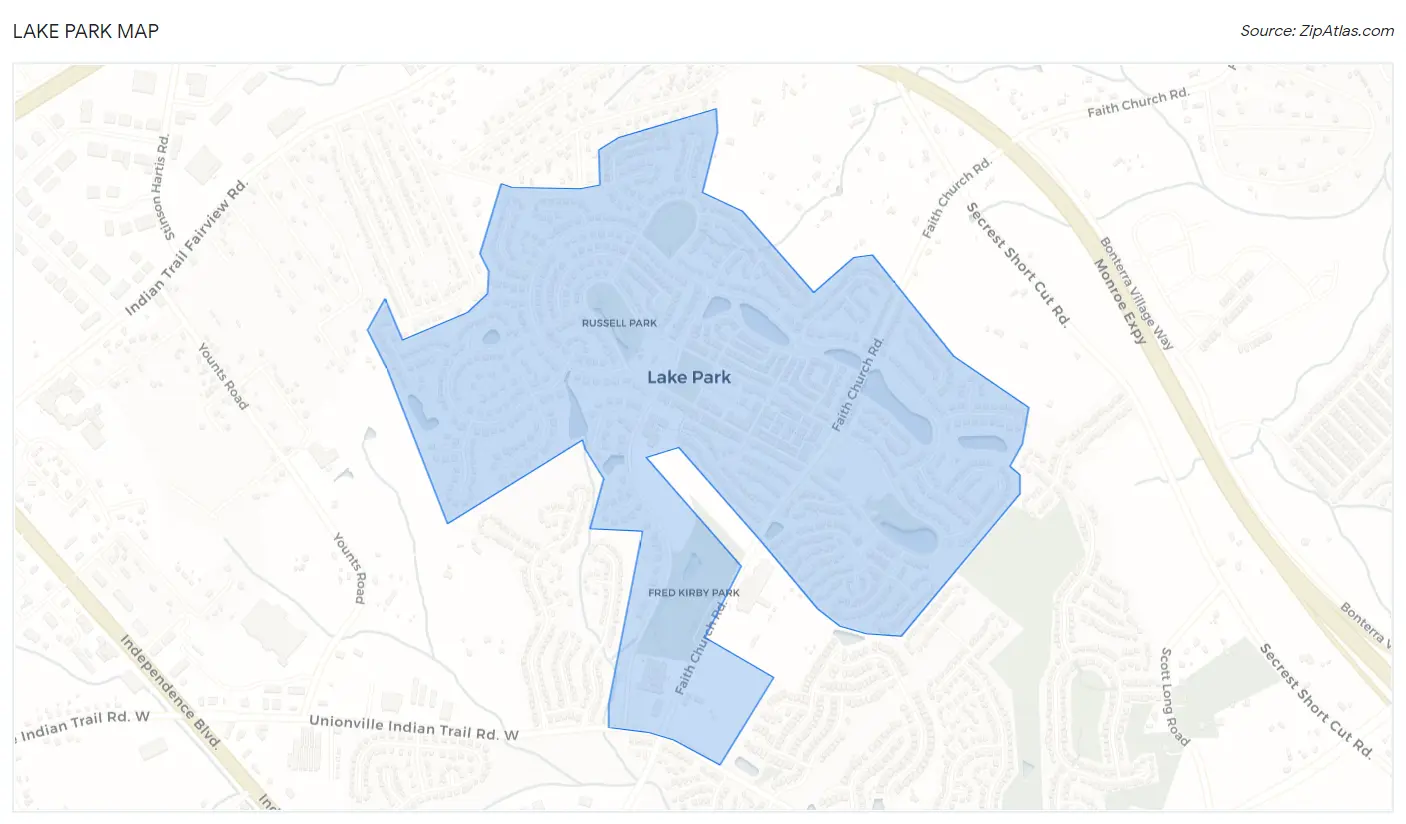
Lake Park Overview
$36,870
PER CAPITA INCOME
$83,750
AVG FAMILY INCOME
$73,972
AVG HOUSEHOLD INCOME
48.1%
WAGE / INCOME GAP [ % ]
51.9¢/ $1
WAGE / INCOME GAP [ $ ]
0.37
INEQUALITY / GINI INDEX
3,342
TOTAL POPULATION
1,495
MALE POPULATION
1,847
FEMALE POPULATION
80.94
MALES / 100 FEMALES
123.55
FEMALES / 100 MALES
40.0
MEDIAN AGE
3.2
AVG FAMILY SIZE
2.5
AVG HOUSEHOLD SIZE
1,818
LABOR FORCE [ PEOPLE ]
68.5%
PERCENT IN LABOR FORCE
3.6%
UNEMPLOYMENT RATE
Lake Park Area Codes
Income in Lake Park
Income Overview in Lake Park
Per Capita Income in Lake Park is $36,870, while median incomes of families and households are $83,750 and $73,972 respectively.
| Characteristic | Number | Measure |
| Per Capita Income | 3,342 | $36,870 |
| Median Family Income | 876 | $83,750 |
| Mean Family Income | 876 | $105,311 |
| Median Household Income | 1,299 | $73,972 |
| Mean Household Income | 1,299 | $92,374 |
| Income Deficit | 876 | $0 |
| Wage / Income Gap (%) | 3,342 | 48.05% |
| Wage / Income Gap ($) | 3,342 | 51.95¢ per $1 |
| Gini / Inequality Index | 3,342 | 0.37 |
Earnings by Sex in Lake Park
Average Earnings in Lake Park are $41,408, $58,171 for men and $30,217 for women, a difference of 48.0%.
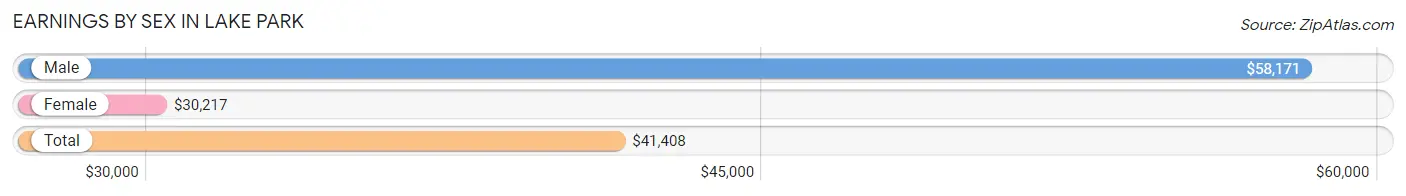
| Sex | Number | Average Earnings |
| Male | 851 (46.2%) | $58,171 |
| Female | 990 (53.8%) | $30,217 |
| Total | 1,841 (100.0%) | $41,408 |
Earnings by Sex by Income Bracket in Lake Park
The most common earnings brackets in Lake Park are $100,000+ for men (160 | 18.8%) and $25,000 to $29,999 for women (101 | 10.2%).
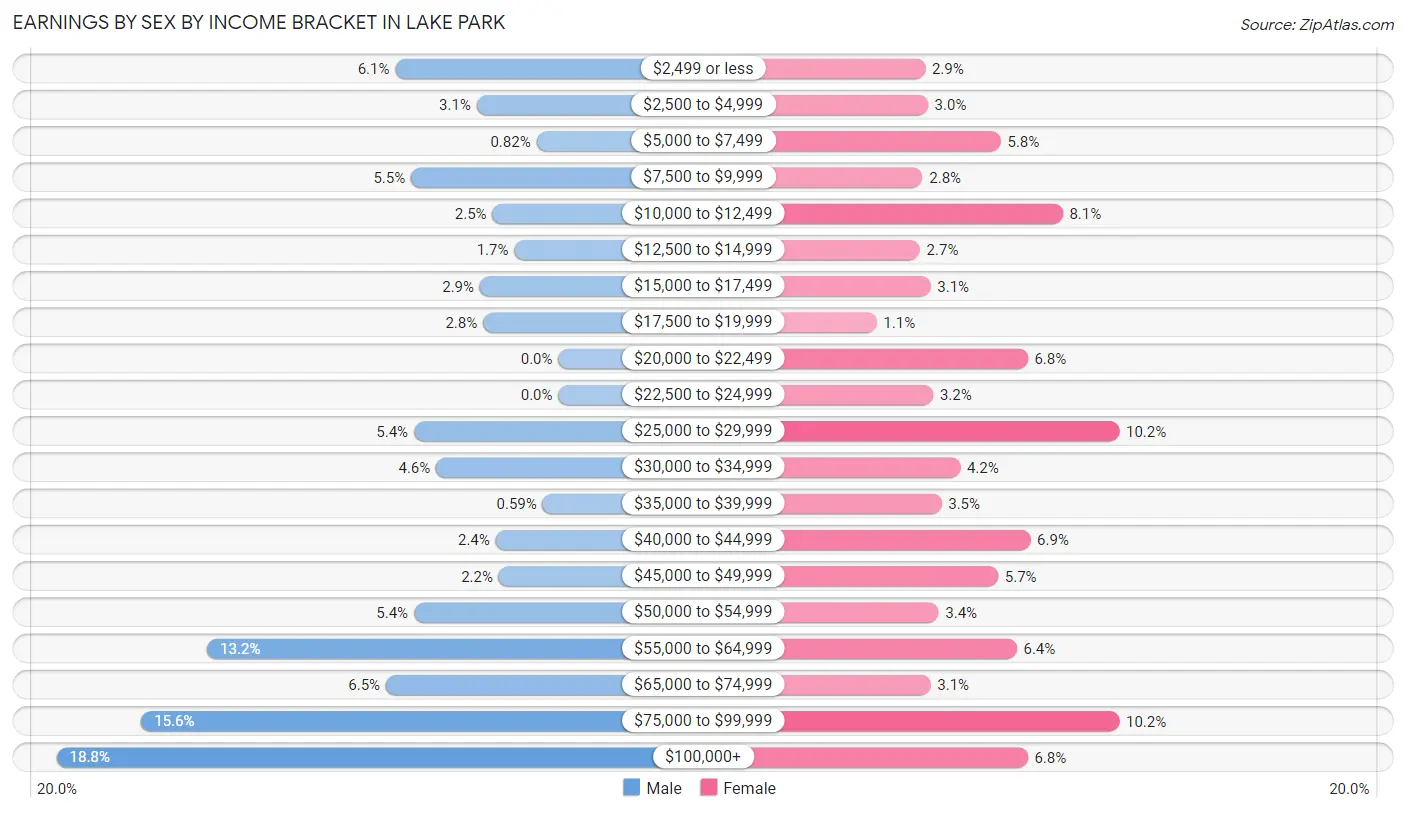
| Income | Male | Female |
| $2,499 or less | 52 (6.1%) | 29 (2.9%) |
| $2,500 to $4,999 | 26 (3.1%) | 30 (3.0%) |
| $5,000 to $7,499 | 7 (0.8%) | 57 (5.8%) |
| $7,500 to $9,999 | 47 (5.5%) | 28 (2.8%) |
| $10,000 to $12,499 | 21 (2.5%) | 80 (8.1%) |
| $12,500 to $14,999 | 14 (1.7%) | 27 (2.7%) |
| $15,000 to $17,499 | 25 (2.9%) | 31 (3.1%) |
| $17,500 to $19,999 | 24 (2.8%) | 11 (1.1%) |
| $20,000 to $22,499 | 0 (0.0%) | 67 (6.8%) |
| $22,500 to $24,999 | 0 (0.0%) | 32 (3.2%) |
| $25,000 to $29,999 | 46 (5.4%) | 101 (10.2%) |
| $30,000 to $34,999 | 39 (4.6%) | 42 (4.2%) |
| $35,000 to $39,999 | 5 (0.6%) | 35 (3.5%) |
| $40,000 to $44,999 | 20 (2.4%) | 68 (6.9%) |
| $45,000 to $49,999 | 19 (2.2%) | 56 (5.7%) |
| $50,000 to $54,999 | 46 (5.4%) | 34 (3.4%) |
| $55,000 to $64,999 | 112 (13.2%) | 63 (6.4%) |
| $65,000 to $74,999 | 55 (6.5%) | 31 (3.1%) |
| $75,000 to $99,999 | 133 (15.6%) | 101 (10.2%) |
| $100,000+ | 160 (18.8%) | 67 (6.8%) |
| Total | 851 (100.0%) | 990 (100.0%) |
Earnings by Sex by Educational Attainment in Lake Park
Average earnings in Lake Park are $60,161 for men and $37,000 for women, a difference of 38.5%. Men with an educational attainment of high school diploma enjoy the highest average annual earnings of $90,000, while those with graduate degree education earn the least with $56,250. Women with an educational attainment of bachelor's degree earn the most with the average annual earnings of $49,167, while those with less than high school education have the smallest earnings of $21,827.
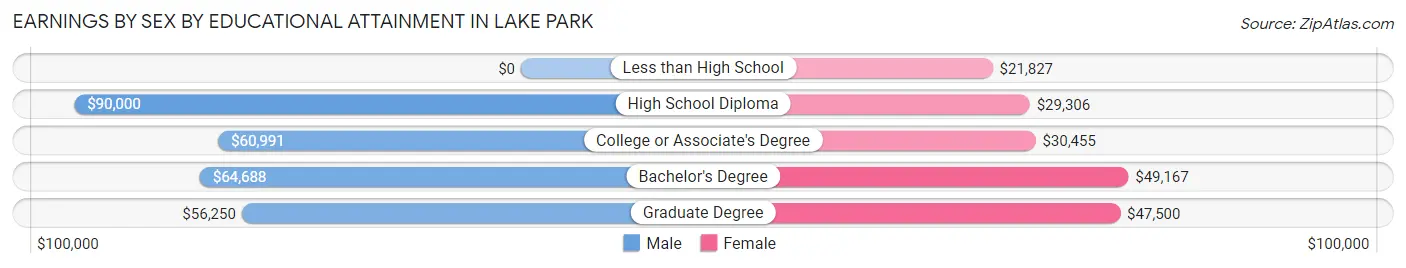
| Educational Attainment | Male Income | Female Income |
| Less than High School | - | - |
| High School Diploma | $90,000 | $29,306 |
| College or Associate's Degree | $60,991 | $30,455 |
| Bachelor's Degree | $64,688 | $49,167 |
| Graduate Degree | $56,250 | $47,500 |
| Total | $60,161 | $37,000 |
Family Income in Lake Park
Family Income Brackets in Lake Park
According to the Lake Park family income data, there are 201 families falling into the $100,000 to $149,999 income range, which is the most common income bracket and makes up 23.0% of all families.
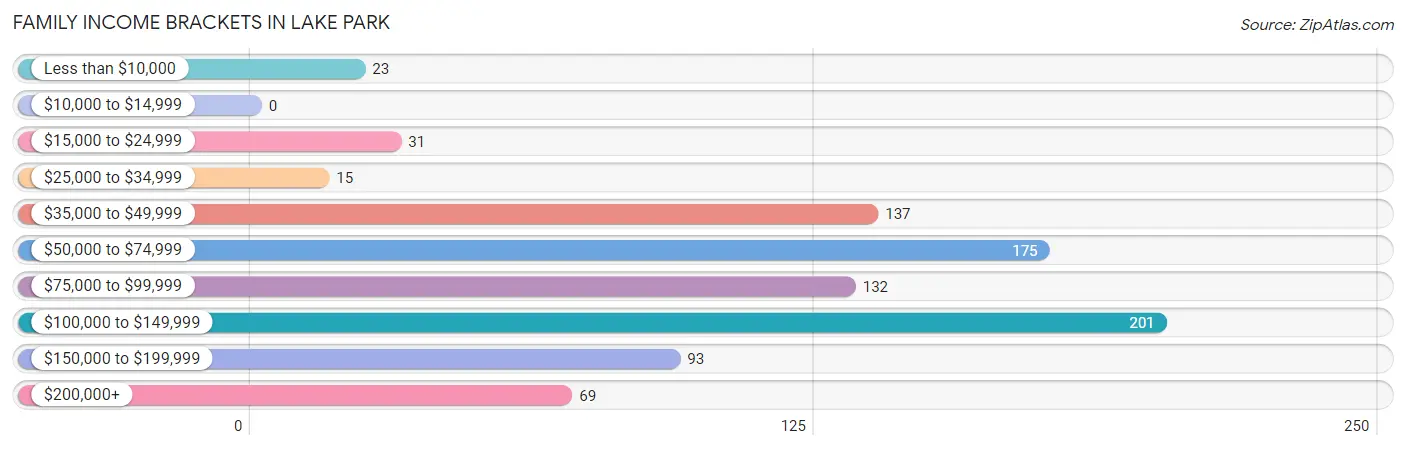
| Income Bracket | # Families | % Families |
| Less than $10,000 | 23 | 2.6% |
| $10,000 to $14,999 | 0 | 0.0% |
| $15,000 to $24,999 | 31 | 3.5% |
| $25,000 to $34,999 | 15 | 1.7% |
| $35,000 to $49,999 | 137 | 15.6% |
| $50,000 to $74,999 | 175 | 20.0% |
| $75,000 to $99,999 | 132 | 15.1% |
| $100,000 to $149,999 | 201 | 22.9% |
| $150,000 to $199,999 | 93 | 10.6% |
| $200,000+ | 69 | 7.9% |
Family Income by Famaliy Size in Lake Park
3-person families (178 | 20.3%) account for the highest median family income in Lake Park with $91,833 per family, while 2-person families (381 | 43.5%) have the highest median income of $38,875 per family member.
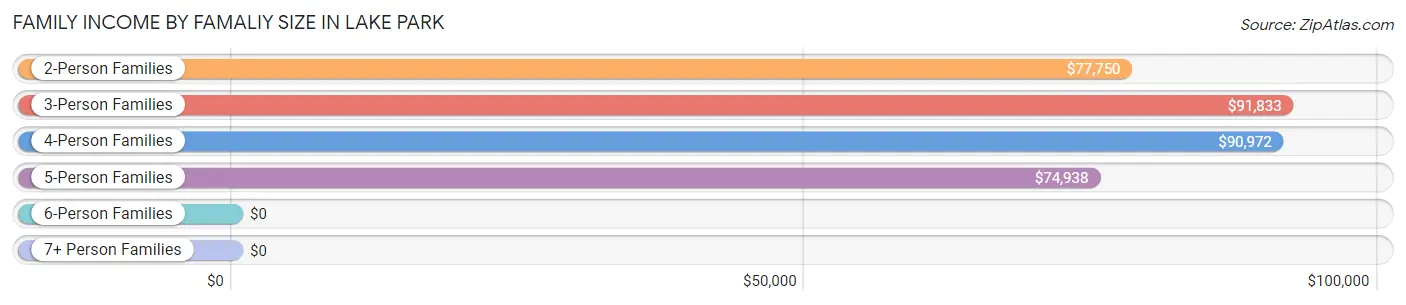
| Income Bracket | # Families | Median Income |
| 2-Person Families | 381 (43.5%) | $77,750 |
| 3-Person Families | 178 (20.3%) | $91,833 |
| 4-Person Families | 223 (25.5%) | $90,972 |
| 5-Person Families | 77 (8.8%) | $74,938 |
| 6-Person Families | 5 (0.6%) | $0 |
| 7+ Person Families | 12 (1.4%) | $0 |
| Total | 876 (100.0%) | $83,750 |
Family Income by Number of Earners in Lake Park
The median family income in Lake Park is $83,750, with families comprising 3+ earners (126) having the highest median family income of $142,885, while families with no earners (107) have the lowest median family income of $60,972, accounting for 14.4% and 12.2% of families, respectively.
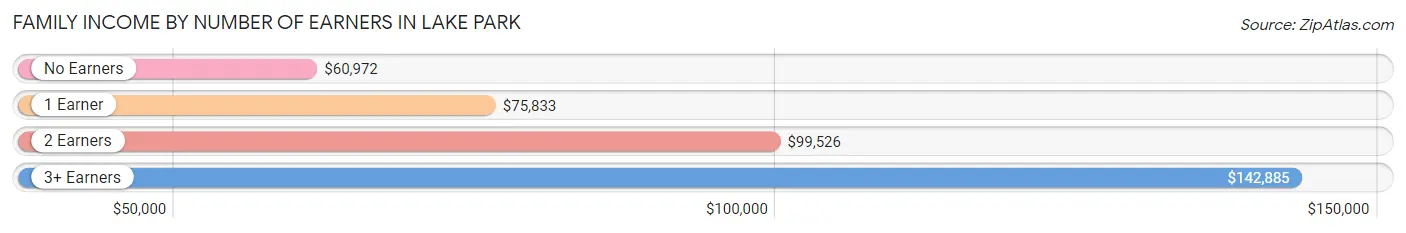
| Number of Earners | # Families | Median Income |
| No Earners | 107 (12.2%) | $60,972 |
| 1 Earner | 240 (27.4%) | $75,833 |
| 2 Earners | 403 (46.0%) | $99,526 |
| 3+ Earners | 126 (14.4%) | $142,885 |
| Total | 876 (100.0%) | $83,750 |
Household Income in Lake Park
Household Income Brackets in Lake Park
With 278 households falling in the category, the $50,000 to $74,999 income range is the most frequent in Lake Park, accounting for 21.4% of all households. In contrast, only 19 households (1.5%) fall into the $10,000 to $14,999 income bracket, making it the least populous group.
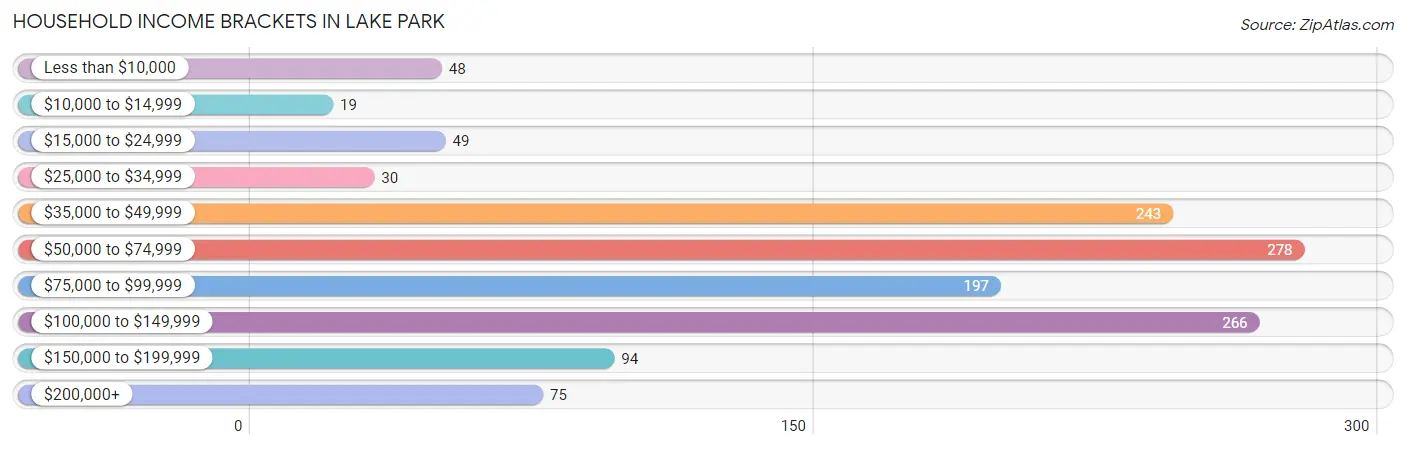
| Income Bracket | # Households | % Households |
| Less than $10,000 | 48 | 3.7% |
| $10,000 to $14,999 | 19 | 1.5% |
| $15,000 to $24,999 | 49 | 3.8% |
| $25,000 to $34,999 | 30 | 2.3% |
| $35,000 to $49,999 | 243 | 18.7% |
| $50,000 to $74,999 | 278 | 21.4% |
| $75,000 to $99,999 | 197 | 15.2% |
| $100,000 to $149,999 | 266 | 20.5% |
| $150,000 to $199,999 | 94 | 7.2% |
| $200,000+ | 75 | 5.8% |
Household Income by Householder Age in Lake Park
The median household income in Lake Park is $73,972, with the highest median household income of $89,250 found in the 45 to 64 years age bracket for the primary householder. A total of 528 households (40.6%) fall into this category. Meanwhile, the 15 to 24 years age bracket for the primary householder has the lowest median household income of $0, with 11 households (0.9%) in this group.
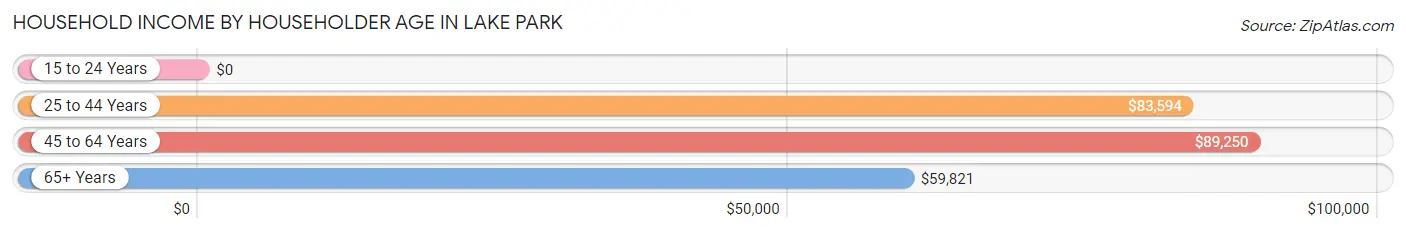
| Income Bracket | # Households | Median Income |
| 15 to 24 Years | 11 (0.9%) | $0 |
| 25 to 44 Years | 377 (29.0%) | $83,594 |
| 45 to 64 Years | 528 (40.6%) | $89,250 |
| 65+ Years | 383 (29.5%) | $59,821 |
| Total | 1,299 (100.0%) | $73,972 |
Poverty in Lake Park
Income Below Poverty by Sex and Age in Lake Park
With 7.1% poverty level for males and 1.4% for females among the residents of Lake Park, 15 year old males and 75 year old and over females are the most vulnerable to poverty, with 20 males (80.0%) and 25 females (22.7%) in their respective age groups living below the poverty level.
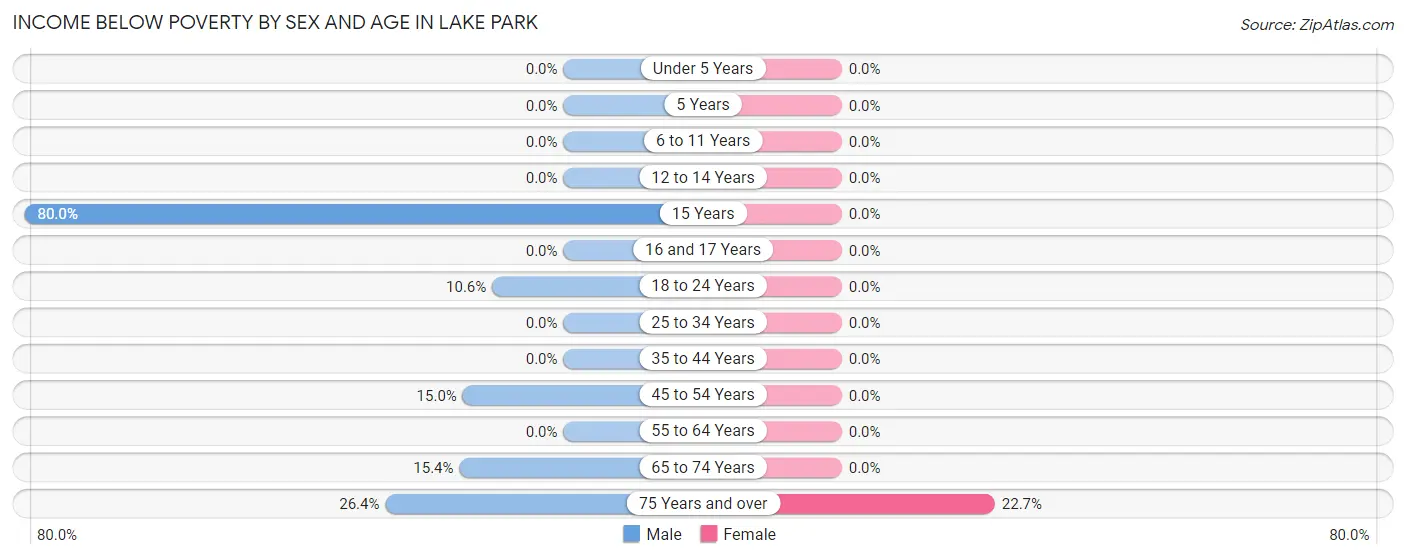
| Age Bracket | Male | Female |
| Under 5 Years | 0 (0.0%) | 0 (0.0%) |
| 5 Years | 0 (0.0%) | 0 (0.0%) |
| 6 to 11 Years | 0 (0.0%) | 0 (0.0%) |
| 12 to 14 Years | 0 (0.0%) | 0 (0.0%) |
| 15 Years | 20 (80.0%) | 0 (0.0%) |
| 16 and 17 Years | 0 (0.0%) | 0 (0.0%) |
| 18 to 24 Years | 11 (10.6%) | 0 (0.0%) |
| 25 to 34 Years | 0 (0.0%) | 0 (0.0%) |
| 35 to 44 Years | 0 (0.0%) | 0 (0.0%) |
| 45 to 54 Years | 29 (14.9%) | 0 (0.0%) |
| 55 to 64 Years | 0 (0.0%) | 0 (0.0%) |
| 65 to 74 Years | 21 (15.4%) | 0 (0.0%) |
| 75 Years and over | 23 (26.4%) | 25 (22.7%) |
| Total | 104 (7.1%) | 25 (1.4%) |
Income Above Poverty by Sex and Age in Lake Park
According to the poverty statistics in Lake Park, males aged under 5 years and females aged under 5 years are the age groups that are most secure financially, with 100.0% of males and 100.0% of females in these age groups living above the poverty line.
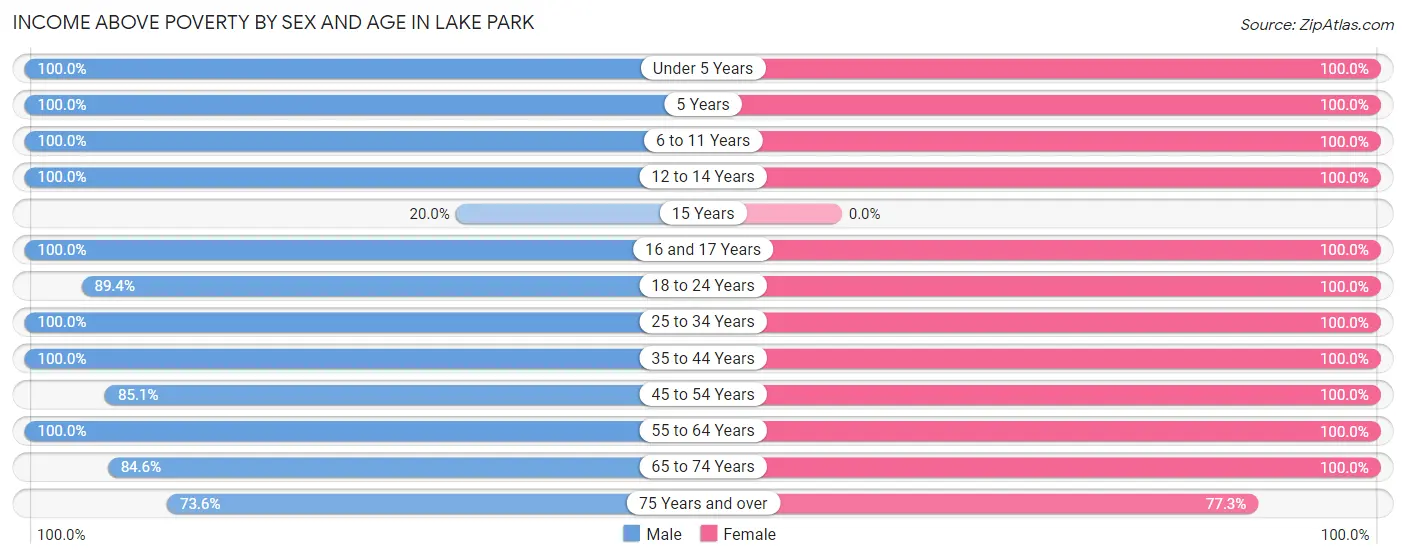
| Age Bracket | Male | Female |
| Under 5 Years | 138 (100.0%) | 54 (100.0%) |
| 5 Years | 17 (100.0%) | 22 (100.0%) |
| 6 to 11 Years | 113 (100.0%) | 145 (100.0%) |
| 12 to 14 Years | 52 (100.0%) | 122 (100.0%) |
| 15 Years | 5 (20.0%) | 0 (0.0%) |
| 16 and 17 Years | 38 (100.0%) | 33 (100.0%) |
| 18 to 24 Years | 93 (89.4%) | 96 (100.0%) |
| 25 to 34 Years | 175 (100.0%) | 274 (100.0%) |
| 35 to 44 Years | 203 (100.0%) | 242 (100.0%) |
| 45 to 54 Years | 165 (85.1%) | 236 (100.0%) |
| 55 to 64 Years | 184 (100.0%) | 207 (100.0%) |
| 65 to 74 Years | 115 (84.6%) | 241 (100.0%) |
| 75 Years and over | 64 (73.6%) | 85 (77.3%) |
| Total | 1,362 (92.9%) | 1,757 (98.6%) |
Income Below Poverty Among Married-Couple Families in Lake Park
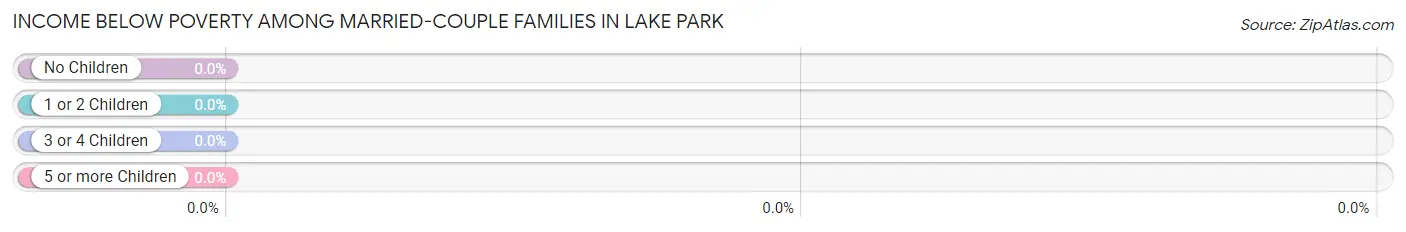
| Children | Above Poverty | Below Poverty |
| No Children | 366 (100.0%) | 0 (0.0%) |
| 1 or 2 Children | 285 (100.0%) | 0 (0.0%) |
| 3 or 4 Children | 15 (100.0%) | 0 (0.0%) |
| 5 or more Children | 6 (100.0%) | 0 (0.0%) |
| Total | 672 (100.0%) | 0 (0.0%) |
Income Below Poverty Among Single-Parent Households in Lake Park
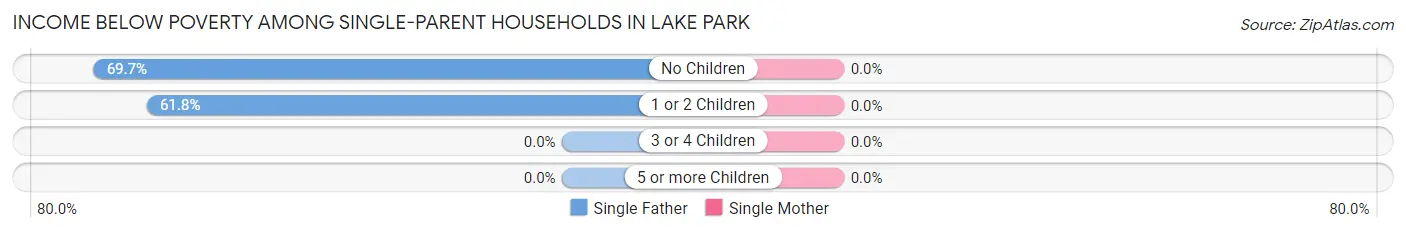
| Children | Single Father | Single Mother |
| No Children | 23 (69.7%) | 0 (0.0%) |
| 1 or 2 Children | 21 (61.8%) | 0 (0.0%) |
| 3 or 4 Children | 0 (0.0%) | 0 (0.0%) |
| 5 or more Children | 0 (0.0%) | 0 (0.0%) |
| Total | 44 (65.7%) | 0 (0.0%) |
Income Below Poverty Among Married-Couple vs Single-Parent Households in Lake Park
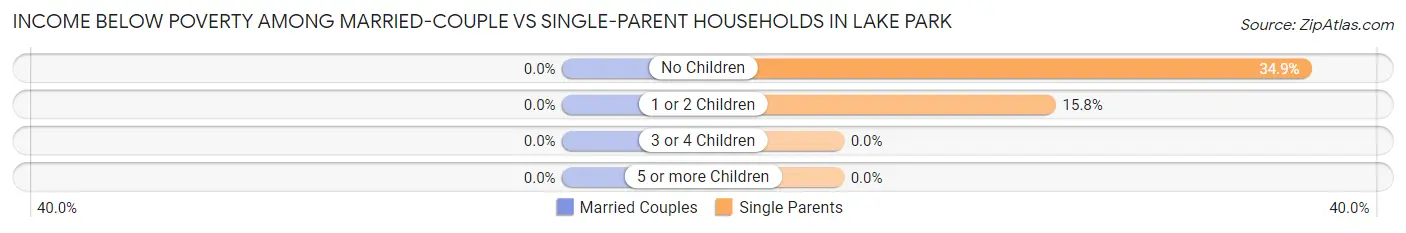
| Children | Married-Couple Families | Single-Parent Households |
| No Children | 0 (0.0%) | 23 (34.8%) |
| 1 or 2 Children | 0 (0.0%) | 21 (15.8%) |
| 3 or 4 Children | 0 (0.0%) | 0 (0.0%) |
| 5 or more Children | 0 (0.0%) | 0 (0.0%) |
| Total | 0 (0.0%) | 44 (21.6%) |
Race in Lake Park
The most populous races in Lake Park are White / Caucasian (2,717 | 81.3%), Hispanic or Latino (280 | 8.4%), and Black / African American (254 | 7.6%).
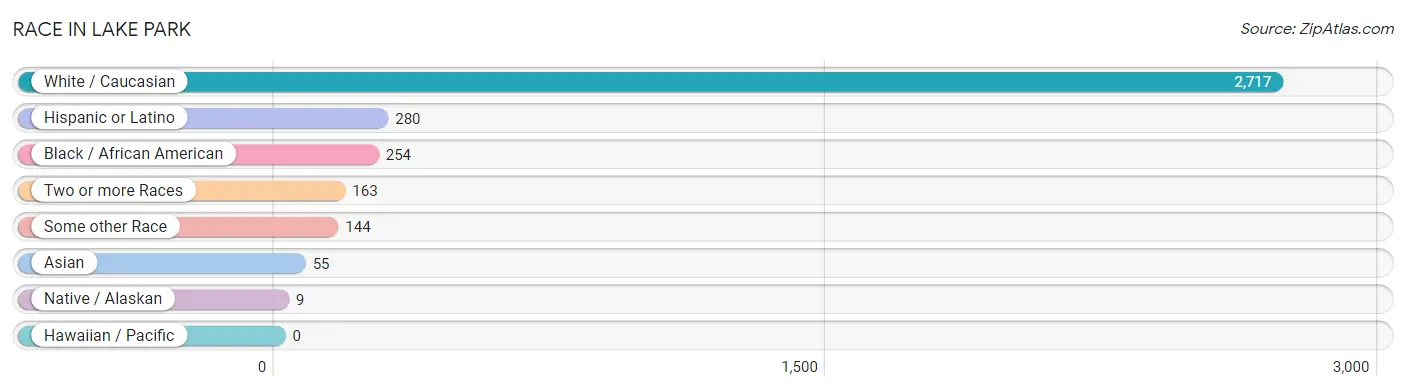
| Race | # Population | % Population |
| Asian | 55 | 1.7% |
| Black / African American | 254 | 7.6% |
| Hawaiian / Pacific | 0 | 0.0% |
| Hispanic or Latino | 280 | 8.4% |
| Native / Alaskan | 9 | 0.3% |
| White / Caucasian | 2,717 | 81.3% |
| Two or more Races | 163 | 4.9% |
| Some other Race | 144 | 4.3% |
| Total | 3,342 | 100.0% |
Ancestry in Lake Park
The most populous ancestries reported in Lake Park are English (506 | 15.1%), German (403 | 12.1%), Irish (280 | 8.4%), South American (236 | 7.1%), and American (179 | 5.4%), together accounting for 48.0% of all Lake Park residents.
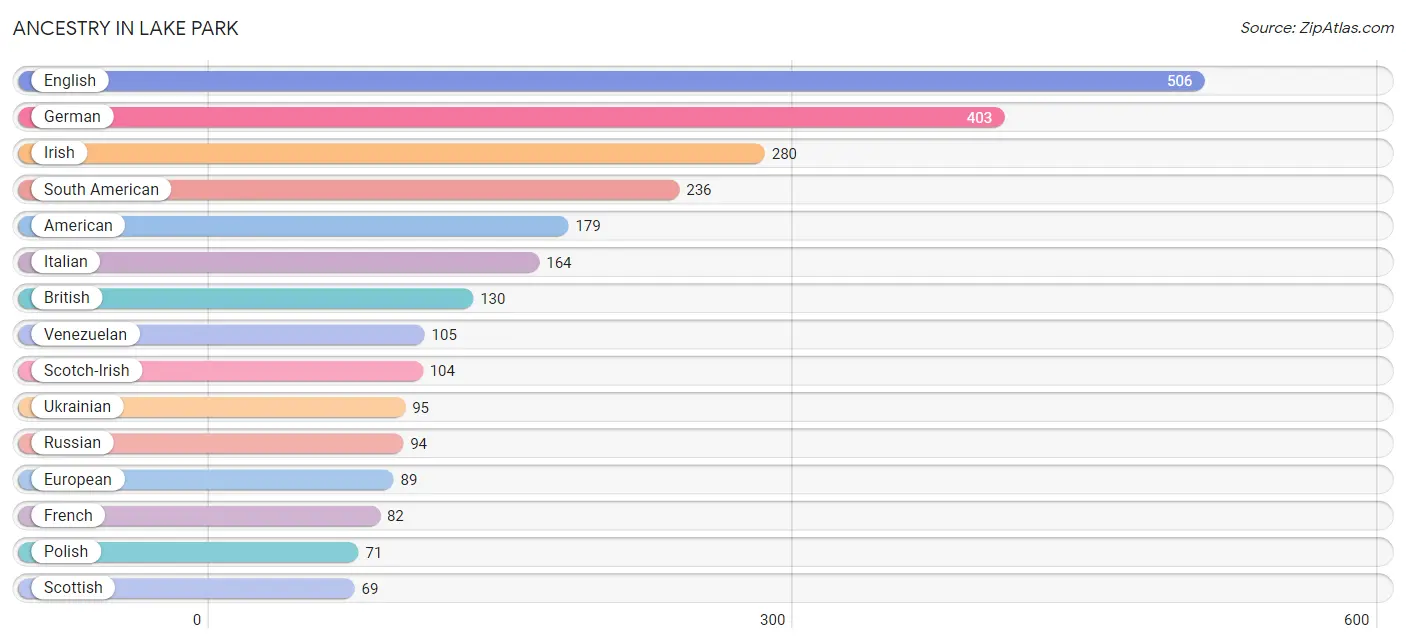
| Ancestry | # Population | % Population |
| African | 10 | 0.3% |
| American | 179 | 5.4% |
| Austrian | 18 | 0.5% |
| Brazilian | 6 | 0.2% |
| British | 130 | 3.9% |
| Canadian | 13 | 0.4% |
| Colombian | 24 | 0.7% |
| Croatian | 4 | 0.1% |
| Czechoslovakian | 9 | 0.3% |
| Dutch | 36 | 1.1% |
| Eastern European | 33 | 1.0% |
| Ecuadorian | 52 | 1.6% |
| English | 506 | 15.1% |
| European | 89 | 2.7% |
| Finnish | 15 | 0.4% |
| French | 82 | 2.5% |
| French Canadian | 39 | 1.2% |
| German | 403 | 12.1% |
| Greek | 18 | 0.5% |
| Hungarian | 31 | 0.9% |
| Indian (Asian) | 20 | 0.6% |
| Iranian | 15 | 0.4% |
| Irish | 280 | 8.4% |
| Iroquois | 2 | 0.1% |
| Italian | 164 | 4.9% |
| Korean | 43 | 1.3% |
| Mexican | 21 | 0.6% |
| Norwegian | 13 | 0.4% |
| Peruvian | 55 | 1.7% |
| Polish | 71 | 2.1% |
| Portuguese | 6 | 0.2% |
| Puerto Rican | 17 | 0.5% |
| Russian | 94 | 2.8% |
| Scandinavian | 63 | 1.9% |
| Scotch-Irish | 104 | 3.1% |
| Scottish | 69 | 2.1% |
| South American | 236 | 7.1% |
| Spaniard | 6 | 0.2% |
| Sri Lankan | 26 | 0.8% |
| Subsaharan African | 10 | 0.3% |
| Swedish | 19 | 0.6% |
| Swiss | 5 | 0.2% |
| Turkish | 6 | 0.2% |
| Ukrainian | 95 | 2.8% |
| Venezuelan | 105 | 3.1% |
| Welsh | 40 | 1.2% | View All 46 Rows |
Immigrants in Lake Park
The most numerous immigrant groups reported in Lake Park came from Latin America (171 | 5.1%), South America (165 | 4.9%), Europe (129 | 3.9%), Eastern Europe (91 | 2.7%), and Venezuela (69 | 2.1%), together accounting for 18.7% of all Lake Park residents.
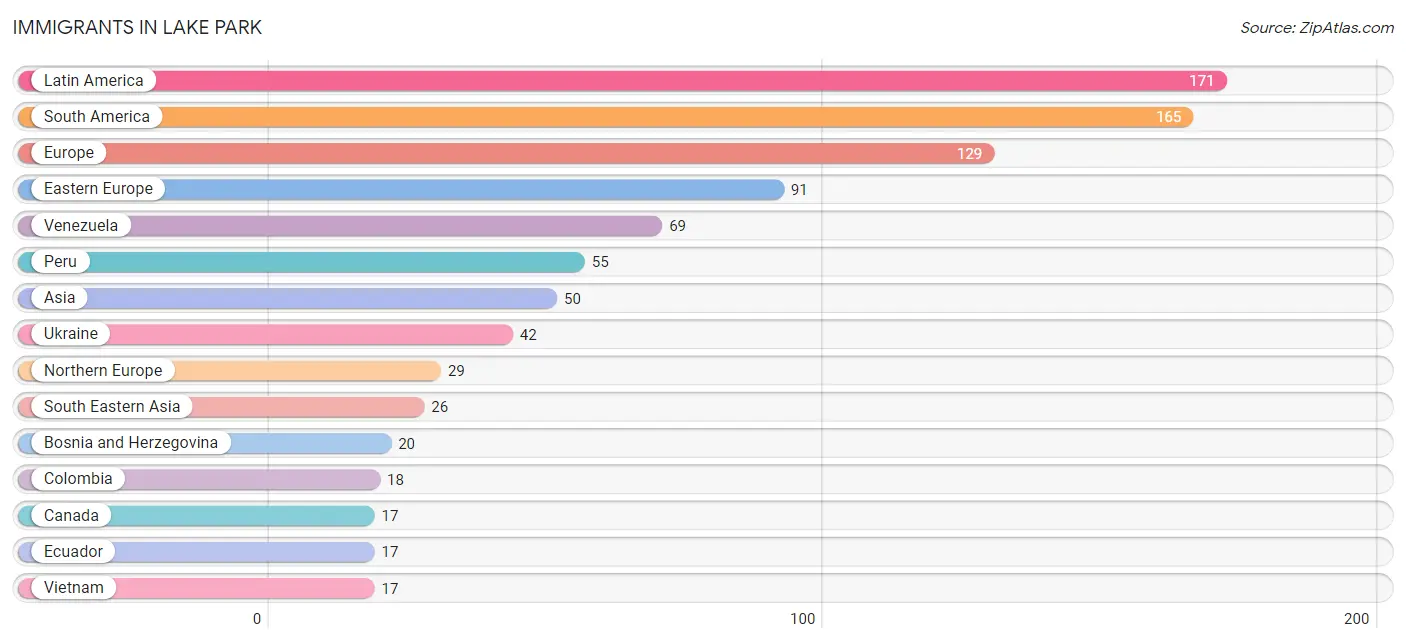
| Immigration Origin | # Population | % Population |
| Asia | 50 | 1.5% |
| Bosnia and Herzegovina | 20 | 0.6% |
| Brazil | 6 | 0.2% |
| Canada | 17 | 0.5% |
| Caribbean | 6 | 0.2% |
| China | 15 | 0.4% |
| Colombia | 18 | 0.5% |
| Eastern Asia | 15 | 0.4% |
| Eastern Europe | 91 | 2.7% |
| Ecuador | 17 | 0.5% |
| Europe | 129 | 3.9% |
| Iran | 9 | 0.3% |
| Italy | 9 | 0.3% |
| Latin America | 171 | 5.1% |
| Northern Europe | 29 | 0.9% |
| Peru | 55 | 1.7% |
| Philippines | 9 | 0.3% |
| South America | 165 | 4.9% |
| South Central Asia | 9 | 0.3% |
| South Eastern Asia | 26 | 0.8% |
| Southern Europe | 9 | 0.3% |
| Trinidad and Tobago | 6 | 0.2% |
| Ukraine | 42 | 1.3% |
| Venezuela | 69 | 2.1% |
| Vietnam | 17 | 0.5% | View All 25 Rows |
Sex and Age in Lake Park
Sex and Age in Lake Park
The most populous age groups in Lake Park are 30 to 34 Years (139 | 9.3%) for men and 10 to 14 Years (178 | 9.6%) for women.
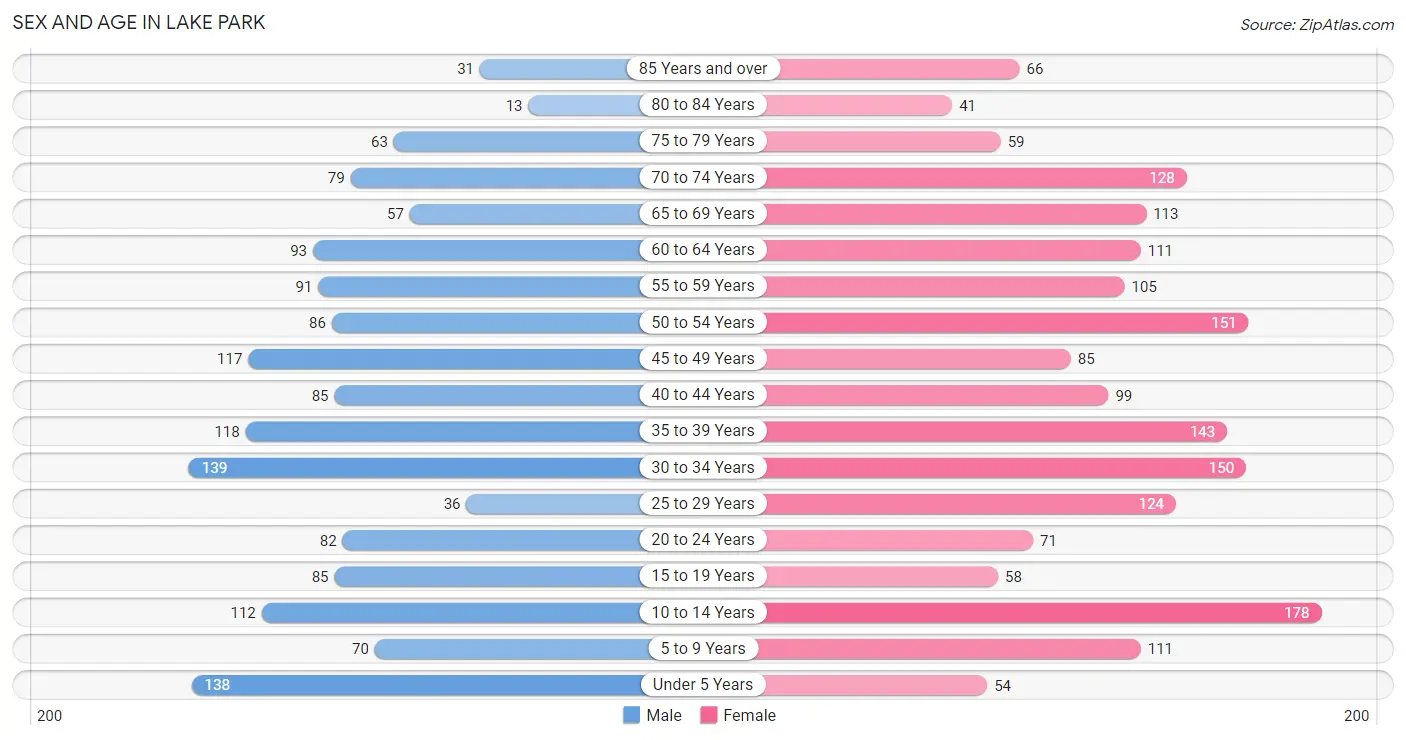
| Age Bracket | Male | Female |
| Under 5 Years | 138 (9.2%) | 54 (2.9%) |
| 5 to 9 Years | 70 (4.7%) | 111 (6.0%) |
| 10 to 14 Years | 112 (7.5%) | 178 (9.6%) |
| 15 to 19 Years | 85 (5.7%) | 58 (3.1%) |
| 20 to 24 Years | 82 (5.5%) | 71 (3.8%) |
| 25 to 29 Years | 36 (2.4%) | 124 (6.7%) |
| 30 to 34 Years | 139 (9.3%) | 150 (8.1%) |
| 35 to 39 Years | 118 (7.9%) | 143 (7.7%) |
| 40 to 44 Years | 85 (5.7%) | 99 (5.4%) |
| 45 to 49 Years | 117 (7.8%) | 85 (4.6%) |
| 50 to 54 Years | 86 (5.8%) | 151 (8.2%) |
| 55 to 59 Years | 91 (6.1%) | 105 (5.7%) |
| 60 to 64 Years | 93 (6.2%) | 111 (6.0%) |
| 65 to 69 Years | 57 (3.8%) | 113 (6.1%) |
| 70 to 74 Years | 79 (5.3%) | 128 (6.9%) |
| 75 to 79 Years | 63 (4.2%) | 59 (3.2%) |
| 80 to 84 Years | 13 (0.9%) | 41 (2.2%) |
| 85 Years and over | 31 (2.1%) | 66 (3.6%) |
| Total | 1,495 (100.0%) | 1,847 (100.0%) |
Families and Households in Lake Park
Median Family Size in Lake Park
The median family size in Lake Park is 3.18 persons per family, with single female/mother families (137 | 15.6%) accounting for the largest median family size of 3.39 persons per family. On the other hand, single male/father families (67 | 7.6%) represent the smallest median family size with 2.13 persons per family.
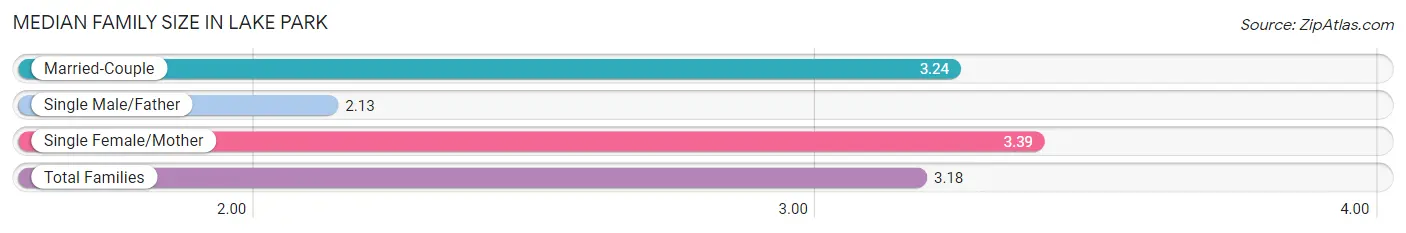
| Family Type | # Families | Family Size |
| Married-Couple | 672 (76.7%) | 3.24 |
| Single Male/Father | 67 (7.6%) | 2.13 |
| Single Female/Mother | 137 (15.6%) | 3.39 |
| Total Families | 876 (100.0%) | 3.18 |
Median Household Size in Lake Park
The median household size in Lake Park is 2.50 persons per household, with single female/mother households (137 | 10.5%) accounting for the largest median household size of 3.39 persons per household. non-family households (423 | 32.6%) represent the smallest median household size with 1.09 persons per household.
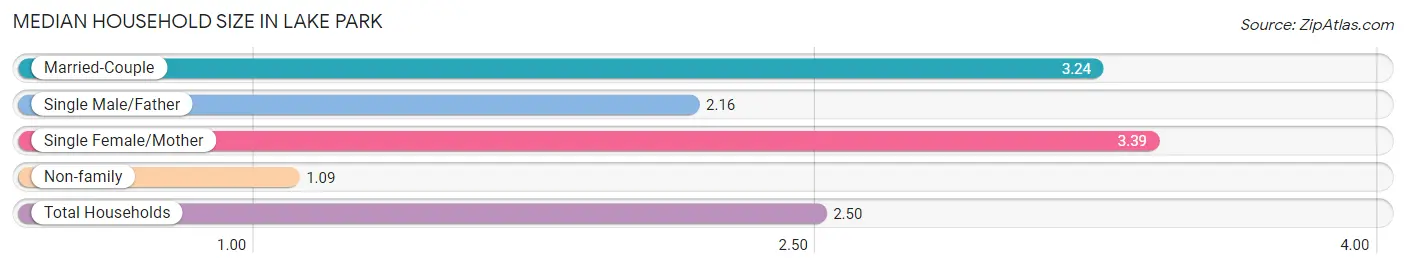
| Household Type | # Households | Household Size |
| Married-Couple | 672 (51.7%) | 3.24 |
| Single Male/Father | 67 (5.2%) | 2.16 |
| Single Female/Mother | 137 (10.5%) | 3.39 |
| Non-family | 423 (32.6%) | 1.09 |
| Total Households | 1,299 (100.0%) | 2.50 |
Household Size by Marriage Status in Lake Park
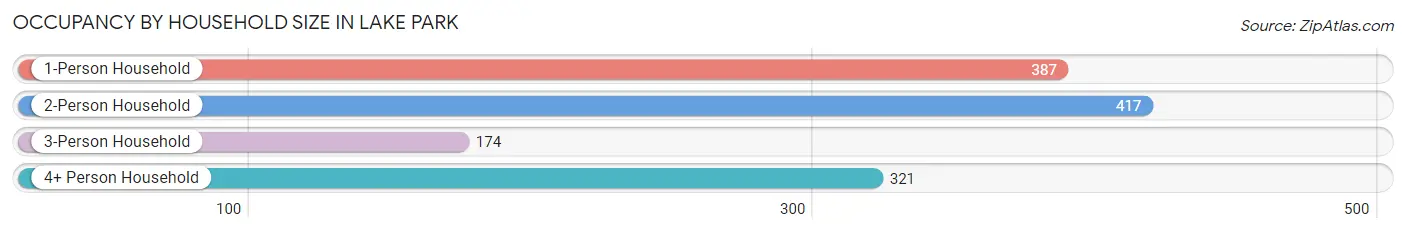
Out of a total of 1,299 households in Lake Park, 876 (67.4%) are family households, while 423 (32.6%) are nonfamily households. The most numerous type of family households are 2-person households, comprising 381, and the most common type of nonfamily households are 1-person households, comprising 387.
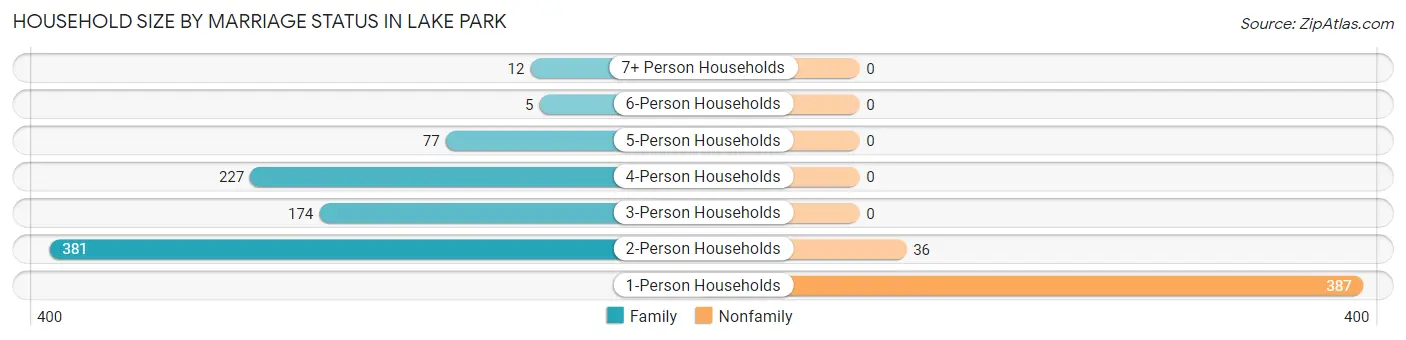
| Household Size | Family Households | Nonfamily Households |
| 1-Person Households | - | 387 (29.8%) |
| 2-Person Households | 381 (29.3%) | 36 (2.8%) |
| 3-Person Households | 174 (13.4%) | 0 (0.0%) |
| 4-Person Households | 227 (17.5%) | 0 (0.0%) |
| 5-Person Households | 77 (5.9%) | 0 (0.0%) |
| 6-Person Households | 5 (0.4%) | 0 (0.0%) |
| 7+ Person Households | 12 (0.9%) | 0 (0.0%) |
| Total | 876 (67.4%) | 423 (32.6%) |
Female Fertility in Lake Park
Fertility by Age in Lake Park
Average fertility rate in Lake Park is 49.0 births per 1,000 women. Women in the age bracket of 20 to 34 years have the highest fertility rate with 113.0 births per 1,000 women. Women in the age bracket of 20 to 34 years acount for 100.0% of all women with births.
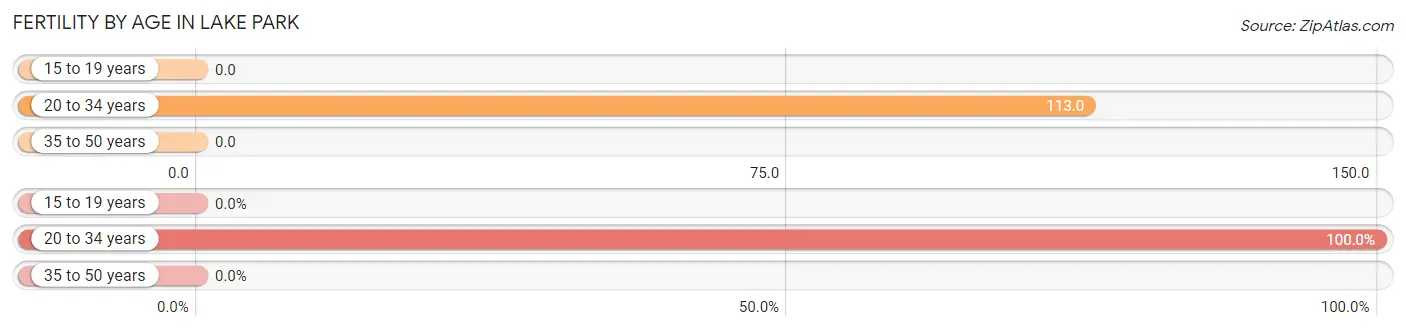
| Age Bracket | Women with Births | Births / 1,000 Women |
| 15 to 19 years | 0 (0.0%) | 0.0 |
| 20 to 34 years | 39 (100.0%) | 113.0 |
| 35 to 50 years | 0 (0.0%) | 0.0 |
| Total | 39 (100.0%) | 49.0 |
Fertility by Age by Marriage Status in Lake Park
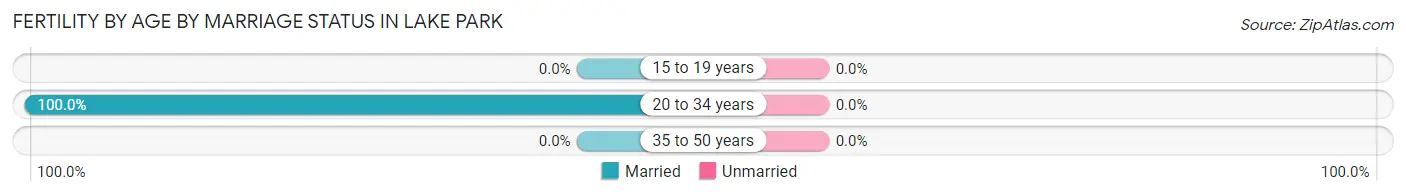
| Age Bracket | Married | Unmarried |
| 15 to 19 years | 0 (0.0%) | 0 (0.0%) |
| 20 to 34 years | 39 (100.0%) | 0 (0.0%) |
| 35 to 50 years | 0 (0.0%) | 0 (0.0%) |
| Total | 39 (100.0%) | 0 (0.0%) |
Fertility by Education in Lake Park
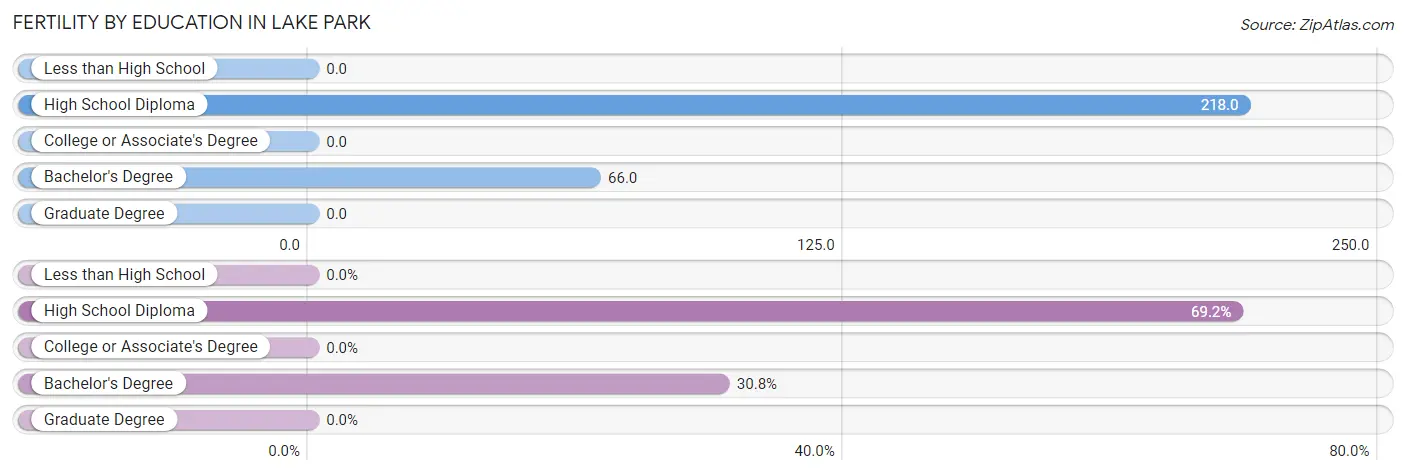
| Educational Attainment | Women with Births | Births / 1,000 Women |
| Less than High School | 0 (0.0%) | 0.0 |
| High School Diploma | 27 (69.2%) | 218.0 |
| College or Associate's Degree | 0 (0.0%) | 0.0 |
| Bachelor's Degree | 12 (30.8%) | 66.0 |
| Graduate Degree | 0 (0.0%) | 0.0 |
| Total | 39 (100.0%) | 49.0 |
Fertility by Education by Marriage Status in Lake Park
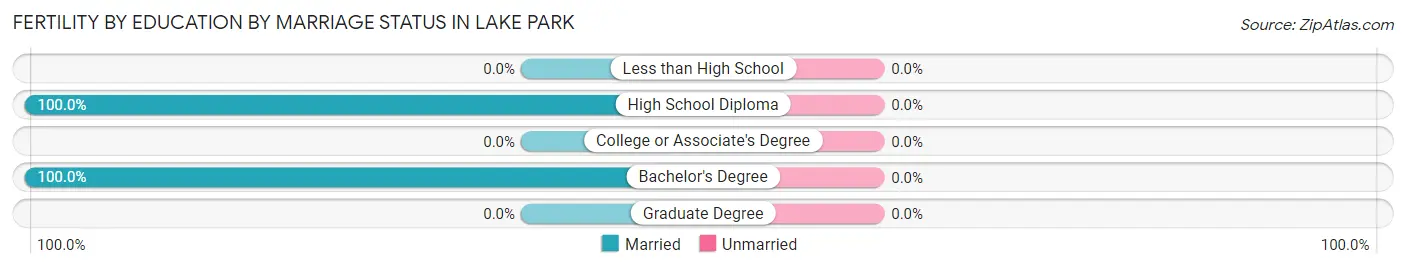
| Educational Attainment | Married | Unmarried |
| Less than High School | 0 (0.0%) | 0 (0.0%) |
| High School Diploma | 27 (100.0%) | 0 (0.0%) |
| College or Associate's Degree | 0 (0.0%) | 0 (0.0%) |
| Bachelor's Degree | 12 (100.0%) | 0 (0.0%) |
| Graduate Degree | 0 (0.0%) | 0 (0.0%) |
| Total | 39 (100.0%) | 0 (0.0%) |
Employment Characteristics in Lake Park
Employment by Class of Employer in Lake Park
Among the 1,711 employed individuals in Lake Park, private company employees (1,266 | 74.0%), not-for-profit organizations (164 | 9.6%), and self-employed (not incorporated) (100 | 5.8%) make up the most common classes of employment.
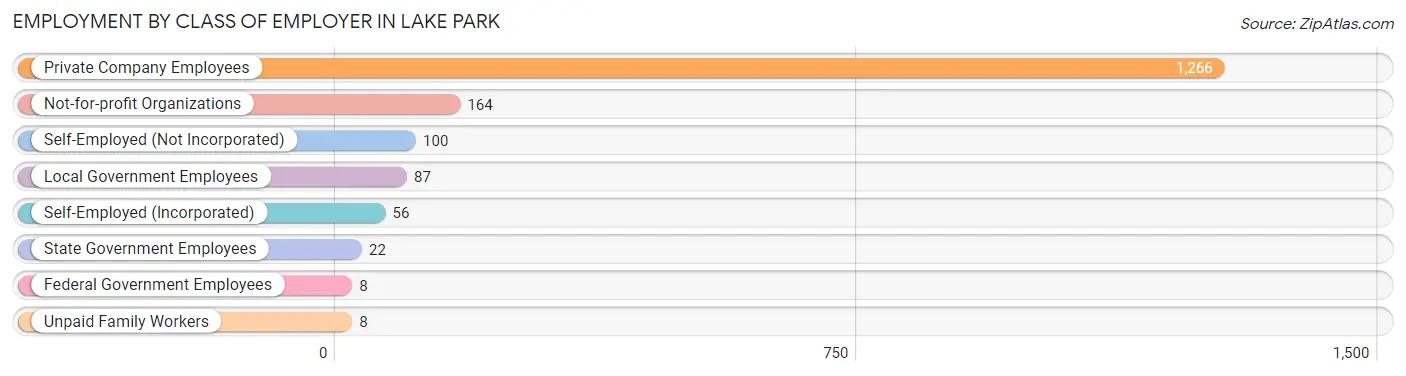
| Employer Class | # Employees | % Employees |
| Private Company Employees | 1,266 | 74.0% |
| Self-Employed (Incorporated) | 56 | 3.3% |
| Self-Employed (Not Incorporated) | 100 | 5.8% |
| Not-for-profit Organizations | 164 | 9.6% |
| Local Government Employees | 87 | 5.1% |
| State Government Employees | 22 | 1.3% |
| Federal Government Employees | 8 | 0.5% |
| Unpaid Family Workers | 8 | 0.5% |
| Total | 1,711 | 100.0% |
Employment Status by Age in Lake Park
According to the labor force statistics for Lake Park, out of the total population over 16 years of age (2,654), 68.5% or 1,818 individuals are in the labor force, with 3.6% or 65 of them unemployed. The age group with the highest labor force participation rate is 25 to 29 years, with 95.6% or 153 individuals in the labor force. Within the labor force, the 20 to 24 years age range has the highest percentage of unemployed individuals, with 24.8% or 35 of them being unemployed.
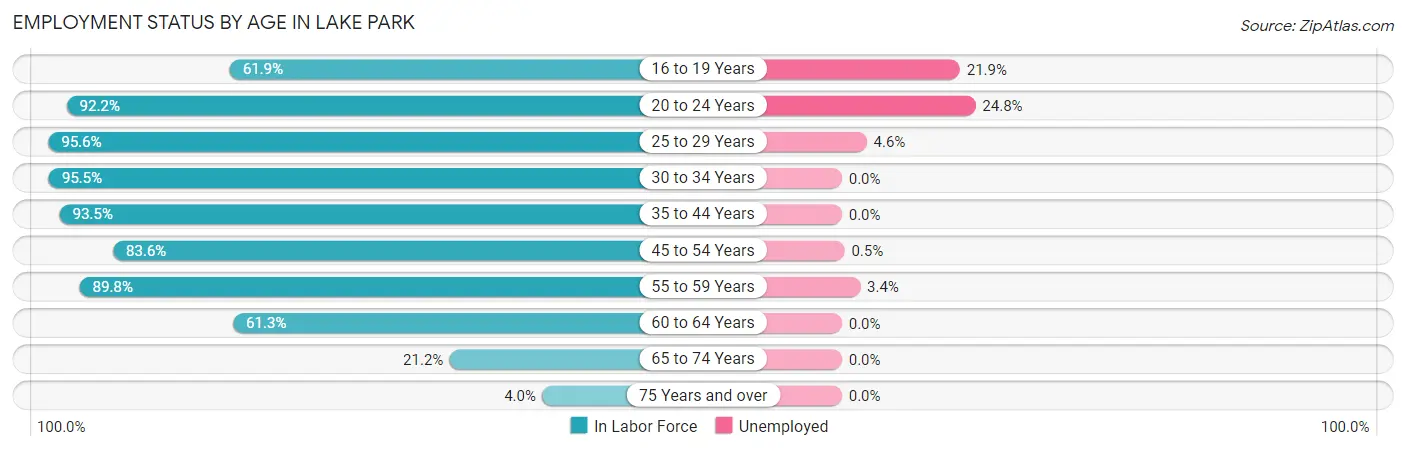
| Age Bracket | In Labor Force | Unemployed |
| 16 to 19 Years | 73 (61.9%) | 16 (21.9%) |
| 20 to 24 Years | 141 (92.2%) | 35 (24.8%) |
| 25 to 29 Years | 153 (95.6%) | 7 (4.6%) |
| 30 to 34 Years | 276 (95.5%) | 0 (0.0%) |
| 35 to 44 Years | 416 (93.5%) | 0 (0.0%) |
| 45 to 54 Years | 367 (83.6%) | 2 (0.5%) |
| 55 to 59 Years | 176 (89.8%) | 6 (3.4%) |
| 60 to 64 Years | 125 (61.3%) | 0 (0.0%) |
| 65 to 74 Years | 80 (21.2%) | 0 (0.0%) |
| 75 Years and over | 11 (4.0%) | 0 (0.0%) |
| Total | 1,818 (68.5%) | 65 (3.6%) |
Employment Status by Educational Attainment in Lake Park
According to labor force statistics for Lake Park, 87.3% of individuals (1,513) out of the total population between 25 and 64 years of age (1,733) are in the labor force, with 1.0% or 15 of them being unemployed. The group with the highest labor force participation rate are those with the educational attainment of less than high school, with 95.8% or 91 individuals in the labor force. Within the labor force, individuals with college / associate degree education have the highest percentage of unemployment, with 2.4% or 13 of them being unemployed.
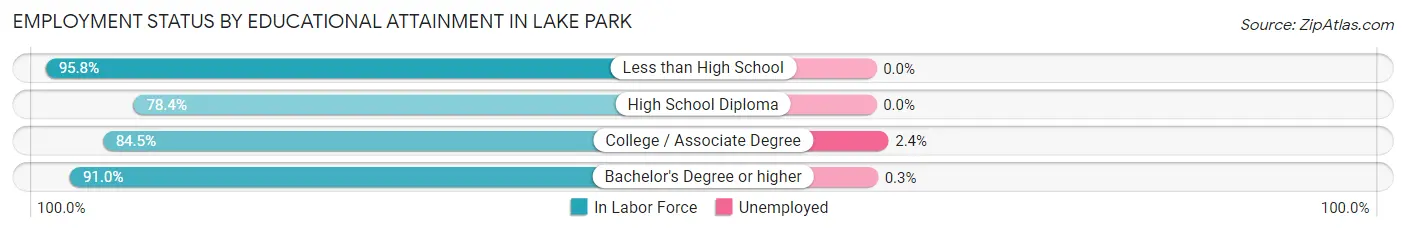
| Educational Attainment | In Labor Force | Unemployed |
| Less than High School | 91 (95.8%) | 0 (0.0%) |
| High School Diploma | 163 (78.4%) | 0 (0.0%) |
| College / Associate Degree | 552 (84.5%) | 16 (2.4%) |
| Bachelor's Degree or higher | 707 (91.0%) | 2 (0.3%) |
| Total | 1,513 (87.3%) | 17 (1.0%) |
Employment Occupations by Sex in Lake Park
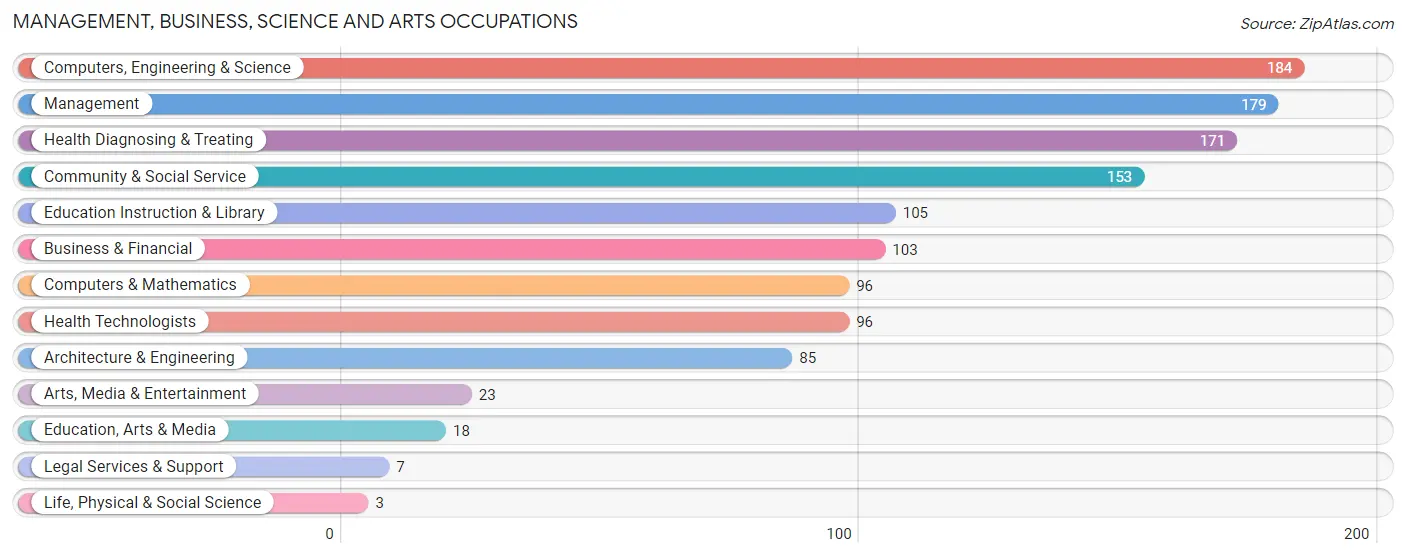
Management, Business, Science and Arts Occupations
The most common Management, Business, Science and Arts occupations in Lake Park are Computers, Engineering & Science (184 | 10.5%), Management (179 | 10.2%), Health Diagnosing & Treating (171 | 9.8%), Community & Social Service (153 | 8.7%), and Education Instruction & Library (105 | 6.0%).
Management, Business, Science and Arts Occupations by Sex
Within the Management, Business, Science and Arts occupations in Lake Park, the most male-oriented occupations are Computers & Mathematics (100.0%), Arts, Media & Entertainment (100.0%), and Computers, Engineering & Science (82.1%), while the most female-oriented occupations are Life, Physical & Social Science (100.0%), Legal Services & Support (100.0%), and Health Diagnosing & Treating (76.6%).
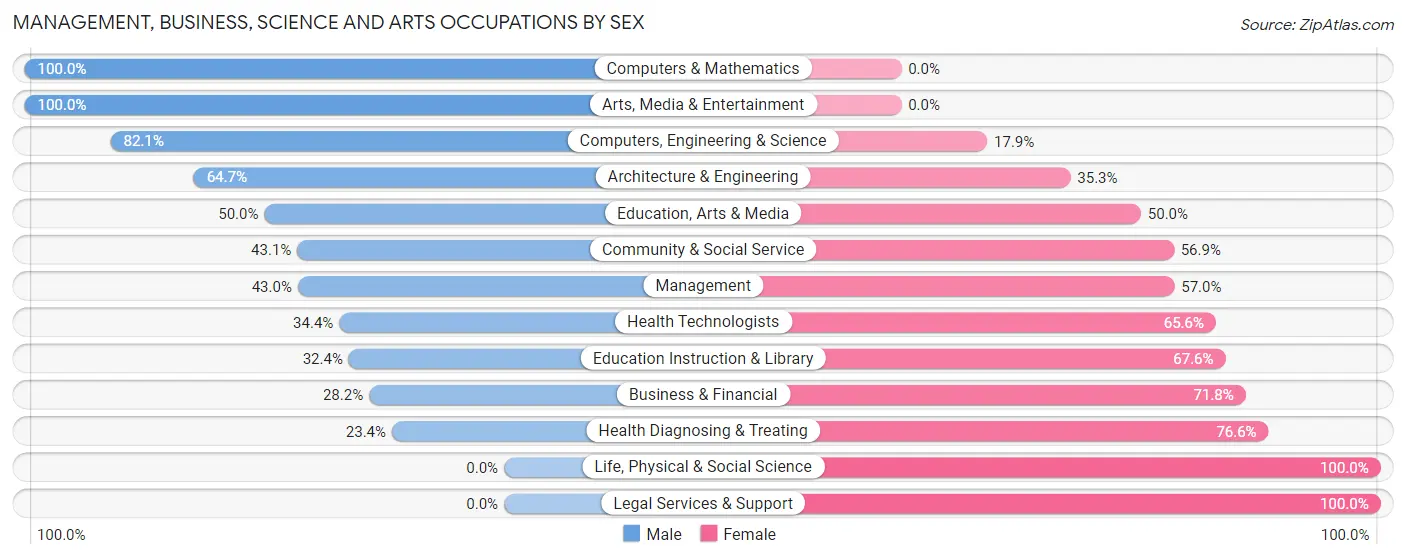
| Occupation | Male | Female |
| Management | 77 (43.0%) | 102 (57.0%) |
| Business & Financial | 29 (28.2%) | 74 (71.8%) |
| Computers, Engineering & Science | 151 (82.1%) | 33 (17.9%) |
| Computers & Mathematics | 96 (100.0%) | 0 (0.0%) |
| Architecture & Engineering | 55 (64.7%) | 30 (35.3%) |
| Life, Physical & Social Science | 0 (0.0%) | 3 (100.0%) |
| Community & Social Service | 66 (43.1%) | 87 (56.9%) |
| Education, Arts & Media | 9 (50.0%) | 9 (50.0%) |
| Legal Services & Support | 0 (0.0%) | 7 (100.0%) |
| Education Instruction & Library | 34 (32.4%) | 71 (67.6%) |
| Arts, Media & Entertainment | 23 (100.0%) | 0 (0.0%) |
| Health Diagnosing & Treating | 40 (23.4%) | 131 (76.6%) |
| Health Technologists | 33 (34.4%) | 63 (65.6%) |
| Total (Category) | 363 (46.0%) | 427 (54.0%) |
| Total (Overall) | 810 (46.2%) | 942 (53.8%) |
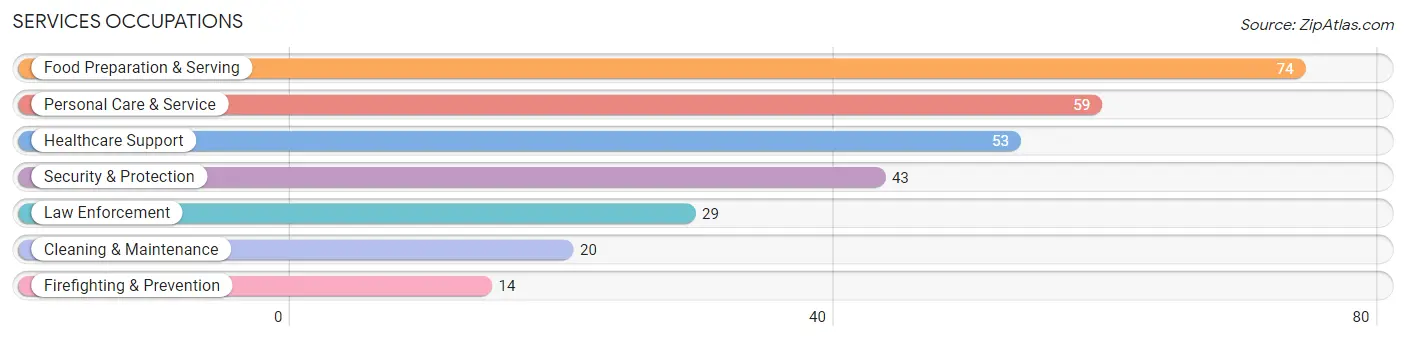
Services Occupations
The most common Services occupations in Lake Park are Food Preparation & Serving (74 | 4.2%), Personal Care & Service (59 | 3.4%), Healthcare Support (53 | 3.0%), Security & Protection (43 | 2.5%), and Law Enforcement (29 | 1.7%).
Services Occupations by Sex
Within the Services occupations in Lake Park, the most male-oriented occupations are Cleaning & Maintenance (100.0%), Law Enforcement (79.3%), and Security & Protection (76.7%), while the most female-oriented occupations are Healthcare Support (100.0%), Personal Care & Service (84.8%), and Food Preparation & Serving (79.7%).
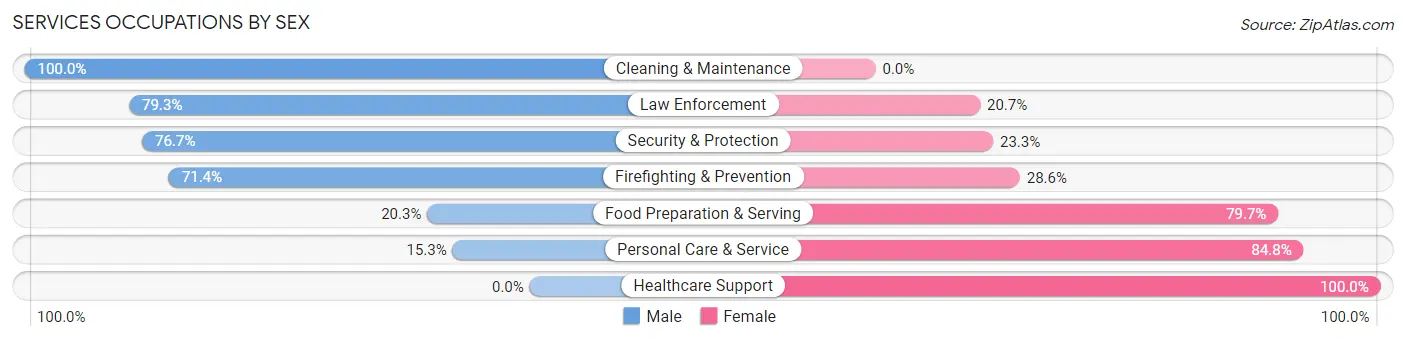
| Occupation | Male | Female |
| Healthcare Support | 0 (0.0%) | 53 (100.0%) |
| Security & Protection | 33 (76.7%) | 10 (23.3%) |
| Firefighting & Prevention | 10 (71.4%) | 4 (28.6%) |
| Law Enforcement | 23 (79.3%) | 6 (20.7%) |
| Food Preparation & Serving | 15 (20.3%) | 59 (79.7%) |
| Cleaning & Maintenance | 20 (100.0%) | 0 (0.0%) |
| Personal Care & Service | 9 (15.2%) | 50 (84.8%) |
| Total (Category) | 77 (30.9%) | 172 (69.1%) |
| Total (Overall) | 810 (46.2%) | 942 (53.8%) |
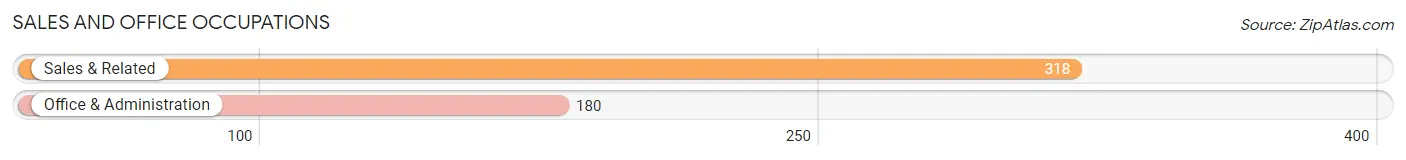
Sales and Office Occupations
The most common Sales and Office occupations in Lake Park are Sales & Related (318 | 18.1%), and Office & Administration (180 | 10.3%).
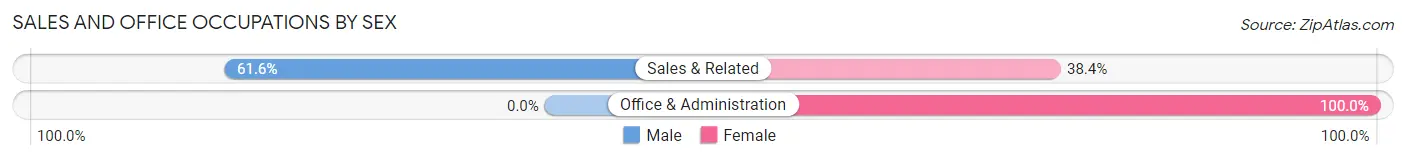
Sales and Office Occupations by Sex
| Occupation | Male | Female |
| Sales & Related | 196 (61.6%) | 122 (38.4%) |
| Office & Administration | 0 (0.0%) | 180 (100.0%) |
| Total (Category) | 196 (39.4%) | 302 (60.6%) |
| Total (Overall) | 810 (46.2%) | 942 (53.8%) |
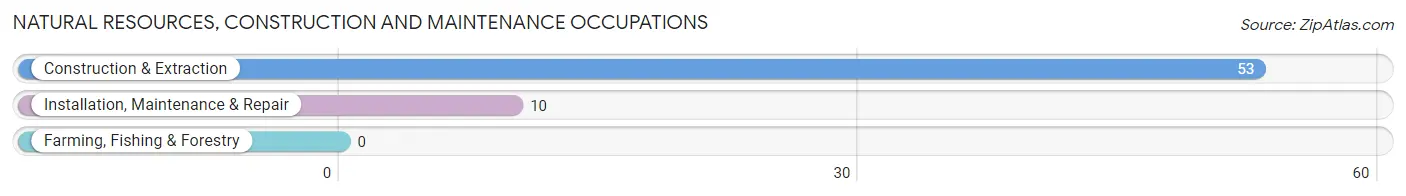
Natural Resources, Construction and Maintenance Occupations
The most common Natural Resources, Construction and Maintenance occupations in Lake Park are Construction & Extraction (53 | 3.0%), and Installation, Maintenance & Repair (10 | 0.6%).
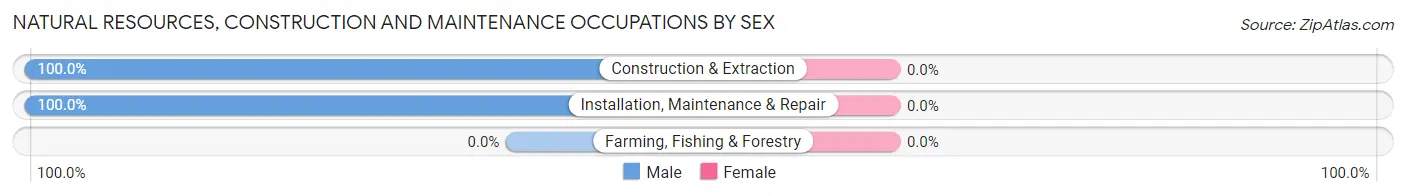
Natural Resources, Construction and Maintenance Occupations by Sex
| Occupation | Male | Female |
| Farming, Fishing & Forestry | 0 (0.0%) | 0 (0.0%) |
| Construction & Extraction | 53 (100.0%) | 0 (0.0%) |
| Installation, Maintenance & Repair | 10 (100.0%) | 0 (0.0%) |
| Total (Category) | 63 (100.0%) | 0 (0.0%) |
| Total (Overall) | 810 (46.2%) | 942 (53.8%) |
Production, Transportation and Moving Occupations
The most common Production, Transportation and Moving occupations in Lake Park are Production (77 | 4.4%), Material Moving (41 | 2.3%), and Transportation (34 | 1.9%).
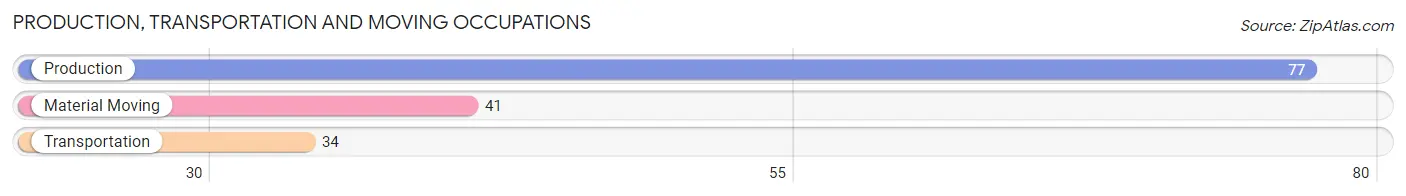
Production, Transportation and Moving Occupations by Sex
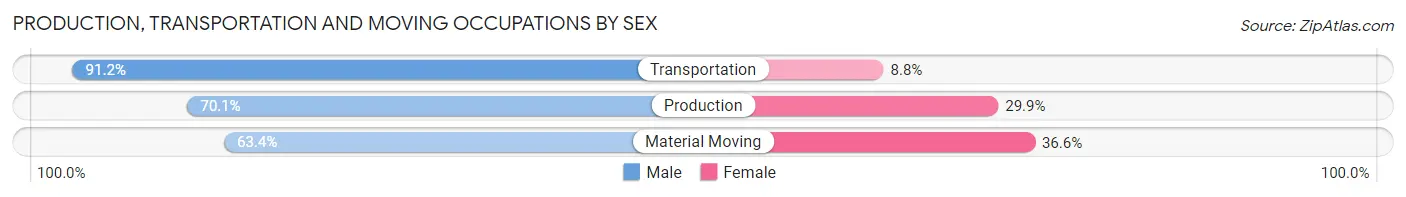
| Occupation | Male | Female |
| Production | 54 (70.1%) | 23 (29.9%) |
| Transportation | 31 (91.2%) | 3 (8.8%) |
| Material Moving | 26 (63.4%) | 15 (36.6%) |
| Total (Category) | 111 (73.0%) | 41 (27.0%) |
| Total (Overall) | 810 (46.2%) | 942 (53.8%) |
Employment Industries by Sex in Lake Park
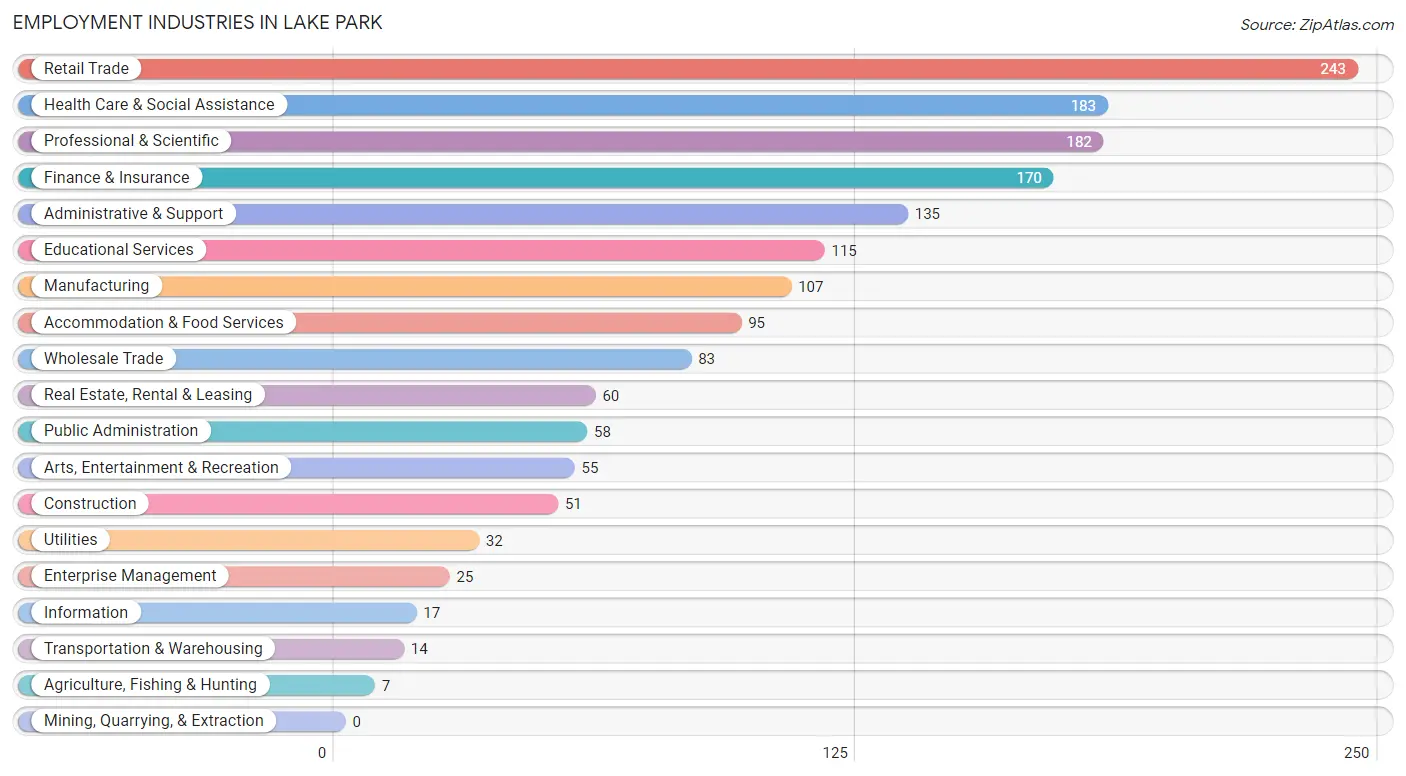
Employment Industries in Lake Park
The major employment industries in Lake Park include Retail Trade (243 | 13.9%), Health Care & Social Assistance (183 | 10.4%), Professional & Scientific (182 | 10.4%), Finance & Insurance (170 | 9.7%), and Administrative & Support (135 | 7.7%).
Employment Industries by Sex in Lake Park
The Lake Park industries that see more men than women are Agriculture, Fishing & Hunting (100.0%), Utilities (100.0%), and Information (100.0%), whereas the industries that tend to have a higher number of women are Accommodation & Food Services (84.2%), Educational Services (81.7%), and Health Care & Social Assistance (81.4%).
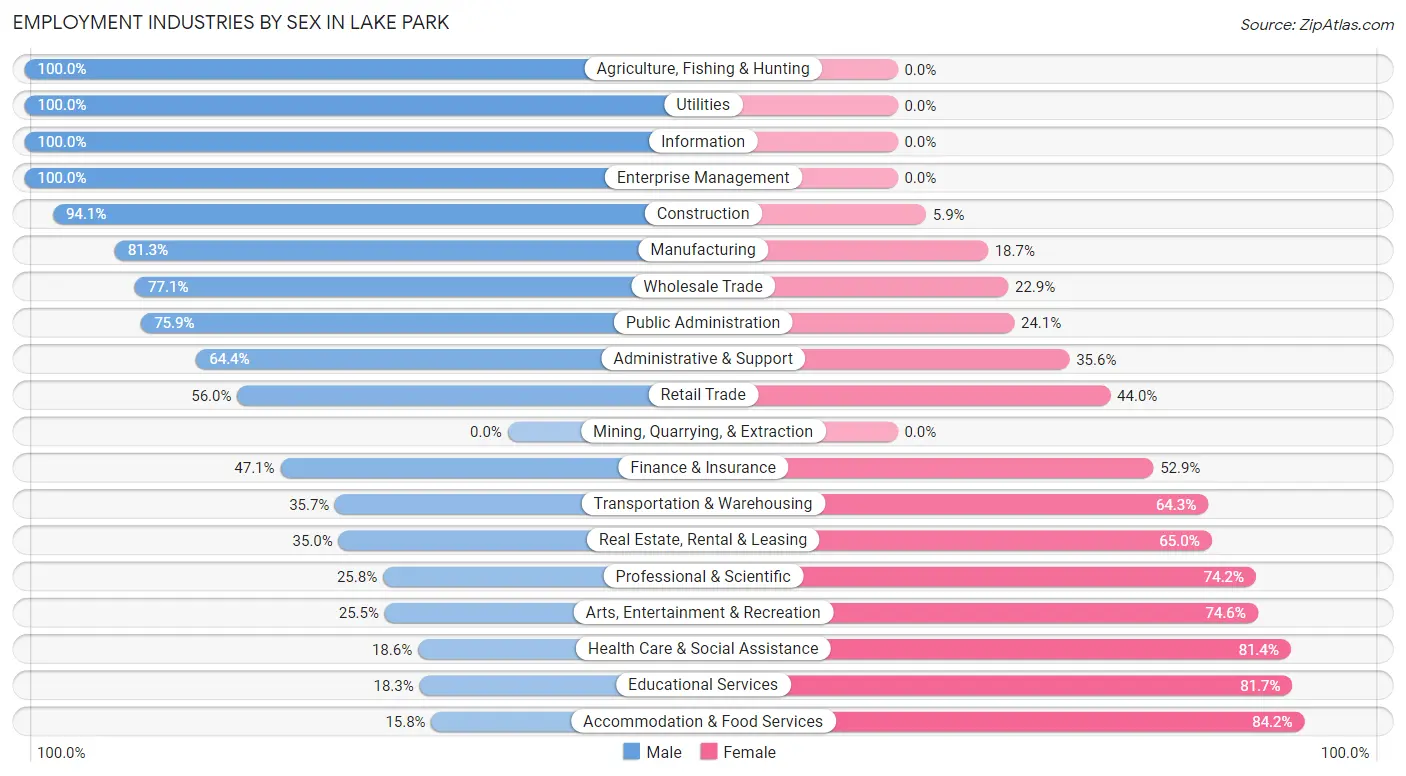
| Industry | Male | Female |
| Agriculture, Fishing & Hunting | 7 (100.0%) | 0 (0.0%) |
| Mining, Quarrying, & Extraction | 0 (0.0%) | 0 (0.0%) |
| Construction | 48 (94.1%) | 3 (5.9%) |
| Manufacturing | 87 (81.3%) | 20 (18.7%) |
| Wholesale Trade | 64 (77.1%) | 19 (22.9%) |
| Retail Trade | 136 (56.0%) | 107 (44.0%) |
| Transportation & Warehousing | 5 (35.7%) | 9 (64.3%) |
| Utilities | 32 (100.0%) | 0 (0.0%) |
| Information | 17 (100.0%) | 0 (0.0%) |
| Finance & Insurance | 80 (47.1%) | 90 (52.9%) |
| Real Estate, Rental & Leasing | 21 (35.0%) | 39 (65.0%) |
| Professional & Scientific | 47 (25.8%) | 135 (74.2%) |
| Enterprise Management | 25 (100.0%) | 0 (0.0%) |
| Administrative & Support | 87 (64.4%) | 48 (35.6%) |
| Educational Services | 21 (18.3%) | 94 (81.7%) |
| Health Care & Social Assistance | 34 (18.6%) | 149 (81.4%) |
| Arts, Entertainment & Recreation | 14 (25.5%) | 41 (74.6%) |
| Accommodation & Food Services | 15 (15.8%) | 80 (84.2%) |
| Public Administration | 44 (75.9%) | 14 (24.1%) |
| Total | 810 (46.2%) | 942 (53.8%) |
Education in Lake Park
School Enrollment in Lake Park
The most common levels of schooling among the 808 students in Lake Park are middle school (274 | 33.9%), elementary school (162 | 20.1%), and college / undergraduate (145 | 17.9%).
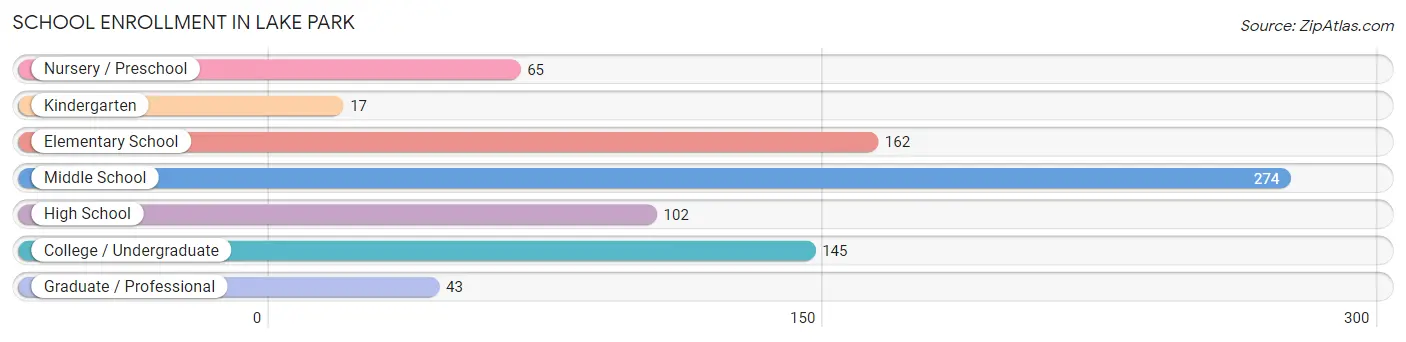
| School Level | # Students | % Students |
| Nursery / Preschool | 65 | 8.0% |
| Kindergarten | 17 | 2.1% |
| Elementary School | 162 | 20.1% |
| Middle School | 274 | 33.9% |
| High School | 102 | 12.6% |
| College / Undergraduate | 145 | 17.9% |
| Graduate / Professional | 43 | 5.3% |
| Total | 808 | 100.0% |
School Enrollment by Age by Funding Source in Lake Park
Out of a total of 808 students who are enrolled in schools in Lake Park, 272 (33.7%) attend a private institution, while the remaining 536 (66.3%) are enrolled in public schools. The age group of 35 years and over has the highest likelihood of being enrolled in private schools, with 39 (58.2% in the age bracket) enrolled. Conversely, the age group of 18 to 19 year olds has the lowest likelihood of being enrolled in a private school, with 30 (100.0% in the age bracket) attending a public institution.
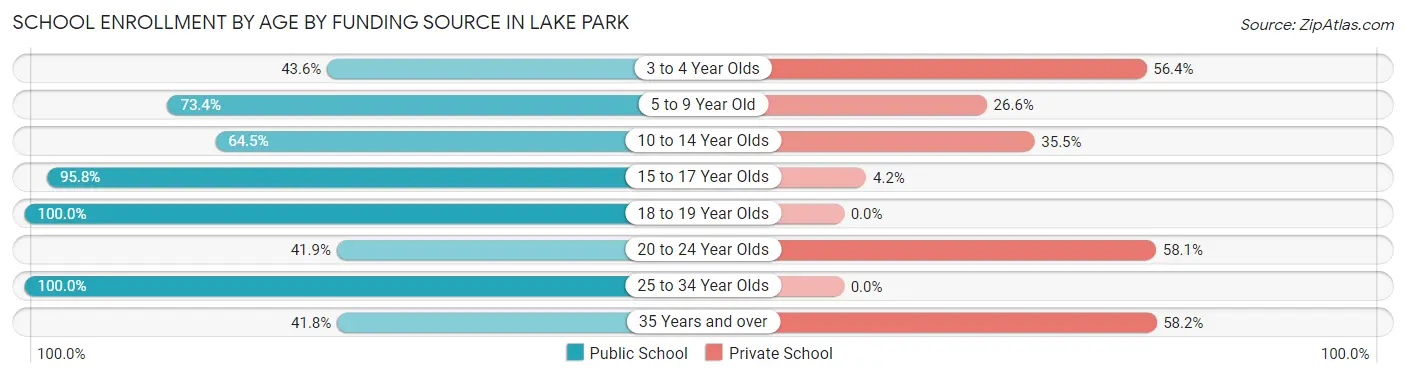
| Age Bracket | Public School | Private School |
| 3 to 4 Year Olds | 24 (43.6%) | 31 (56.4%) |
| 5 to 9 Year Old | 124 (73.4%) | 45 (26.6%) |
| 10 to 14 Year Olds | 187 (64.5%) | 103 (35.5%) |
| 15 to 17 Year Olds | 92 (95.8%) | 4 (4.2%) |
| 18 to 19 Year Olds | 30 (100.0%) | 0 (0.0%) |
| 20 to 24 Year Olds | 36 (41.9%) | 50 (58.1%) |
| 25 to 34 Year Olds | 15 (100.0%) | 0 (0.0%) |
| 35 Years and over | 28 (41.8%) | 39 (58.2%) |
| Total | 536 (66.3%) | 272 (33.7%) |
Educational Attainment by Field of Study in Lake Park
Education (240 | 23.1%), business (190 | 18.3%), science & technology (105 | 10.1%), arts & humanities (93 | 9.0%), and liberal arts & history (91 | 8.8%) are the most common fields of study among 1,037 individuals in Lake Park who have obtained a bachelor's degree or higher.
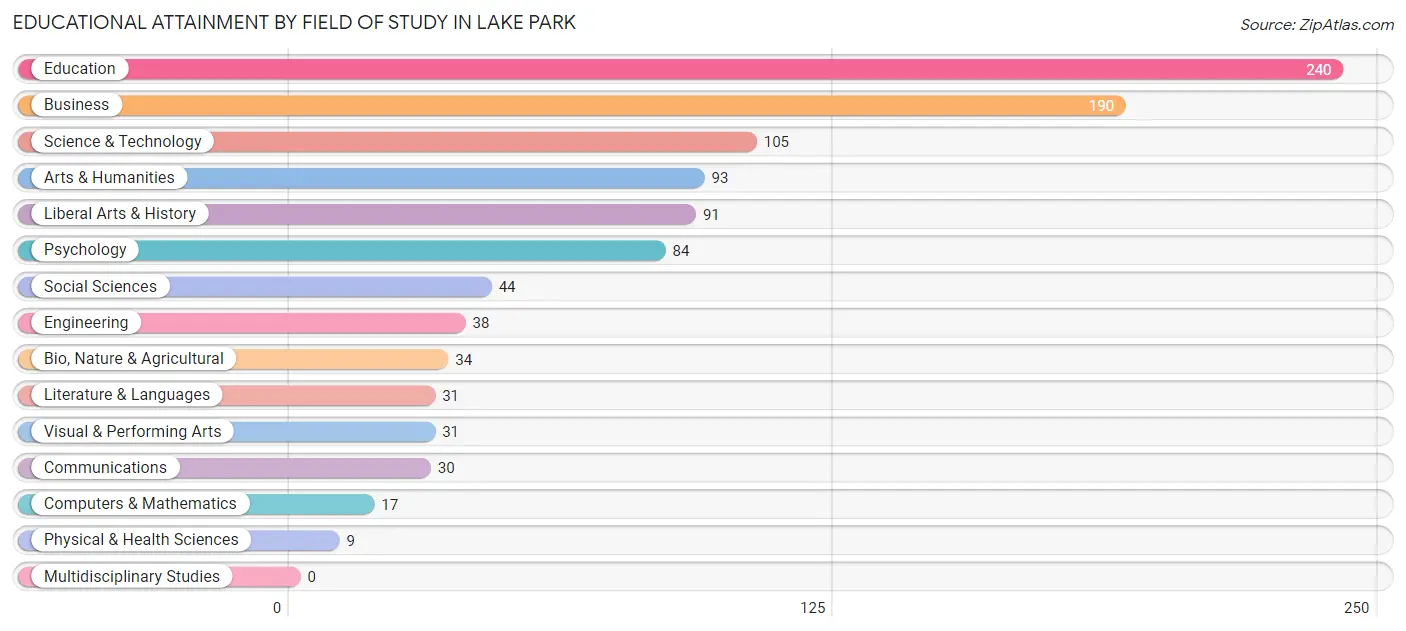
| Field of Study | # Graduates | % Graduates |
| Computers & Mathematics | 17 | 1.6% |
| Bio, Nature & Agricultural | 34 | 3.3% |
| Physical & Health Sciences | 9 | 0.9% |
| Psychology | 84 | 8.1% |
| Social Sciences | 44 | 4.2% |
| Engineering | 38 | 3.7% |
| Multidisciplinary Studies | 0 | 0.0% |
| Science & Technology | 105 | 10.1% |
| Business | 190 | 18.3% |
| Education | 240 | 23.1% |
| Literature & Languages | 31 | 3.0% |
| Liberal Arts & History | 91 | 8.8% |
| Visual & Performing Arts | 31 | 3.0% |
| Communications | 30 | 2.9% |
| Arts & Humanities | 93 | 9.0% |
| Total | 1,037 | 100.0% |
Transportation & Commute in Lake Park
Vehicle Availability by Sex in Lake Park
The most prevalent vehicle ownership categories in Lake Park are males with 2 vehicles (414, accounting for 51.4%) and females with 2 vehicles (361, making up 45.7%).
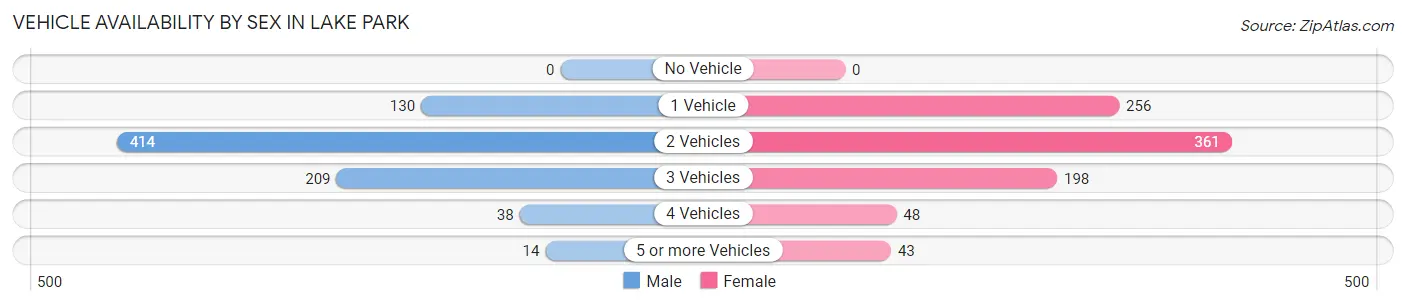
| Vehicles Available | Male | Female |
| No Vehicle | 0 (0.0%) | 0 (0.0%) |
| 1 Vehicle | 130 (16.2%) | 256 (28.3%) |
| 2 Vehicles | 414 (51.4%) | 361 (39.9%) |
| 3 Vehicles | 209 (26.0%) | 198 (21.8%) |
| 4 Vehicles | 38 (4.7%) | 48 (5.3%) |
| 5 or more Vehicles | 14 (1.7%) | 43 (4.8%) |
| Total | 805 (100.0%) | 906 (100.0%) |
Commute Time in Lake Park
The most frequently occuring commute durations in Lake Park are 30 to 34 minutes (387 commuters, 26.4%), 20 to 24 minutes (164 commuters, 11.2%), and 10 to 14 minutes (154 commuters, 10.5%).
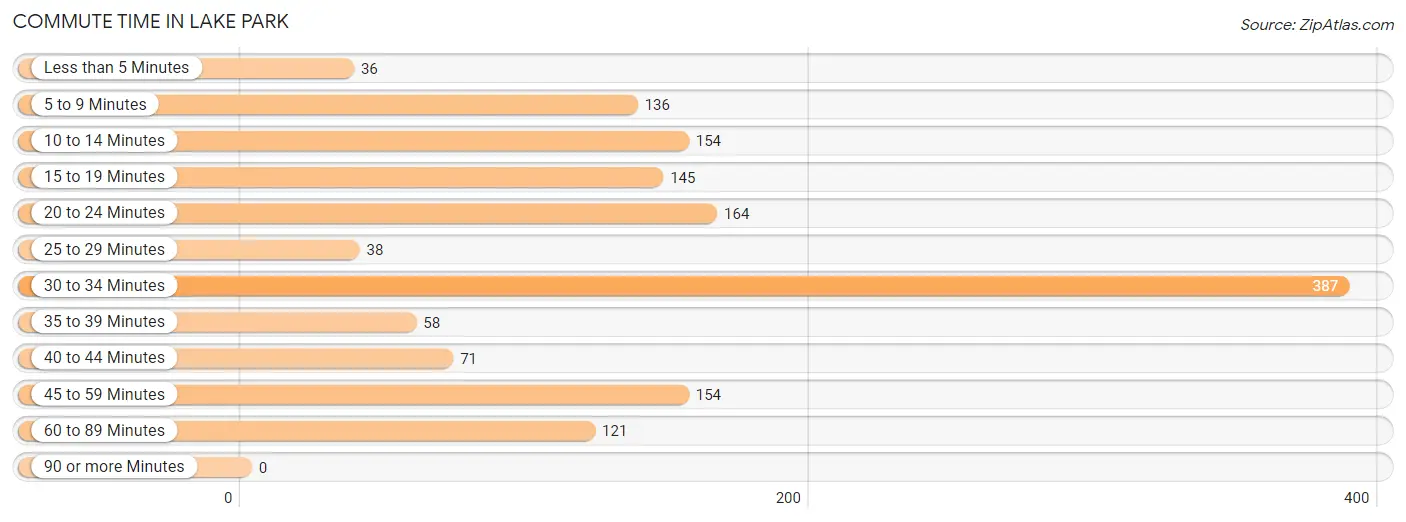
| Commute Time | # Commuters | % Commuters |
| Less than 5 Minutes | 36 | 2.5% |
| 5 to 9 Minutes | 136 | 9.3% |
| 10 to 14 Minutes | 154 | 10.5% |
| 15 to 19 Minutes | 145 | 9.9% |
| 20 to 24 Minutes | 164 | 11.2% |
| 25 to 29 Minutes | 38 | 2.6% |
| 30 to 34 Minutes | 387 | 26.4% |
| 35 to 39 Minutes | 58 | 4.0% |
| 40 to 44 Minutes | 71 | 4.9% |
| 45 to 59 Minutes | 154 | 10.5% |
| 60 to 89 Minutes | 121 | 8.3% |
| 90 or more Minutes | 0 | 0.0% |
Commute Time by Sex in Lake Park
The most common commute times in Lake Park are 30 to 34 minutes (176 commuters, 24.9%) for males and 30 to 34 minutes (211 commuters, 27.8%) for females.
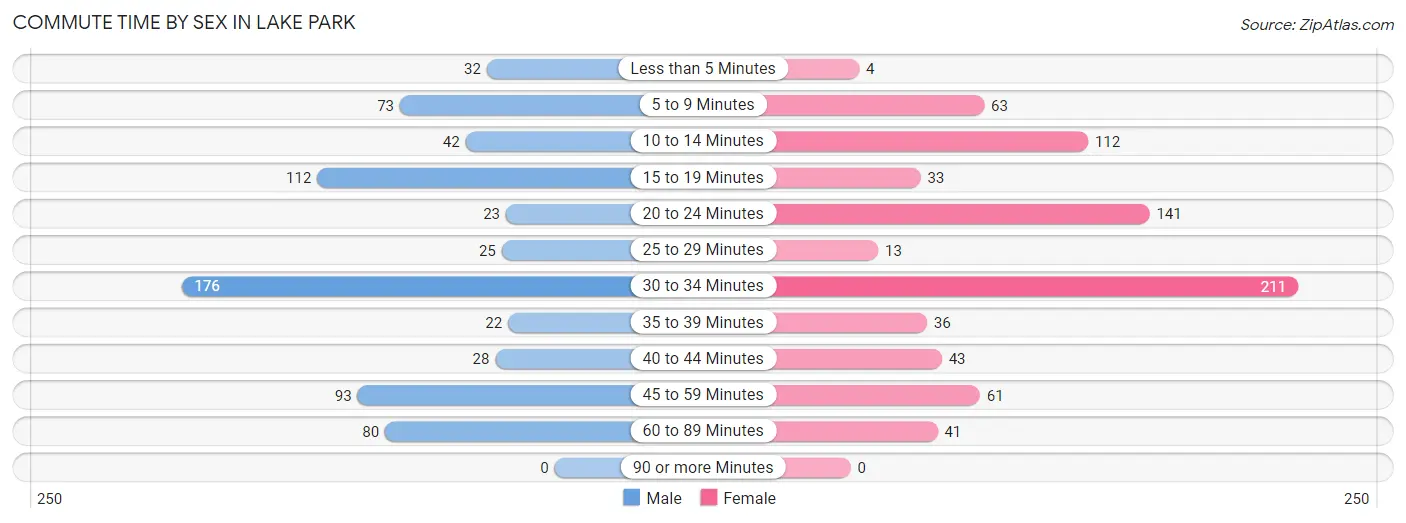
| Commute Time | Male | Female |
| Less than 5 Minutes | 32 (4.5%) | 4 (0.5%) |
| 5 to 9 Minutes | 73 (10.3%) | 63 (8.3%) |
| 10 to 14 Minutes | 42 (5.9%) | 112 (14.8%) |
| 15 to 19 Minutes | 112 (15.9%) | 33 (4.3%) |
| 20 to 24 Minutes | 23 (3.3%) | 141 (18.6%) |
| 25 to 29 Minutes | 25 (3.5%) | 13 (1.7%) |
| 30 to 34 Minutes | 176 (24.9%) | 211 (27.8%) |
| 35 to 39 Minutes | 22 (3.1%) | 36 (4.8%) |
| 40 to 44 Minutes | 28 (4.0%) | 43 (5.7%) |
| 45 to 59 Minutes | 93 (13.2%) | 61 (8.1%) |
| 60 to 89 Minutes | 80 (11.3%) | 41 (5.4%) |
| 90 or more Minutes | 0 (0.0%) | 0 (0.0%) |
Time of Departure to Work by Sex in Lake Park
The most frequent times of departure to work in Lake Park are 7:30 AM to 7:59 AM (120, 17.0%) for males and 6:30 AM to 6:59 AM (143, 18.9%) for females.
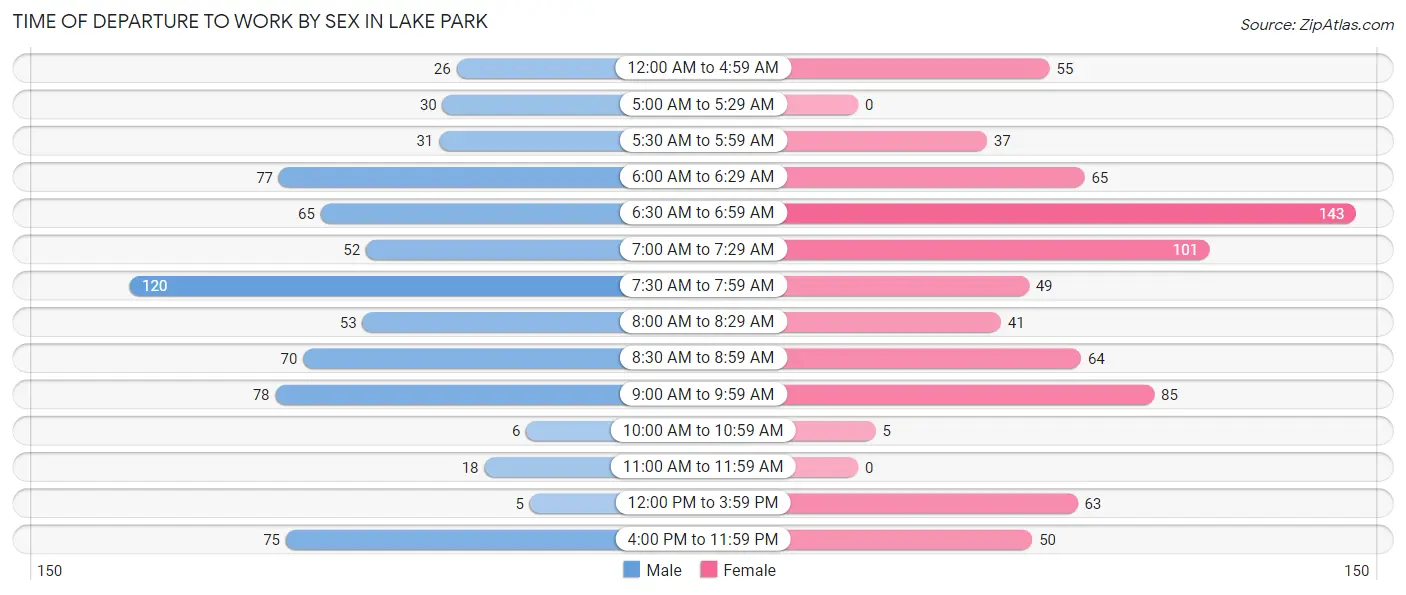
| Time of Departure | Male | Female |
| 12:00 AM to 4:59 AM | 26 (3.7%) | 55 (7.3%) |
| 5:00 AM to 5:29 AM | 30 (4.3%) | 0 (0.0%) |
| 5:30 AM to 5:59 AM | 31 (4.4%) | 37 (4.9%) |
| 6:00 AM to 6:29 AM | 77 (10.9%) | 65 (8.6%) |
| 6:30 AM to 6:59 AM | 65 (9.2%) | 143 (18.9%) |
| 7:00 AM to 7:29 AM | 52 (7.4%) | 101 (13.3%) |
| 7:30 AM to 7:59 AM | 120 (17.0%) | 49 (6.5%) |
| 8:00 AM to 8:29 AM | 53 (7.5%) | 41 (5.4%) |
| 8:30 AM to 8:59 AM | 70 (9.9%) | 64 (8.4%) |
| 9:00 AM to 9:59 AM | 78 (11.1%) | 85 (11.2%) |
| 10:00 AM to 10:59 AM | 6 (0.9%) | 5 (0.7%) |
| 11:00 AM to 11:59 AM | 18 (2.5%) | 0 (0.0%) |
| 12:00 PM to 3:59 PM | 5 (0.7%) | 63 (8.3%) |
| 4:00 PM to 11:59 PM | 75 (10.6%) | 50 (6.6%) |
| Total | 706 (100.0%) | 758 (100.0%) |
Housing Occupancy in Lake Park
Occupancy by Ownership in Lake Park
Of the total 1,299 dwellings in Lake Park, owner-occupied units account for 1,108 (85.3%), while renter-occupied units make up 191 (14.7%).
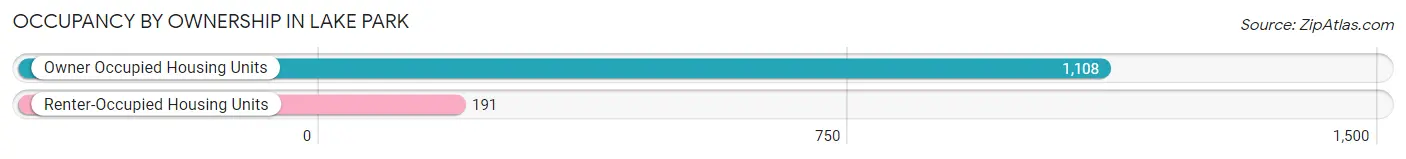
| Occupancy | # Housing Units | % Housing Units |
| Owner Occupied Housing Units | 1,108 | 85.3% |
| Renter-Occupied Housing Units | 191 | 14.7% |
| Total Occupied Housing Units | 1,299 | 100.0% |
Occupancy by Household Size in Lake Park
| Household Size | # Housing Units | % Housing Units |
| 1-Person Household | 387 | 29.8% |
| 2-Person Household | 417 | 32.1% |
| 3-Person Household | 174 | 13.4% |
| 4+ Person Household | 321 | 24.7% |
| Total Housing Units | 1,299 | 100.0% |
Occupancy by Ownership by Household Size in Lake Park
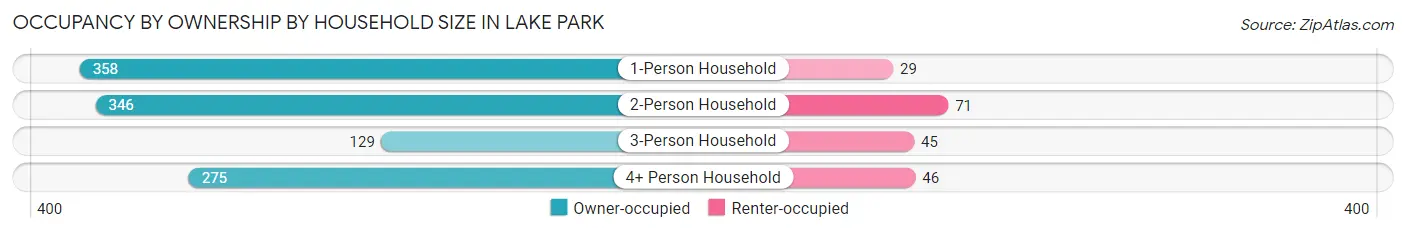
| Household Size | Owner-occupied | Renter-occupied |
| 1-Person Household | 358 (92.5%) | 29 (7.5%) |
| 2-Person Household | 346 (83.0%) | 71 (17.0%) |
| 3-Person Household | 129 (74.1%) | 45 (25.9%) |
| 4+ Person Household | 275 (85.7%) | 46 (14.3%) |
| Total Housing Units | 1,108 (85.3%) | 191 (14.7%) |
Occupancy by Educational Attainment in Lake Park
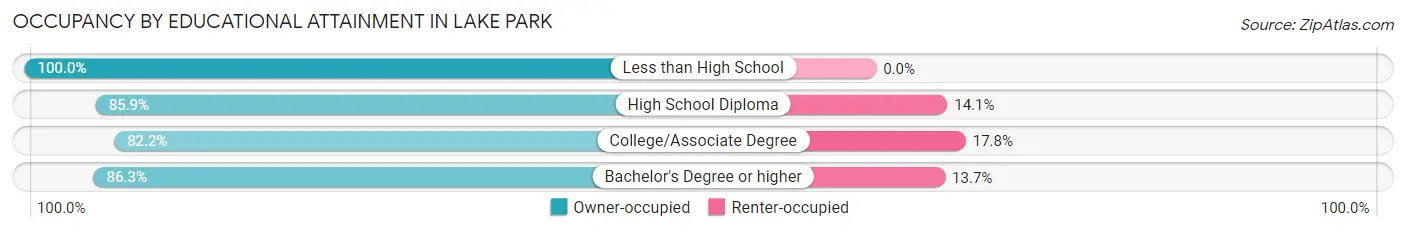
| Household Size | Owner-occupied | Renter-occupied |
| Less than High School | 61 (100.0%) | 0 (0.0%) |
| High School Diploma | 134 (85.9%) | 22 (14.1%) |
| College/Associate Degree | 421 (82.2%) | 91 (17.8%) |
| Bachelor's Degree or higher | 492 (86.3%) | 78 (13.7%) |
Occupancy by Age of Householder in Lake Park
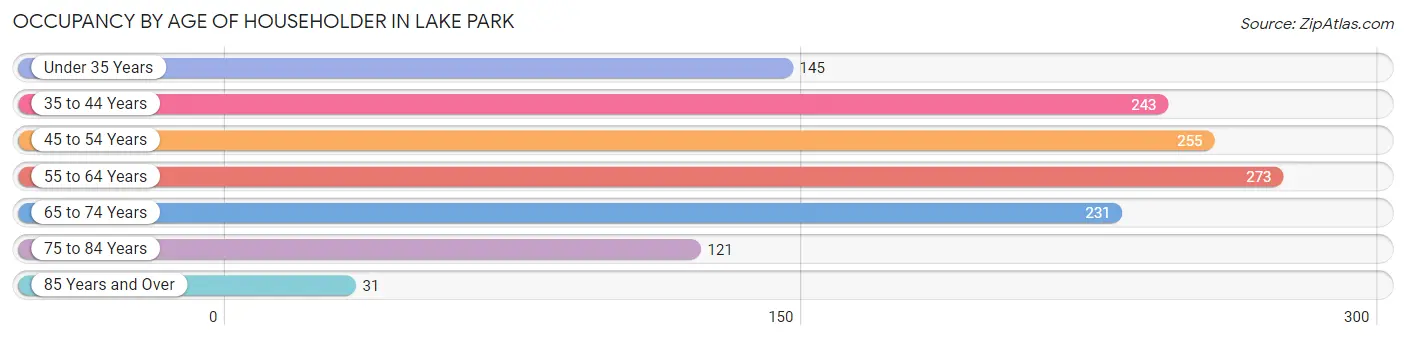
| Age Bracket | # Households | % Households |
| Under 35 Years | 145 | 11.2% |
| 35 to 44 Years | 243 | 18.7% |
| 45 to 54 Years | 255 | 19.6% |
| 55 to 64 Years | 273 | 21.0% |
| 65 to 74 Years | 231 | 17.8% |
| 75 to 84 Years | 121 | 9.3% |
| 85 Years and Over | 31 | 2.4% |
| Total | 1,299 | 100.0% |
Housing Finances in Lake Park
Median Income by Occupancy in Lake Park
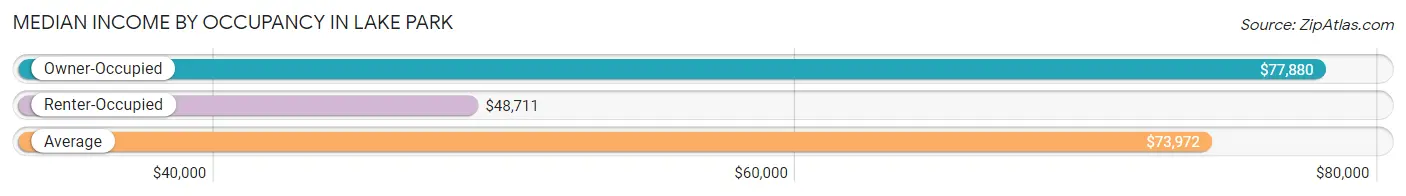
| Occupancy Type | # Households | Median Income |
| Owner-Occupied | 1,108 (85.3%) | $77,880 |
| Renter-Occupied | 191 (14.7%) | $48,711 |
| Average | 1,299 (100.0%) | $73,972 |
Occupancy by Householder Income Bracket in Lake Park
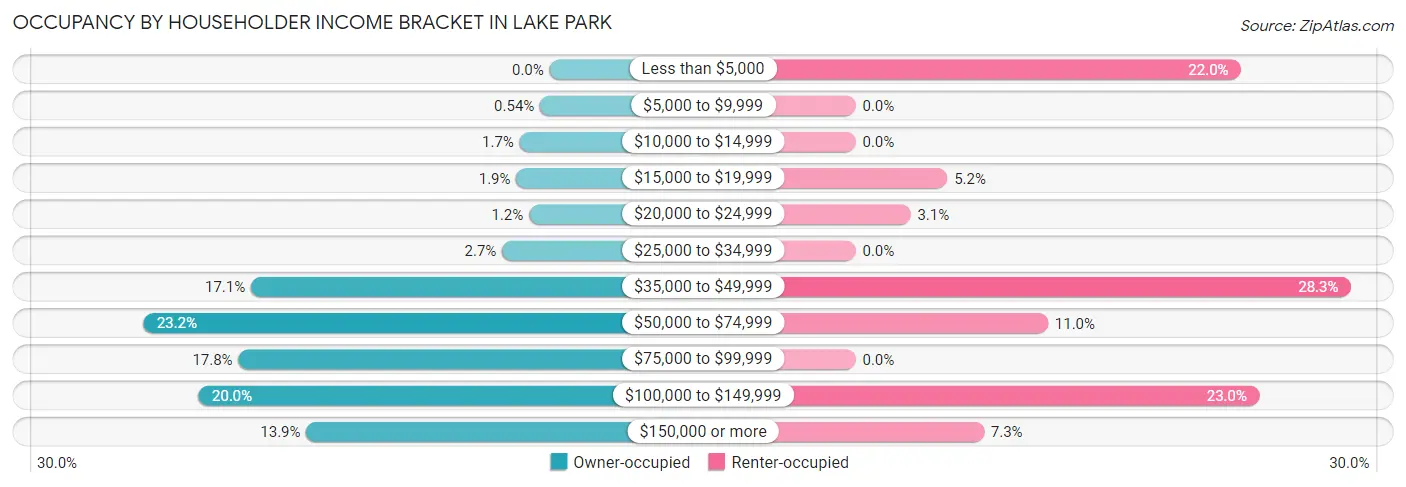
| Income Bracket | Owner-occupied | Renter-occupied |
| Less than $5,000 | 0 (0.0%) | 42 (22.0%) |
| $5,000 to $9,999 | 6 (0.5%) | 0 (0.0%) |
| $10,000 to $14,999 | 19 (1.7%) | 0 (0.0%) |
| $15,000 to $19,999 | 21 (1.9%) | 10 (5.2%) |
| $20,000 to $24,999 | 13 (1.2%) | 6 (3.1%) |
| $25,000 to $34,999 | 30 (2.7%) | 0 (0.0%) |
| $35,000 to $49,999 | 189 (17.1%) | 54 (28.3%) |
| $50,000 to $74,999 | 257 (23.2%) | 21 (11.0%) |
| $75,000 to $99,999 | 197 (17.8%) | 0 (0.0%) |
| $100,000 to $149,999 | 222 (20.0%) | 44 (23.0%) |
| $150,000 or more | 154 (13.9%) | 14 (7.3%) |
| Total | 1,108 (100.0%) | 191 (100.0%) |
Monthly Housing Cost Tiers in Lake Park
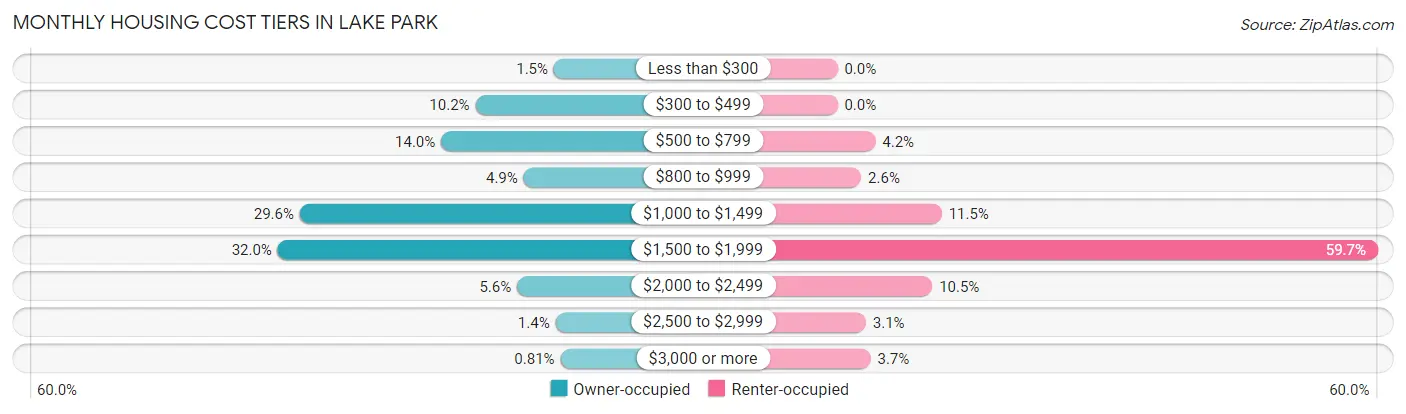
| Monthly Cost | Owner-occupied | Renter-occupied |
| Less than $300 | 17 (1.5%) | 0 (0.0%) |
| $300 to $499 | 113 (10.2%) | 0 (0.0%) |
| $500 to $799 | 155 (14.0%) | 8 (4.2%) |
| $800 to $999 | 54 (4.9%) | 5 (2.6%) |
| $1,000 to $1,499 | 328 (29.6%) | 22 (11.5%) |
| $1,500 to $1,999 | 355 (32.0%) | 114 (59.7%) |
| $2,000 to $2,499 | 62 (5.6%) | 20 (10.5%) |
| $2,500 to $2,999 | 15 (1.3%) | 6 (3.1%) |
| $3,000 or more | 9 (0.8%) | 7 (3.7%) |
| Total | 1,108 (100.0%) | 191 (100.0%) |
Physical Housing Characteristics in Lake Park
Housing Structures in Lake Park
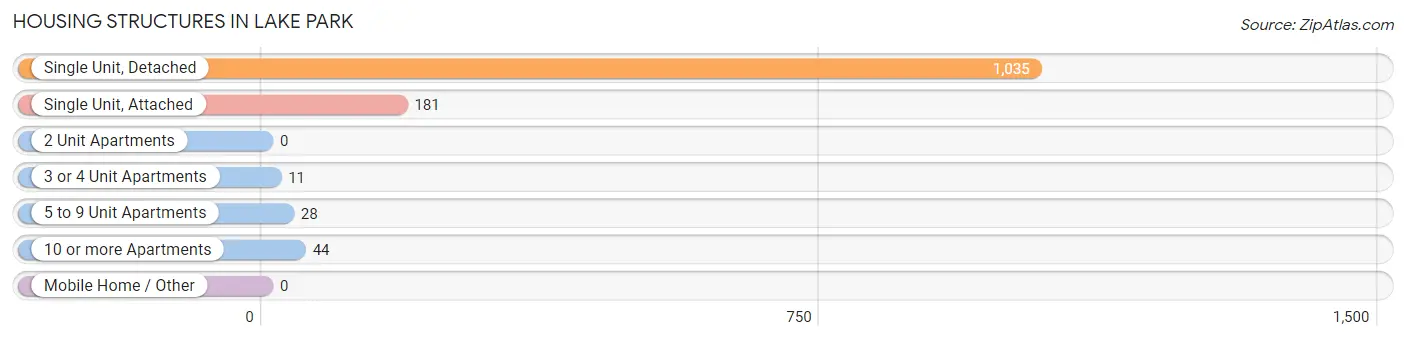
| Structure Type | # Housing Units | % Housing Units |
| Single Unit, Detached | 1,035 | 79.7% |
| Single Unit, Attached | 181 | 13.9% |
| 2 Unit Apartments | 0 | 0.0% |
| 3 or 4 Unit Apartments | 11 | 0.9% |
| 5 to 9 Unit Apartments | 28 | 2.2% |
| 10 or more Apartments | 44 | 3.4% |
| Mobile Home / Other | 0 | 0.0% |
| Total | 1,299 | 100.0% |
Housing Structures by Occupancy in Lake Park
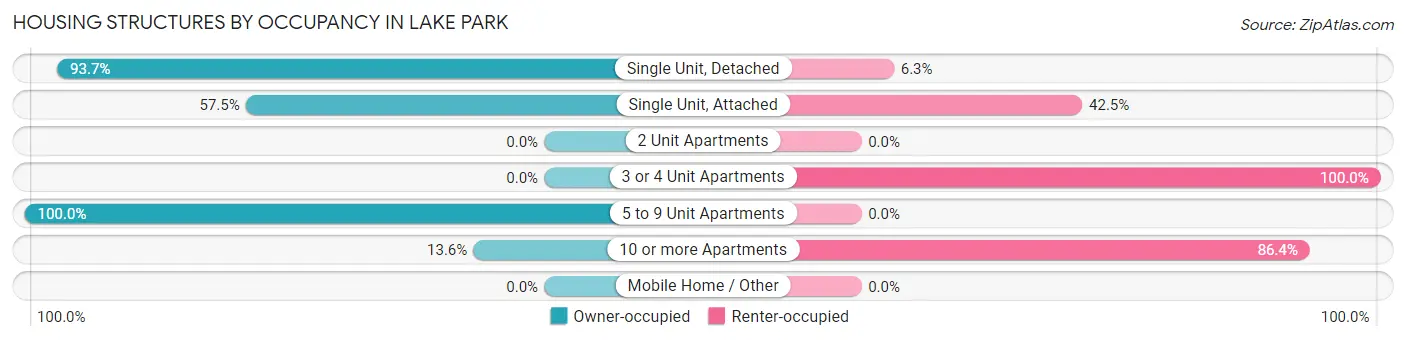
| Structure Type | Owner-occupied | Renter-occupied |
| Single Unit, Detached | 970 (93.7%) | 65 (6.3%) |
| Single Unit, Attached | 104 (57.5%) | 77 (42.5%) |
| 2 Unit Apartments | 0 (0.0%) | 0 (0.0%) |
| 3 or 4 Unit Apartments | 0 (0.0%) | 11 (100.0%) |
| 5 to 9 Unit Apartments | 28 (100.0%) | 0 (0.0%) |
| 10 or more Apartments | 6 (13.6%) | 38 (86.4%) |
| Mobile Home / Other | 0 (0.0%) | 0 (0.0%) |
| Total | 1,108 (85.3%) | 191 (14.7%) |
Housing Structures by Number of Rooms in Lake Park
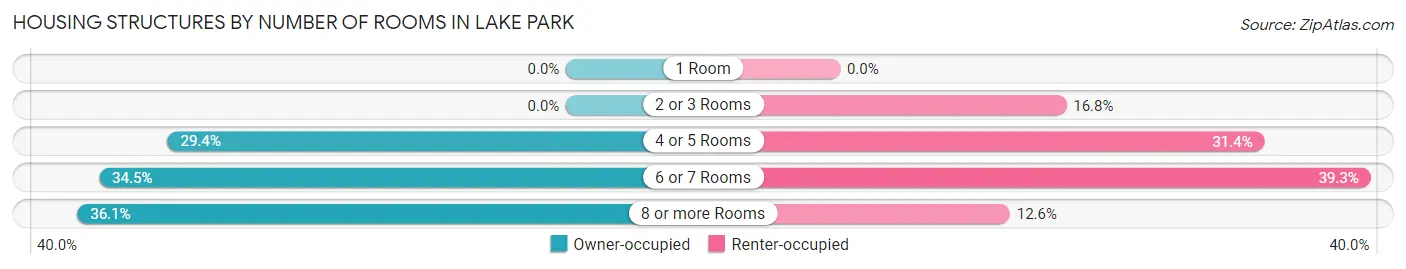
| Number of Rooms | Owner-occupied | Renter-occupied |
| 1 Room | 0 (0.0%) | 0 (0.0%) |
| 2 or 3 Rooms | 0 (0.0%) | 32 (16.8%) |
| 4 or 5 Rooms | 326 (29.4%) | 60 (31.4%) |
| 6 or 7 Rooms | 382 (34.5%) | 75 (39.3%) |
| 8 or more Rooms | 400 (36.1%) | 24 (12.6%) |
| Total | 1,108 (100.0%) | 191 (100.0%) |
Housing Structure by Heating Type in Lake Park
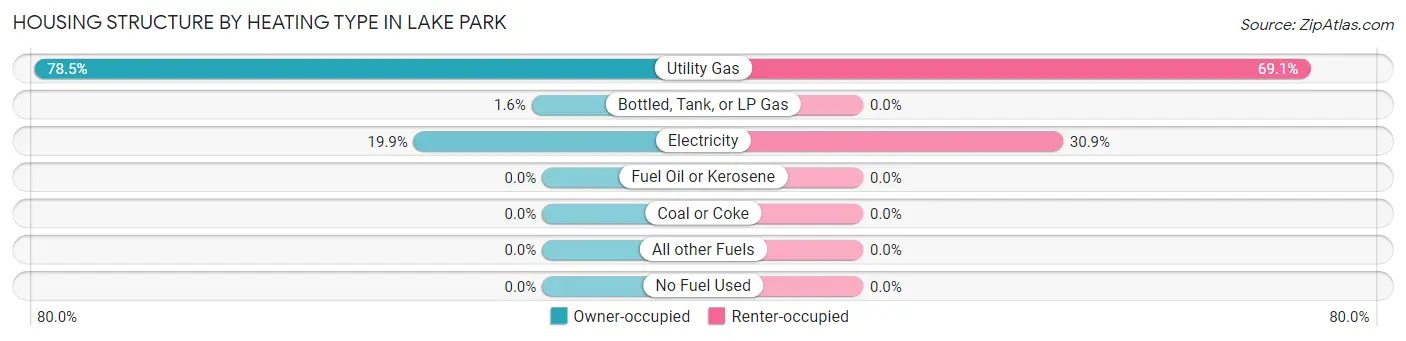
| Heating Type | Owner-occupied | Renter-occupied |
| Utility Gas | 870 (78.5%) | 132 (69.1%) |
| Bottled, Tank, or LP Gas | 18 (1.6%) | 0 (0.0%) |
| Electricity | 220 (19.9%) | 59 (30.9%) |
| Fuel Oil or Kerosene | 0 (0.0%) | 0 (0.0%) |
| Coal or Coke | 0 (0.0%) | 0 (0.0%) |
| All other Fuels | 0 (0.0%) | 0 (0.0%) |
| No Fuel Used | 0 (0.0%) | 0 (0.0%) |
| Total | 1,108 (100.0%) | 191 (100.0%) |
Household Vehicle Usage in Lake Park
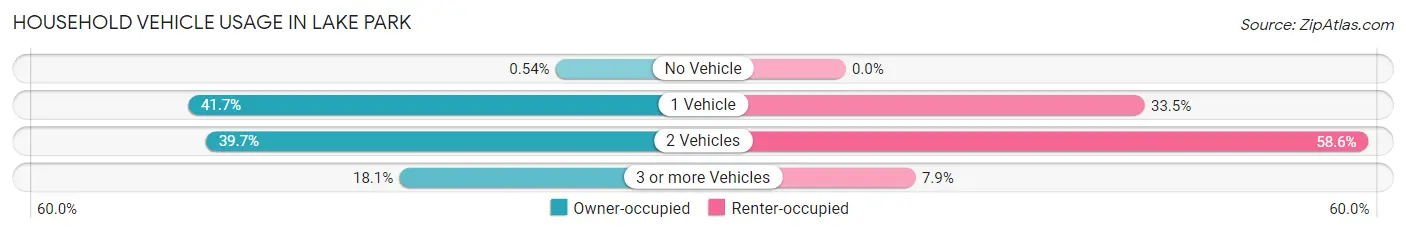
| Vehicles per Household | Owner-occupied | Renter-occupied |
| No Vehicle | 6 (0.5%) | 0 (0.0%) |
| 1 Vehicle | 462 (41.7%) | 64 (33.5%) |
| 2 Vehicles | 440 (39.7%) | 112 (58.6%) |
| 3 or more Vehicles | 200 (18.0%) | 15 (7.9%) |
| Total | 1,108 (100.0%) | 191 (100.0%) |
Real Estate & Mortgages in Lake Park
Real Estate and Mortgage Overview in Lake Park
| Characteristic | Without Mortgage | With Mortgage |
| Housing Units | 266 | 842 |
| Median Property Value | $268,200 | $268,000 |
| Median Household Income | $72,083 | $123 |
| Monthly Housing Costs | $504 | $9 |
| Real Estate Taxes | $1,846 | $0 |
Property Value by Mortgage Status in Lake Park
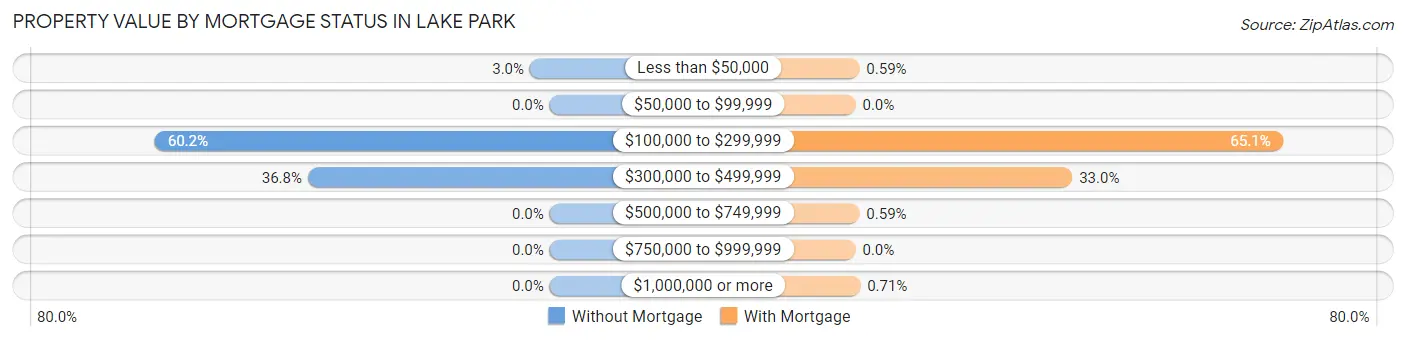
| Property Value | Without Mortgage | With Mortgage |
| Less than $50,000 | 8 (3.0%) | 5 (0.6%) |
| $50,000 to $99,999 | 0 (0.0%) | 0 (0.0%) |
| $100,000 to $299,999 | 160 (60.2%) | 548 (65.1%) |
| $300,000 to $499,999 | 98 (36.8%) | 278 (33.0%) |
| $500,000 to $749,999 | 0 (0.0%) | 5 (0.6%) |
| $750,000 to $999,999 | 0 (0.0%) | 0 (0.0%) |
| $1,000,000 or more | 0 (0.0%) | 6 (0.7%) |
| Total | 266 (100.0%) | 842 (100.0%) |
Household Income by Mortgage Status in Lake Park
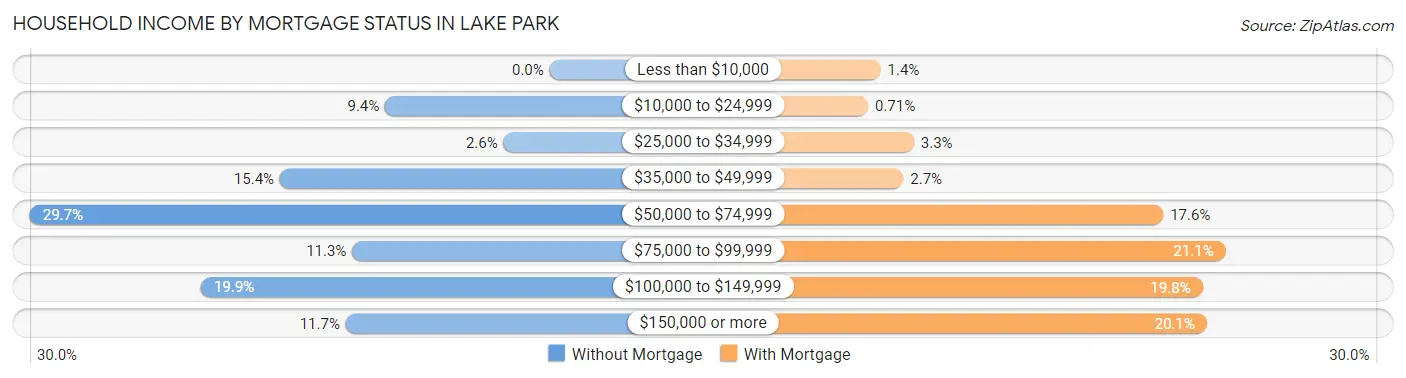
| Household Income | Without Mortgage | With Mortgage |
| Less than $10,000 | 0 (0.0%) | 12 (1.4%) |
| $10,000 to $24,999 | 25 (9.4%) | 6 (0.7%) |
| $25,000 to $34,999 | 7 (2.6%) | 28 (3.3%) |
| $35,000 to $49,999 | 41 (15.4%) | 23 (2.7%) |
| $50,000 to $74,999 | 79 (29.7%) | 148 (17.6%) |
| $75,000 to $99,999 | 30 (11.3%) | 178 (21.1%) |
| $100,000 to $149,999 | 53 (19.9%) | 167 (19.8%) |
| $150,000 or more | 31 (11.7%) | 169 (20.1%) |
| Total | 266 (100.0%) | 842 (100.0%) |
Property Value to Household Income Ratio in Lake Park
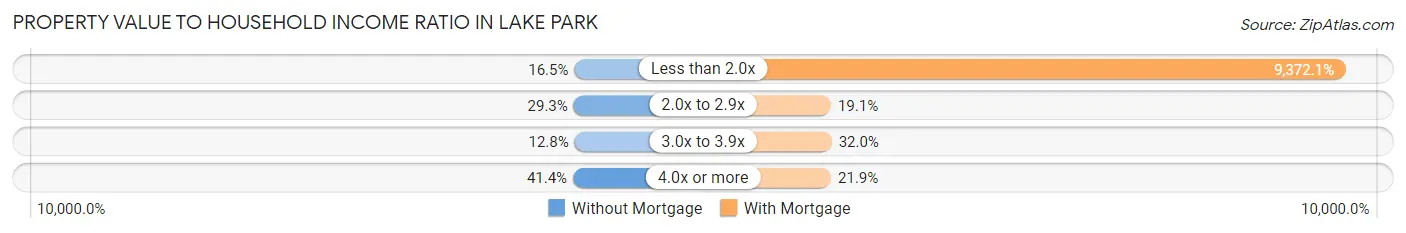
| Value-to-Income Ratio | Without Mortgage | With Mortgage |
| Less than 2.0x | 44 (16.5%) | 78,913 (9,372.1%) |
| 2.0x to 2.9x | 78 (29.3%) | 161 (19.1%) |
| 3.0x to 3.9x | 34 (12.8%) | 269 (32.0%) |
| 4.0x or more | 110 (41.3%) | 184 (21.8%) |
| Total | 266 (100.0%) | 842 (100.0%) |
Real Estate Taxes by Mortgage Status in Lake Park
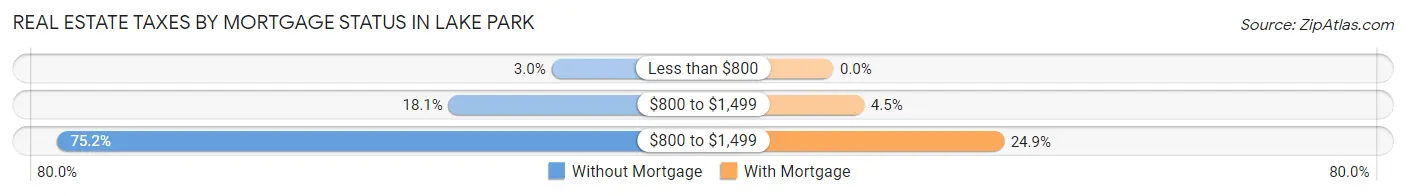
| Property Taxes | Without Mortgage | With Mortgage |
| Less than $800 | 8 (3.0%) | 0 (0.0%) |
| $800 to $1,499 | 48 (18.0%) | 38 (4.5%) |
| $800 to $1,499 | 200 (75.2%) | 210 (24.9%) |
| Total | 266 (100.0%) | 842 (100.0%) |
Health & Disability in Lake Park
Health Insurance Coverage by Age in Lake Park
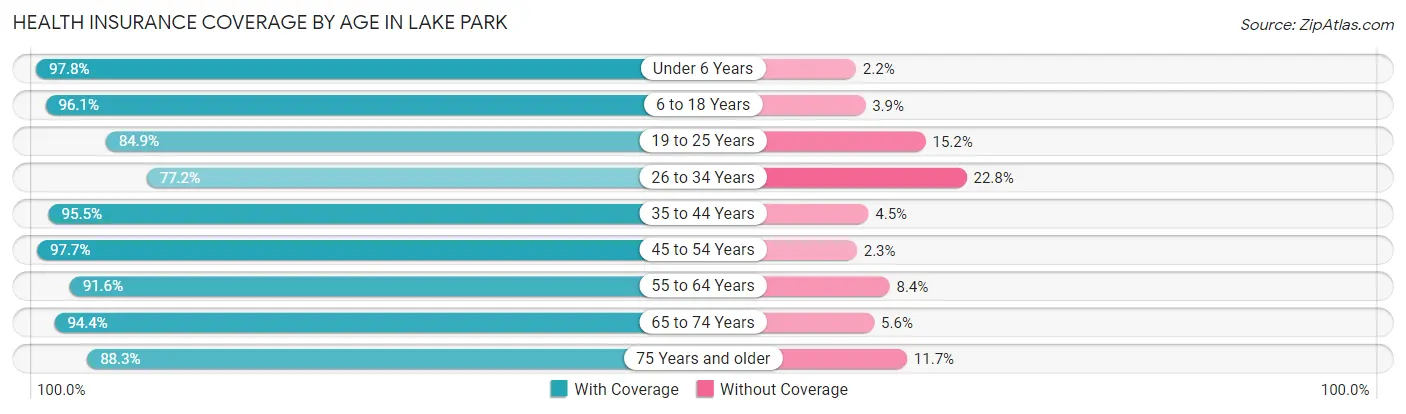
| Age Bracket | With Coverage | Without Coverage |
| Under 6 Years | 226 (97.8%) | 5 (2.2%) |
| 6 to 18 Years | 517 (96.1%) | 21 (3.9%) |
| 19 to 25 Years | 196 (84.9%) | 35 (15.1%) |
| 26 to 34 Years | 315 (77.2%) | 93 (22.8%) |
| 35 to 44 Years | 425 (95.5%) | 20 (4.5%) |
| 45 to 54 Years | 420 (97.7%) | 10 (2.3%) |
| 55 to 64 Years | 358 (91.6%) | 33 (8.4%) |
| 65 to 74 Years | 356 (94.4%) | 21 (5.6%) |
| 75 Years and older | 174 (88.3%) | 23 (11.7%) |
| Total | 2,987 (92.0%) | 261 (8.0%) |
Health Insurance Coverage by Citizenship Status in Lake Park
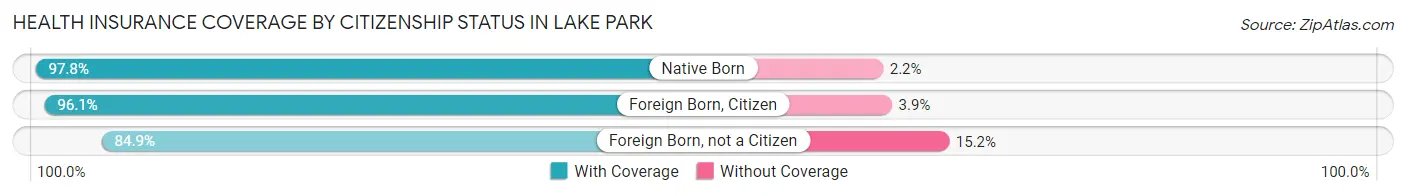
| Citizenship Status | With Coverage | Without Coverage |
| Native Born | 226 (97.8%) | 5 (2.2%) |
| Foreign Born, Citizen | 517 (96.1%) | 21 (3.9%) |
| Foreign Born, not a Citizen | 196 (84.9%) | 35 (15.1%) |
Health Insurance Coverage by Household Income in Lake Park
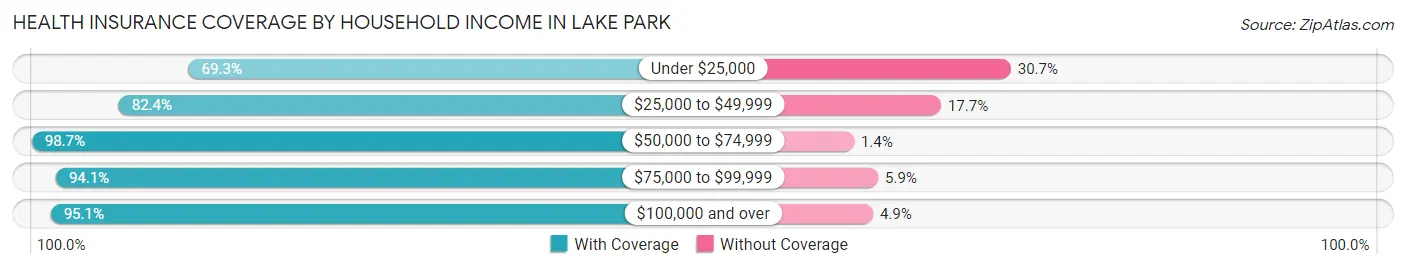
| Household Income | With Coverage | Without Coverage |
| Under $25,000 | 124 (69.3%) | 55 (30.7%) |
| $25,000 to $49,999 | 476 (82.4%) | 102 (17.6%) |
| $50,000 to $74,999 | 656 (98.7%) | 9 (1.3%) |
| $75,000 to $99,999 | 528 (94.1%) | 33 (5.9%) |
| $100,000 and over | 1,203 (95.1%) | 62 (4.9%) |
Public vs Private Health Insurance Coverage by Age in Lake Park
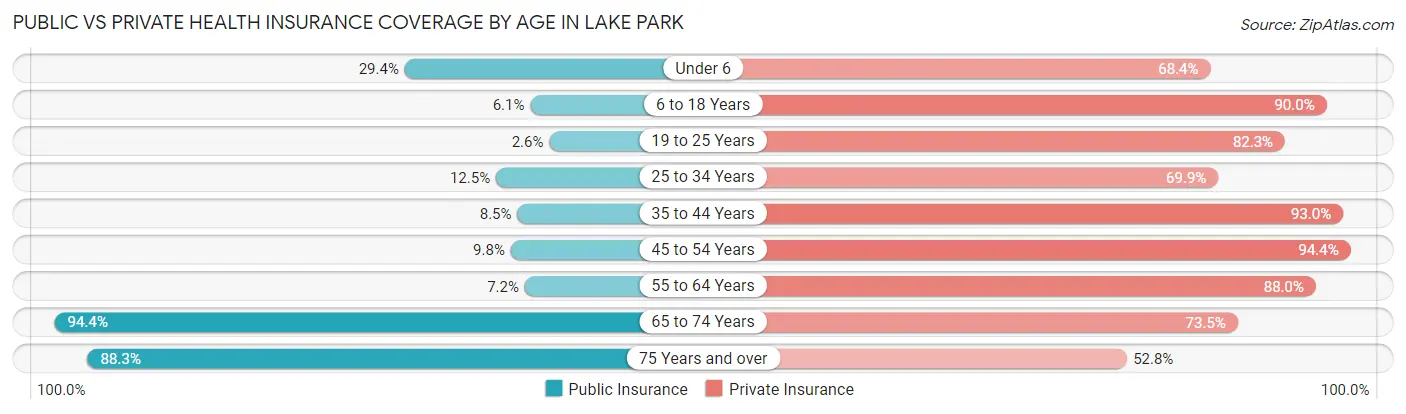
| Age Bracket | Public Insurance | Private Insurance |
| Under 6 | 68 (29.4%) | 158 (68.4%) |
| 6 to 18 Years | 33 (6.1%) | 484 (90.0%) |
| 19 to 25 Years | 6 (2.6%) | 190 (82.3%) |
| 25 to 34 Years | 51 (12.5%) | 285 (69.9%) |
| 35 to 44 Years | 38 (8.5%) | 414 (93.0%) |
| 45 to 54 Years | 42 (9.8%) | 406 (94.4%) |
| 55 to 64 Years | 28 (7.2%) | 344 (88.0%) |
| 65 to 74 Years | 356 (94.4%) | 277 (73.5%) |
| 75 Years and over | 174 (88.3%) | 104 (52.8%) |
| Total | 796 (24.5%) | 2,662 (82.0%) |
Disability Status by Sex by Age in Lake Park
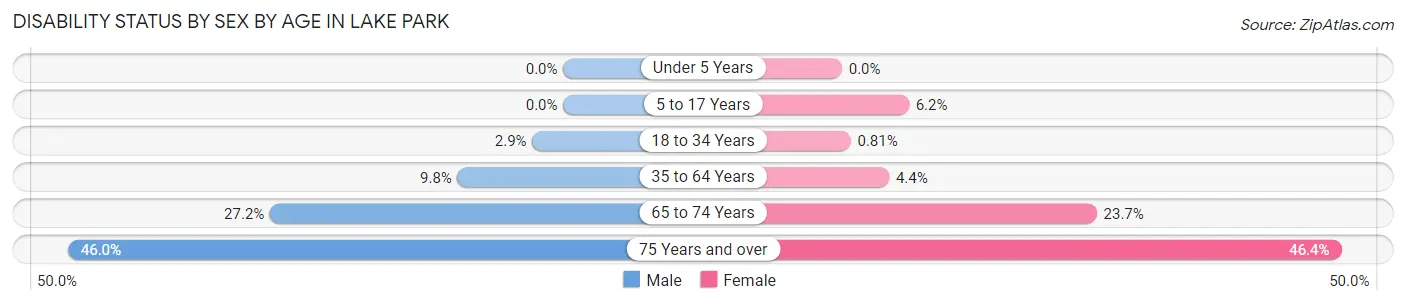
| Age Bracket | Male | Female |
| Under 5 Years | 0 (0.0%) | 0 (0.0%) |
| 5 to 17 Years | 0 (0.0%) | 20 (6.2%) |
| 18 to 34 Years | 8 (2.9%) | 3 (0.8%) |
| 35 to 64 Years | 57 (9.8%) | 30 (4.4%) |
| 65 to 74 Years | 37 (27.2%) | 57 (23.6%) |
| 75 Years and over | 40 (46.0%) | 51 (46.4%) |
Disability Class by Sex by Age in Lake Park
Disability Class: Hearing Difficulty
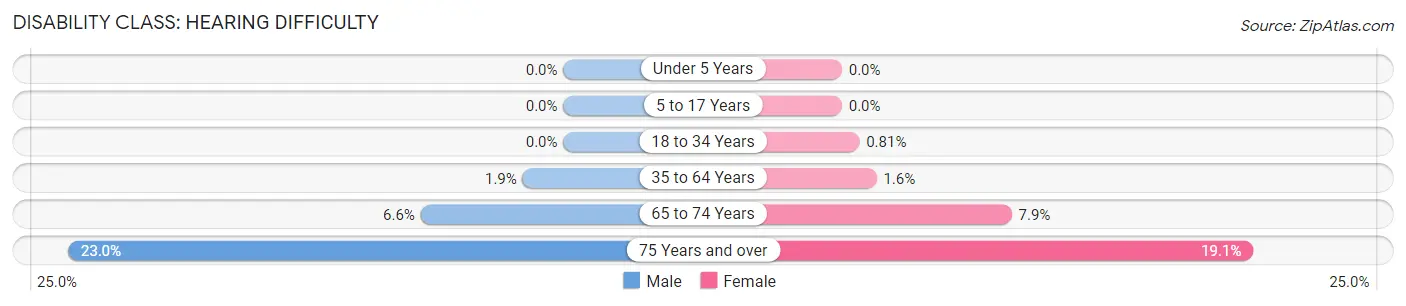
| Age Bracket | Male | Female |
| Under 5 Years | 0 (0.0%) | 0 (0.0%) |
| 5 to 17 Years | 0 (0.0%) | 0 (0.0%) |
| 18 to 34 Years | 0 (0.0%) | 3 (0.8%) |
| 35 to 64 Years | 11 (1.9%) | 11 (1.6%) |
| 65 to 74 Years | 9 (6.6%) | 19 (7.9%) |
| 75 Years and over | 20 (23.0%) | 21 (19.1%) |
Disability Class: Vision Difficulty
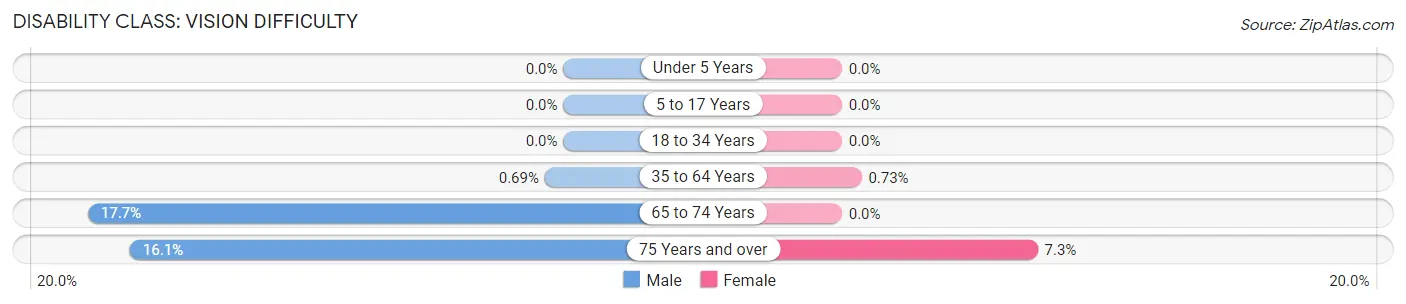
| Age Bracket | Male | Female |
| Under 5 Years | 0 (0.0%) | 0 (0.0%) |
| 5 to 17 Years | 0 (0.0%) | 0 (0.0%) |
| 18 to 34 Years | 0 (0.0%) | 0 (0.0%) |
| 35 to 64 Years | 4 (0.7%) | 5 (0.7%) |
| 65 to 74 Years | 24 (17.6%) | 0 (0.0%) |
| 75 Years and over | 14 (16.1%) | 8 (7.3%) |
Disability Class: Cognitive Difficulty
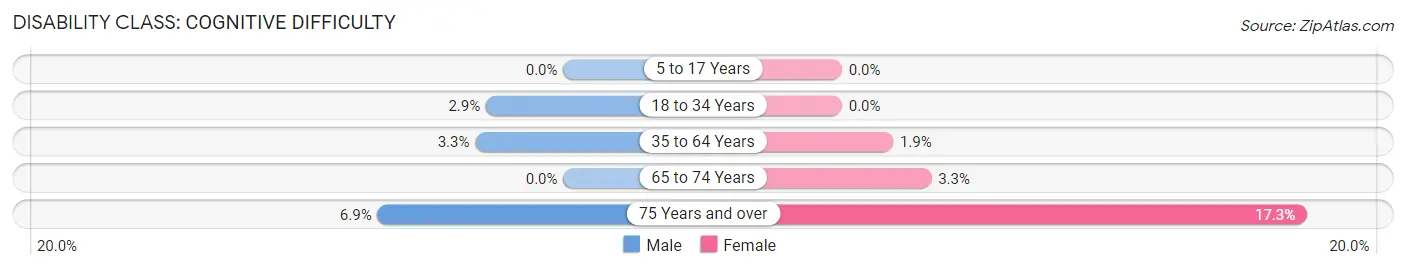
| Age Bracket | Male | Female |
| 5 to 17 Years | 0 (0.0%) | 0 (0.0%) |
| 18 to 34 Years | 8 (2.9%) | 0 (0.0%) |
| 35 to 64 Years | 19 (3.3%) | 13 (1.9%) |
| 65 to 74 Years | 0 (0.0%) | 8 (3.3%) |
| 75 Years and over | 6 (6.9%) | 19 (17.3%) |
Disability Class: Ambulatory Difficulty
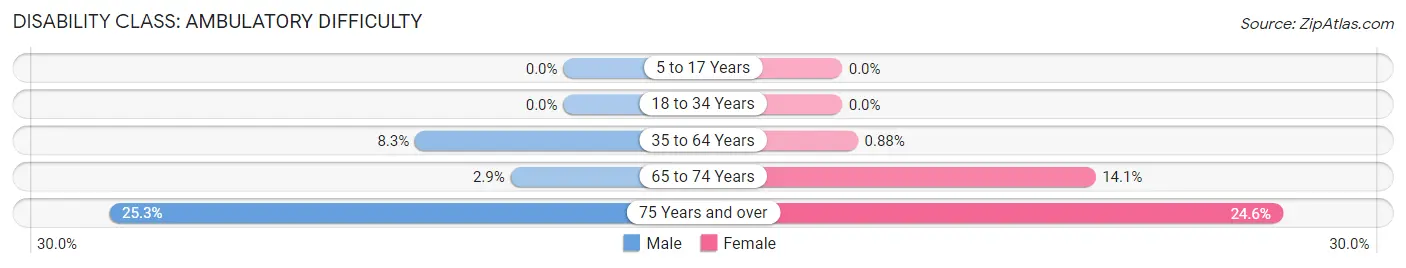
| Age Bracket | Male | Female |
| 5 to 17 Years | 0 (0.0%) | 0 (0.0%) |
| 18 to 34 Years | 0 (0.0%) | 0 (0.0%) |
| 35 to 64 Years | 48 (8.3%) | 6 (0.9%) |
| 65 to 74 Years | 4 (2.9%) | 34 (14.1%) |
| 75 Years and over | 22 (25.3%) | 27 (24.5%) |
Disability Class: Self-Care Difficulty
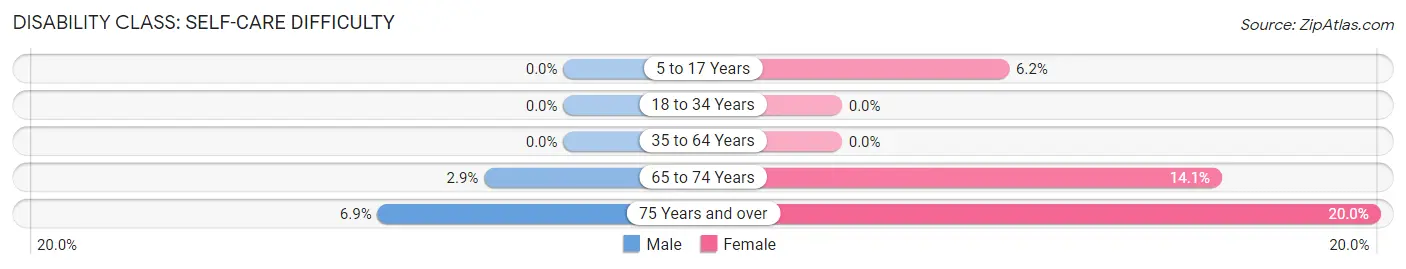
| Age Bracket | Male | Female |
| 5 to 17 Years | 0 (0.0%) | 20 (6.2%) |
| 18 to 34 Years | 0 (0.0%) | 0 (0.0%) |
| 35 to 64 Years | 0 (0.0%) | 0 (0.0%) |
| 65 to 74 Years | 4 (2.9%) | 34 (14.1%) |
| 75 Years and over | 6 (6.9%) | 22 (20.0%) |
Technology Access in Lake Park
Computing Device Access in Lake Park
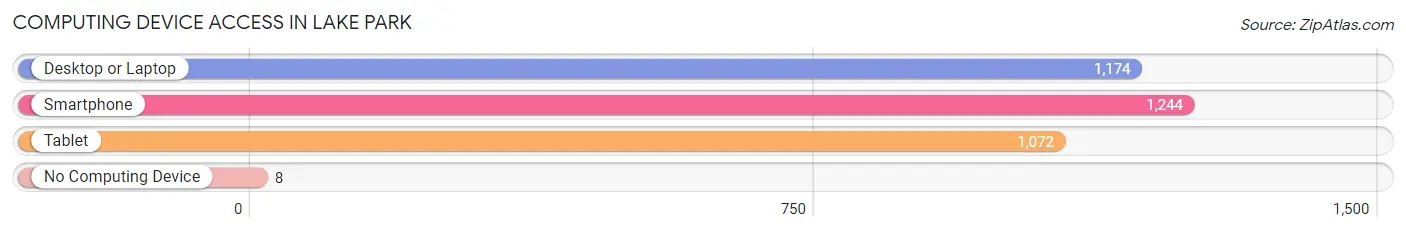
| Device Type | # Households | % Households |
| Desktop or Laptop | 1,174 | 90.4% |
| Smartphone | 1,244 | 95.8% |
| Tablet | 1,072 | 82.5% |
| No Computing Device | 8 | 0.6% |
| Total | 1,299 | 100.0% |
Internet Access in Lake Park
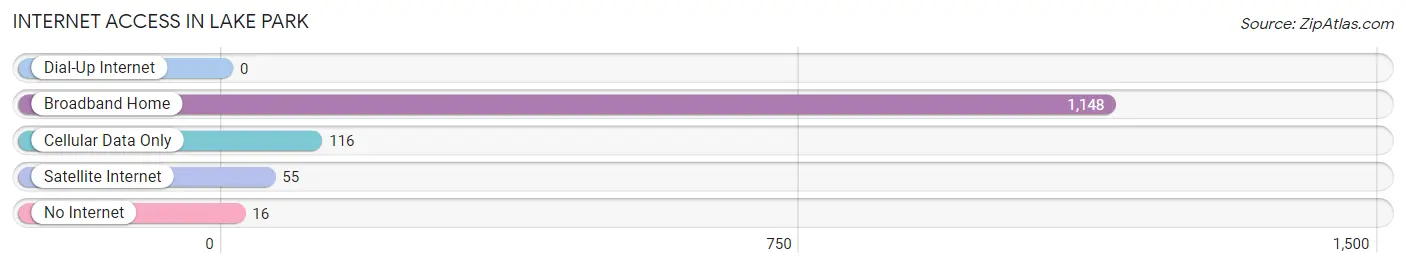
| Internet Type | # Households | % Households |
| Dial-Up Internet | 0 | 0.0% |
| Broadband Home | 1,148 | 88.4% |
| Cellular Data Only | 116 | 8.9% |
| Satellite Internet | 55 | 4.2% |
| No Internet | 16 | 1.2% |
| Total | 1,299 | 100.0% |
Lake Park Summary
Park Lake is a small town located in North Carolina, United States. It is situated in the foothills of the Blue Ridge Mountains, and is part of the Hickory-Lenoir-Morganton Metropolitan Statistical Area. The town has a population of approximately 1,000 people, and is located in Catawba County.
History
Park Lake was founded in 1887 by a group of settlers from the nearby town of Hickory. The town was originally known as “Park’s Lake”, named after the nearby lake. The lake was named after the first settler, William Park, who had purchased the land from the Catawba Indians. The town was incorporated in 1891, and the first post office was established in 1892.
The town grew slowly over the years, and by the early 1900s, it had become a popular tourist destination. The town was known for its beautiful scenery, and was a popular spot for fishing and camping. In the 1920s, the town began to experience a period of growth, as more people moved to the area. The town was also home to several businesses, including a sawmill, a gristmill, and a general store.
Geography
Park Lake is located in the foothills of the Blue Ridge Mountains, and is part of the Hickory-Lenoir-Morganton Metropolitan Statistical Area. The town is situated on the banks of the Catawba River, and is surrounded by rolling hills and forests. The town is located approximately 30 miles from Charlotte, and is accessible by Interstate 40.
The climate in Park Lake is mild, with temperatures ranging from the mid-50s in the winter to the mid-80s in the summer. The town receives an average of 45 inches of rain per year, and is known for its mild winters and hot summers.
Economy
The economy of Park Lake is largely based on tourism and agriculture. The town is home to several small businesses, including restaurants, shops, and a general store. The town is also home to several farms, which produce a variety of crops, including corn, soybeans, and tobacco.
The town is also home to several manufacturing companies, including a furniture factory and a textile mill. The town is also home to several small businesses, including a gas station, a grocery store, and a hardware store.
Demographics
As of the 2010 census, the population of Park Lake was 1,000 people. The racial makeup of the town was 97.2% White, 0.7% African American, 0.3% Native American, 0.3% Asian, and 1.5% from other races. The median household income was $37,500, and the median age was 43.
Conclusion
Park Lake is a small town located in North Carolina, United States. It is situated in the foothills of the Blue Ridge Mountains, and is part of the Hickory-Lenoir-Morganton Metropolitan Statistical Area. The town has a population of approximately 1,000 people, and is located in Catawba County. The economy of Park Lake is largely based on tourism and agriculture, and the town is home to several small businesses, including restaurants, shops, and a general store. The racial makeup of the town is 97.2% White, 0.7% African American, 0.3% Native American, 0.3% Asian, and 1.5% from other races. The median household income was $37,500, and the median age was 43.
Common Questions
What is Per Capita Income in Lake Park?
Per Capita income in Lake Park is $36,870.
What is the Median Family Income in Lake Park?
Median Family Income in Lake Park is $83,750.
What is the Median Household income in Lake Park?
Median Household Income in Lake Park is $73,972.
What is Income or Wage Gap in Lake Park?
Income or Wage Gap in Lake Park is 48.1%.
Women in Lake Park earn 51.9 cents for every dollar earned by a man.
What is Inequality or Gini Index in Lake Park?
Inequality or Gini Index in Lake Park is 0.37.
What is the Total Population of Lake Park?
Total Population of Lake Park is 3,342.
What is the Total Male Population of Lake Park?
Total Male Population of Lake Park is 1,495.
What is the Total Female Population of Lake Park?
Total Female Population of Lake Park is 1,847.
What is the Ratio of Males per 100 Females in Lake Park?
There are 80.94 Males per 100 Females in Lake Park.
What is the Ratio of Females per 100 Males in Lake Park?
There are 123.55 Females per 100 Males in Lake Park.
What is the Median Population Age in Lake Park?
Median Population Age in Lake Park is 40.0 Years.
What is the Average Family Size in Lake Park
Average Family Size in Lake Park is 3.2 People.
What is the Average Household Size in Lake Park
Average Household Size in Lake Park is 2.5 People.
How Large is the Labor Force in Lake Park?
There are 1,818 People in the Labor Forcein in Lake Park.
What is the Percentage of People in the Labor Force in Lake Park?
68.5% of People are in the Labor Force in Lake Park.
What is the Unemployment Rate in Lake Park?
Unemployment Rate in Lake Park is 3.6%.