Swansboro, NC Map & Demographics
Swansboro Map
Swansboro Overview
$45,028
PER CAPITA INCOME
$113,384
AVG FAMILY INCOME
$105,779
AVG HOUSEHOLD INCOME
8.1%
WAGE / INCOME GAP [ % ]
91.9¢/ $1
WAGE / INCOME GAP [ $ ]
0.49
INEQUALITY / GINI INDEX
3,759
TOTAL POPULATION
1,762
MALE POPULATION
1,997
FEMALE POPULATION
88.23
MALES / 100 FEMALES
113.34
FEMALES / 100 MALES
39.0
MEDIAN AGE
3.1
AVG FAMILY SIZE
2.6
AVG HOUSEHOLD SIZE
1,649
LABOR FORCE [ PEOPLE ]
60.4%
PERCENT IN LABOR FORCE
Swansboro Zip Codes
Income in Swansboro
Income Overview in Swansboro
Per Capita Income in Swansboro is $45,028, while median incomes of families and households are $113,384 and $105,779 respectively.
| Characteristic | Number | Measure |
| Per Capita Income | 3,759 | $45,028 |
| Median Family Income | 1,101 | $113,384 |
| Mean Family Income | 1,101 | $142,216 |
| Median Household Income | 1,423 | $105,779 |
| Mean Household Income | 1,423 | $121,051 |
| Income Deficit | 1,101 | $0 |
| Wage / Income Gap (%) | 3,759 | 8.05% |
| Wage / Income Gap ($) | 3,759 | 91.95¢ per $1 |
| Gini / Inequality Index | 3,759 | 0.49 |
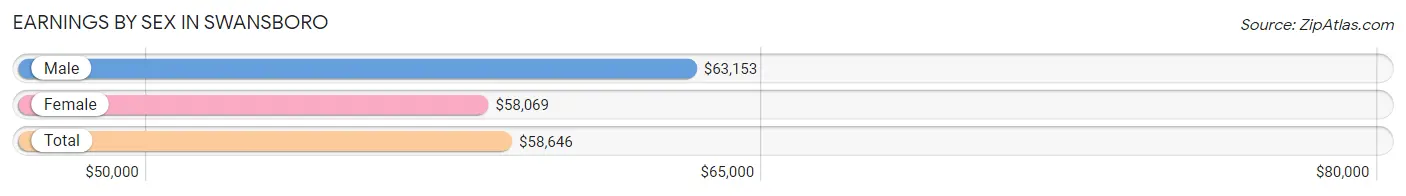
Earnings by Sex in Swansboro
Average Earnings in Swansboro are $58,646, $63,153 for men and $58,069 for women, a difference of 8.1%.
| Sex | Number | Average Earnings |
| Male | 789 (43.4%) | $63,153 |
| Female | 1,029 (56.6%) | $58,069 |
| Total | 1,818 (100.0%) | $58,646 |
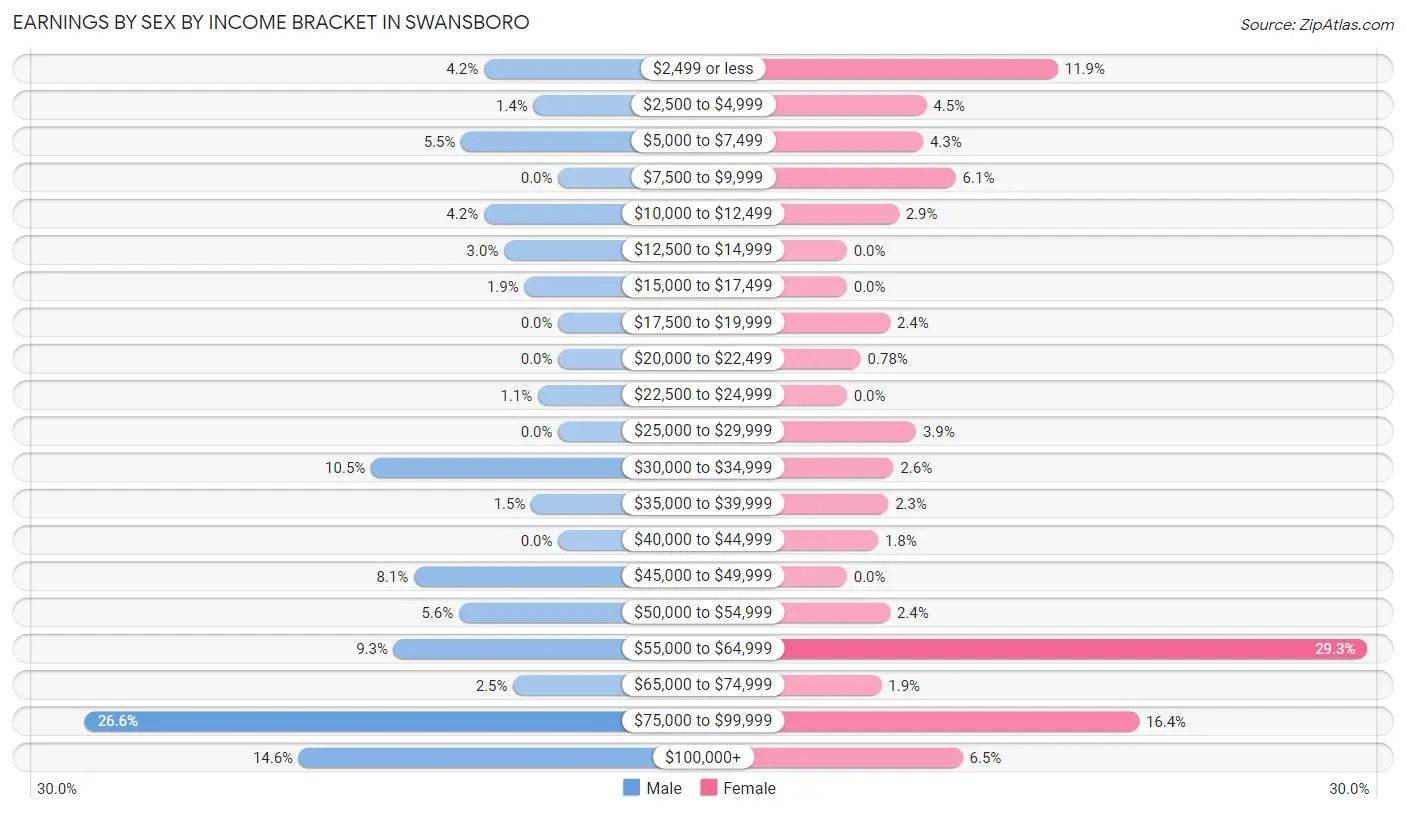
Earnings by Sex by Income Bracket in Swansboro
The most common earnings brackets in Swansboro are $75,000 to $99,999 for men (210 | 26.6%) and $55,000 to $64,999 for women (301 | 29.2%).
| Income | Male | Female |
| $2,499 or less | 33 (4.2%) | 122 (11.9%) |
| $2,500 to $4,999 | 11 (1.4%) | 46 (4.5%) |
| $5,000 to $7,499 | 43 (5.4%) | 44 (4.3%) |
| $7,500 to $9,999 | 0 (0.0%) | 63 (6.1%) |
| $10,000 to $12,499 | 33 (4.2%) | 30 (2.9%) |
| $12,500 to $14,999 | 24 (3.0%) | 0 (0.0%) |
| $15,000 to $17,499 | 15 (1.9%) | 0 (0.0%) |
| $17,500 to $19,999 | 0 (0.0%) | 25 (2.4%) |
| $20,000 to $22,499 | 0 (0.0%) | 8 (0.8%) |
| $22,500 to $24,999 | 9 (1.1%) | 0 (0.0%) |
| $25,000 to $29,999 | 0 (0.0%) | 40 (3.9%) |
| $30,000 to $34,999 | 83 (10.5%) | 27 (2.6%) |
| $35,000 to $39,999 | 12 (1.5%) | 24 (2.3%) |
| $40,000 to $44,999 | 0 (0.0%) | 18 (1.8%) |
| $45,000 to $49,999 | 64 (8.1%) | 0 (0.0%) |
| $50,000 to $54,999 | 44 (5.6%) | 25 (2.4%) |
| $55,000 to $64,999 | 73 (9.2%) | 301 (29.2%) |
| $65,000 to $74,999 | 20 (2.5%) | 20 (1.9%) |
| $75,000 to $99,999 | 210 (26.6%) | 169 (16.4%) |
| $100,000+ | 115 (14.6%) | 67 (6.5%) |
| Total | 789 (100.0%) | 1,029 (100.0%) |
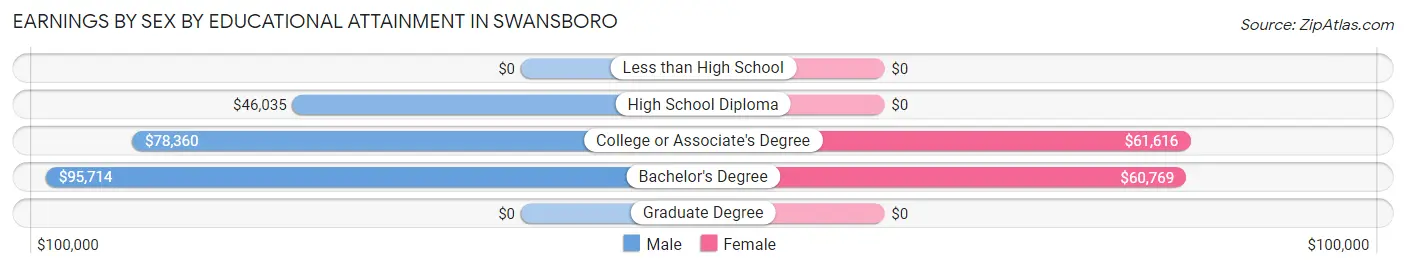
Earnings by Sex by Educational Attainment in Swansboro
Average earnings in Swansboro are $64,384 for men and $60,489 for women, a difference of 6.0%. Men with an educational attainment of bachelor's degree enjoy the highest average annual earnings of $95,714, while those with high school diploma education earn the least with $46,035. Women with an educational attainment of college or associate's degree earn the most with the average annual earnings of $61,616, while those with bachelor's degree education have the smallest earnings of $60,769.
| Educational Attainment | Male Income | Female Income |
| Less than High School | - | - |
| High School Diploma | $46,035 | $0 |
| College or Associate's Degree | $78,360 | $61,616 |
| Bachelor's Degree | $95,714 | $60,769 |
| Graduate Degree | - | - |
| Total | $64,384 | $60,489 |
Family Income in Swansboro
Family Income Brackets in Swansboro
According to the Swansboro family income data, there are 378 families falling into the $150,000 to $199,999 income range, which is the most common income bracket and makes up 34.3% of all families. Conversely, the $10,000 to $14,999 income bracket is the least frequent group with only 13 families (1.2%) belonging to this category.
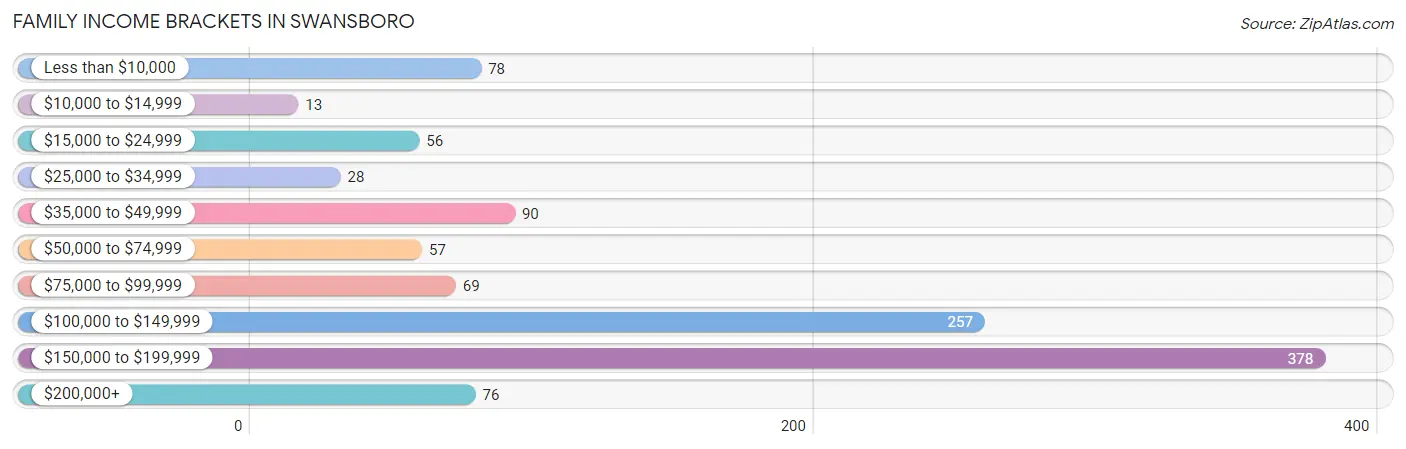
| Income Bracket | # Families | % Families |
| Less than $10,000 | 78 | 7.1% |
| $10,000 to $14,999 | 13 | 1.2% |
| $15,000 to $24,999 | 56 | 5.1% |
| $25,000 to $34,999 | 28 | 2.5% |
| $35,000 to $49,999 | 90 | 8.2% |
| $50,000 to $74,999 | 57 | 5.2% |
| $75,000 to $99,999 | 69 | 6.3% |
| $100,000 to $149,999 | 257 | 23.3% |
| $150,000 to $199,999 | 378 | 34.3% |
| $200,000+ | 76 | 6.9% |
Family Income by Famaliy Size in Swansboro
2-person families (620 | 56.3%) account for the highest median family income in Swansboro with $160,098 per family, while 2-person families (620 | 56.3%) have the highest median income of $80,049 per family member.
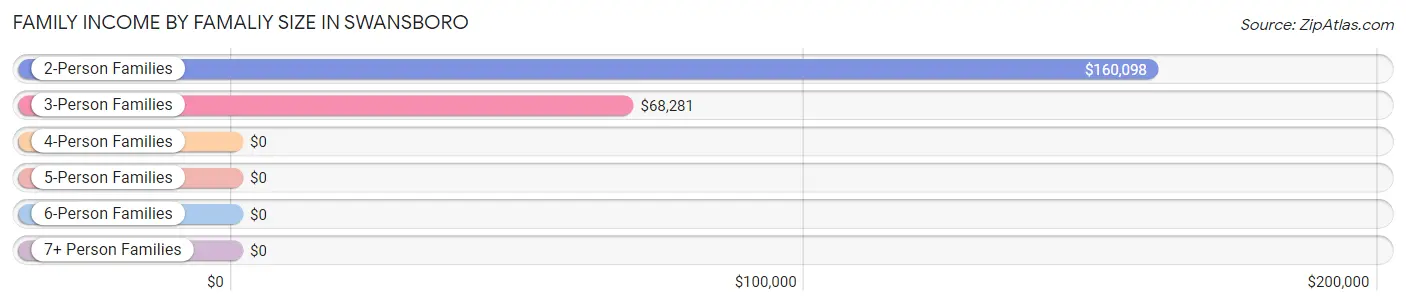
| Income Bracket | # Families | Median Income |
| 2-Person Families | 620 (56.3%) | $160,098 |
| 3-Person Families | 187 (17.0%) | $68,281 |
| 4-Person Families | 111 (10.1%) | $0 |
| 5-Person Families | 146 (13.3%) | $0 |
| 6-Person Families | 37 (3.4%) | $0 |
| 7+ Person Families | 0 (0.0%) | $0 |
| Total | 1,101 (100.0%) | $113,384 |
Family Income by Number of Earners in Swansboro
The median family income in Swansboro is $113,384, with families comprising 1 earner (266) having the highest median family income of $160,669, while families with no earners (232) have the lowest median family income of $22,578, accounting for 24.2% and 21.1% of families, respectively.
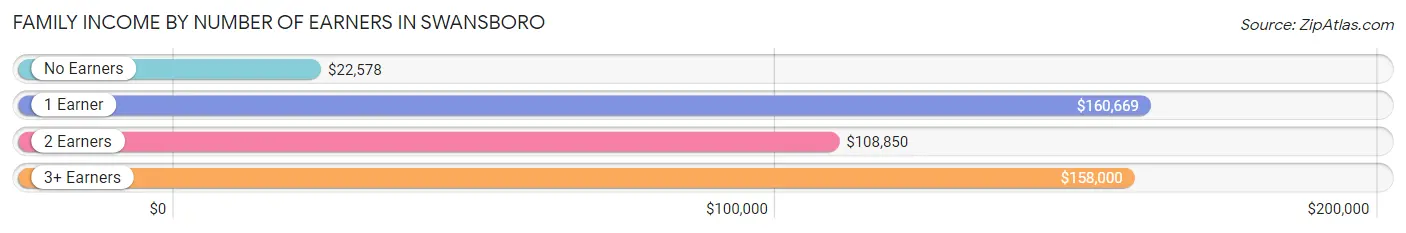
| Number of Earners | # Families | Median Income |
| No Earners | 232 (21.1%) | $22,578 |
| 1 Earner | 266 (24.2%) | $160,669 |
| 2 Earners | 469 (42.6%) | $108,850 |
| 3+ Earners | 134 (12.2%) | $158,000 |
| Total | 1,101 (100.0%) | $113,384 |
Household Income in Swansboro
Household Income Brackets in Swansboro
With 379 households falling in the category, the $150,000 to $199,999 income range is the most frequent in Swansboro, accounting for 26.6% of all households. In contrast, only 75 households (5.3%) fall into the $200,000+ income bracket, making it the least populous group.
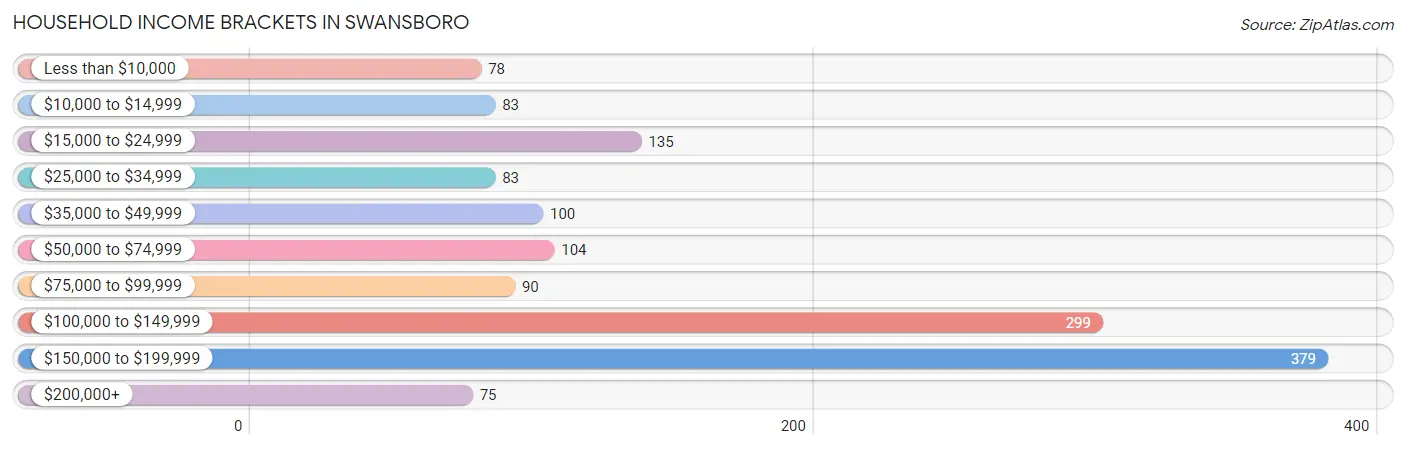
| Income Bracket | # Households | % Households |
| Less than $10,000 | 78 | 5.5% |
| $10,000 to $14,999 | 83 | 5.8% |
| $15,000 to $24,999 | 135 | 9.5% |
| $25,000 to $34,999 | 83 | 5.8% |
| $35,000 to $49,999 | 100 | 7.0% |
| $50,000 to $74,999 | 104 | 7.3% |
| $75,000 to $99,999 | 90 | 6.3% |
| $100,000 to $149,999 | 299 | 21.0% |
| $150,000 to $199,999 | 379 | 26.6% |
| $200,000+ | 75 | 5.3% |
Household Income by Householder Age in Swansboro
The median household income in Swansboro is $105,779, with the highest median household income of $109,950 found in the 45 to 64 years age bracket for the primary householder. A total of 445 households (31.3%) fall into this category.
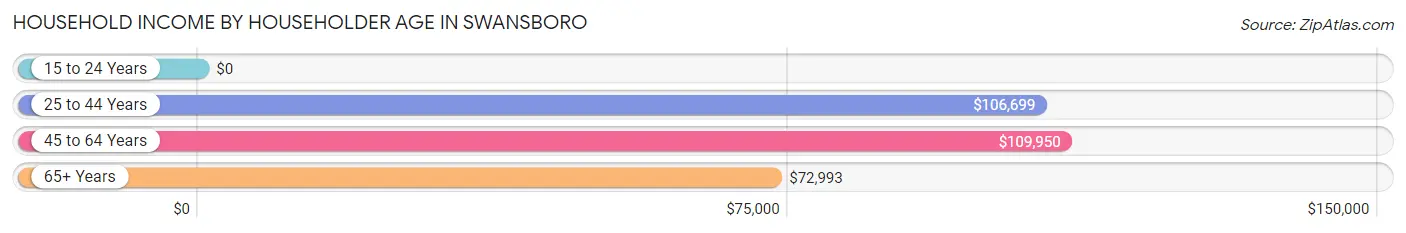
| Income Bracket | # Households | Median Income |
| 15 to 24 Years | 0 (0.0%) | $0 |
| 25 to 44 Years | 483 (33.9%) | $106,699 |
| 45 to 64 Years | 445 (31.3%) | $109,950 |
| 65+ Years | 495 (34.8%) | $72,993 |
| Total | 1,423 (100.0%) | $105,779 |
Poverty in Swansboro
Income Below Poverty by Sex and Age in Swansboro
With 10.8% poverty level for males and 16.5% for females among the residents of Swansboro, 6 to 11 year old males and under 5 year old females are the most vulnerable to poverty, with 104 males (62.3%) and 82 females (54.3%) in their respective age groups living below the poverty level.
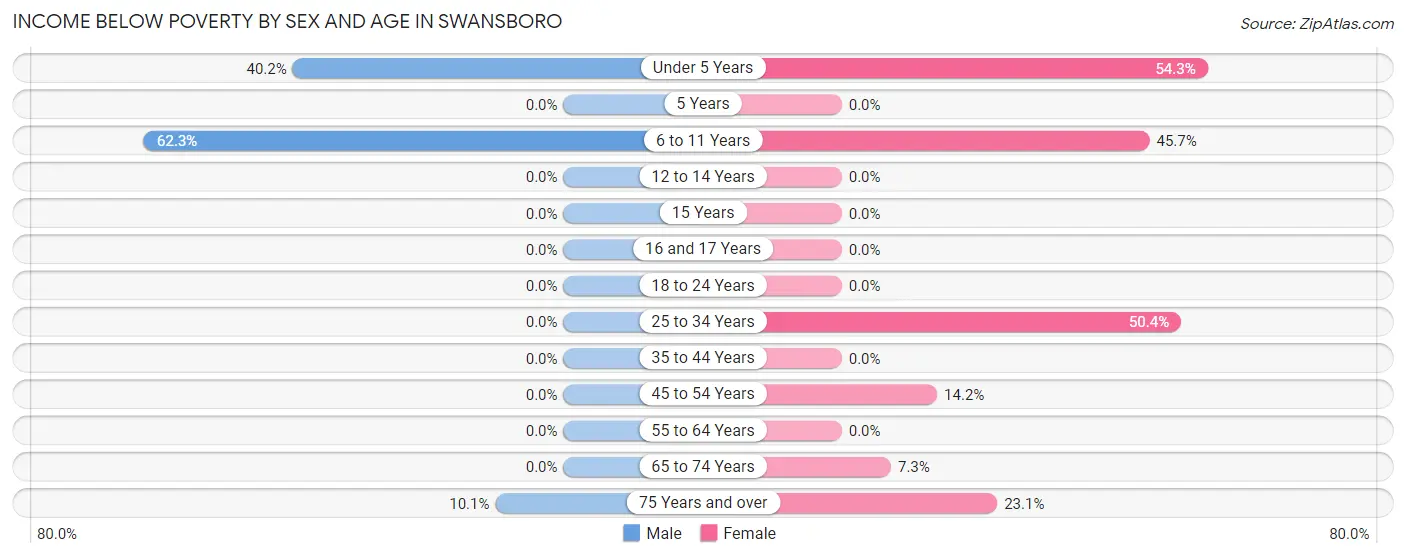
| Age Bracket | Male | Female |
| Under 5 Years | 78 (40.2%) | 82 (54.3%) |
| 5 Years | 0 (0.0%) | 0 (0.0%) |
| 6 to 11 Years | 104 (62.3%) | 85 (45.7%) |
| 12 to 14 Years | 0 (0.0%) | 0 (0.0%) |
| 15 Years | 0 (0.0%) | 0 (0.0%) |
| 16 and 17 Years | 0 (0.0%) | 0 (0.0%) |
| 18 to 24 Years | 0 (0.0%) | 0 (0.0%) |
| 25 to 34 Years | 0 (0.0%) | 69 (50.4%) |
| 35 to 44 Years | 0 (0.0%) | 0 (0.0%) |
| 45 to 54 Years | 0 (0.0%) | 32 (14.2%) |
| 55 to 64 Years | 0 (0.0%) | 0 (0.0%) |
| 65 to 74 Years | 0 (0.0%) | 25 (7.3%) |
| 75 Years and over | 9 (10.1%) | 36 (23.1%) |
| Total | 191 (10.8%) | 329 (16.5%) |
Income Above Poverty by Sex and Age in Swansboro
According to the poverty statistics in Swansboro, males aged 12 to 14 years and females aged 5 years are the age groups that are most secure financially, with 100.0% of males and 100.0% of females in these age groups living above the poverty line.
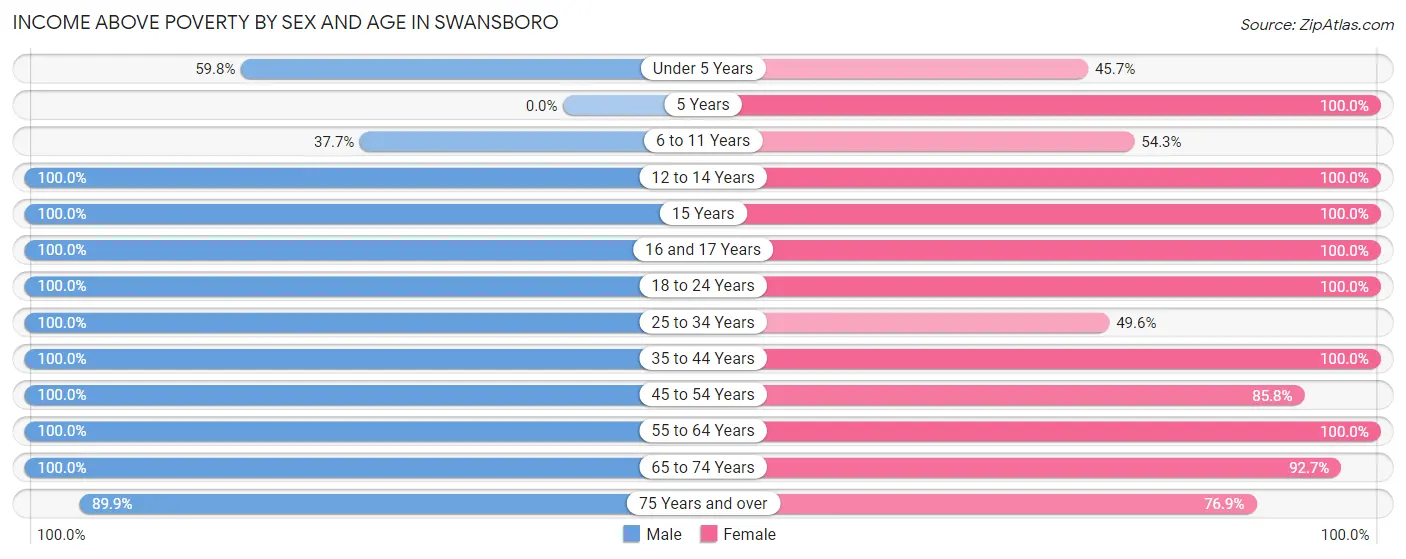
| Age Bracket | Male | Female |
| Under 5 Years | 116 (59.8%) | 69 (45.7%) |
| 5 Years | 0 (0.0%) | 79 (100.0%) |
| 6 to 11 Years | 63 (37.7%) | 101 (54.3%) |
| 12 to 14 Years | 166 (100.0%) | 15 (100.0%) |
| 15 Years | 39 (100.0%) | 32 (100.0%) |
| 16 and 17 Years | 69 (100.0%) | 135 (100.0%) |
| 18 to 24 Years | 36 (100.0%) | 78 (100.0%) |
| 25 to 34 Years | 97 (100.0%) | 68 (49.6%) |
| 35 to 44 Years | 252 (100.0%) | 319 (100.0%) |
| 45 to 54 Years | 240 (100.0%) | 194 (85.8%) |
| 55 to 64 Years | 204 (100.0%) | 141 (100.0%) |
| 65 to 74 Years | 209 (100.0%) | 317 (92.7%) |
| 75 Years and over | 80 (89.9%) | 120 (76.9%) |
| Total | 1,571 (89.2%) | 1,668 (83.5%) |
Income Below Poverty Among Married-Couple Families in Swansboro
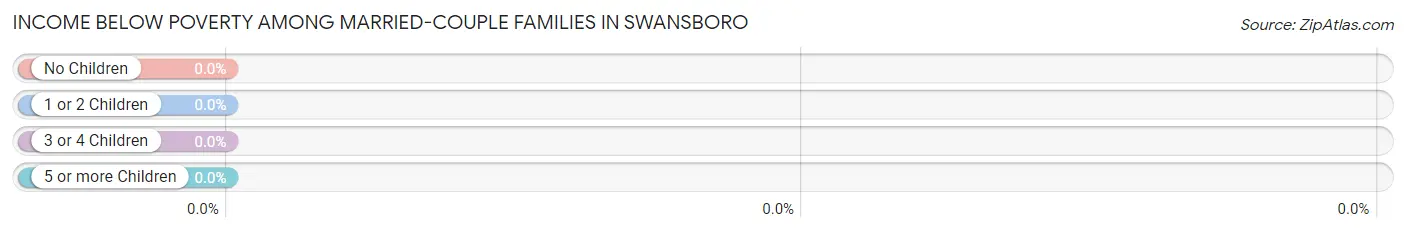
| Children | Above Poverty | Below Poverty |
| No Children | 491 (100.0%) | 0 (0.0%) |
| 1 or 2 Children | 243 (100.0%) | 0 (0.0%) |
| 3 or 4 Children | 89 (100.0%) | 0 (0.0%) |
| 5 or more Children | 0 (0.0%) | 0 (0.0%) |
| Total | 823 (100.0%) | 0 (0.0%) |
Income Below Poverty Among Single-Parent Households in Swansboro
According to the poverty data in Swansboro, 15.8% or 9 single-father households and 37.1% or 82 single-mother households are living below the poverty line. Among single-father households, those with no children have the highest poverty rate, with 9 households (29.0%) experiencing poverty. Likewise, among single-mother households, those with 3 or 4 children have the highest poverty rate, with 69 households (100.0%) falling below the poverty line.
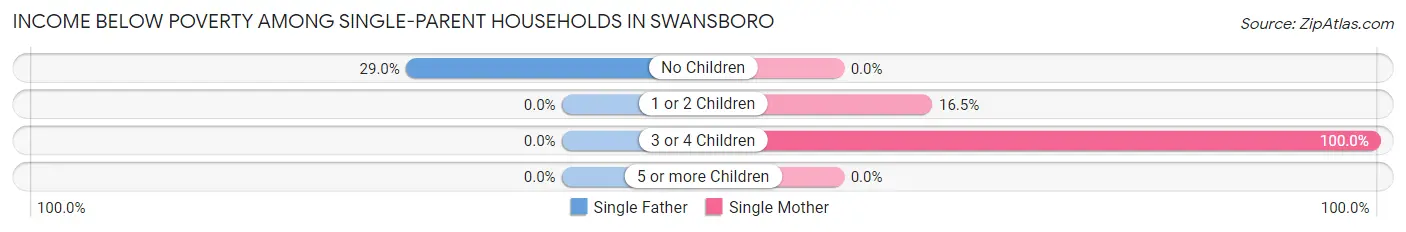
| Children | Single Father | Single Mother |
| No Children | 9 (29.0%) | 0 (0.0%) |
| 1 or 2 Children | 0 (0.0%) | 13 (16.5%) |
| 3 or 4 Children | 0 (0.0%) | 69 (100.0%) |
| 5 or more Children | 0 (0.0%) | 0 (0.0%) |
| Total | 9 (15.8%) | 82 (37.1%) |
Income Below Poverty Among Married-Couple vs Single-Parent Households in Swansboro
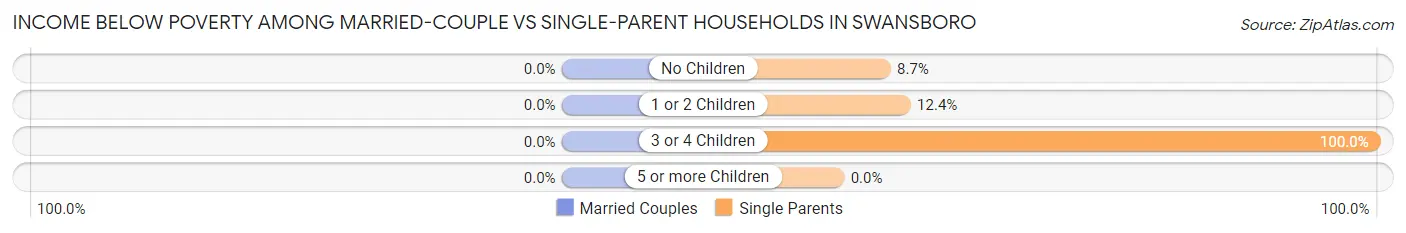
| Children | Married-Couple Families | Single-Parent Households |
| No Children | 0 (0.0%) | 9 (8.6%) |
| 1 or 2 Children | 0 (0.0%) | 13 (12.4%) |
| 3 or 4 Children | 0 (0.0%) | 69 (100.0%) |
| 5 or more Children | 0 (0.0%) | 0 (0.0%) |
| Total | 0 (0.0%) | 91 (32.7%) |
Race in Swansboro
The most populous races in Swansboro are White / Caucasian (3,212 | 85.5%), Two or more Races (423 | 11.3%), and Hispanic or Latino (255 | 6.8%).
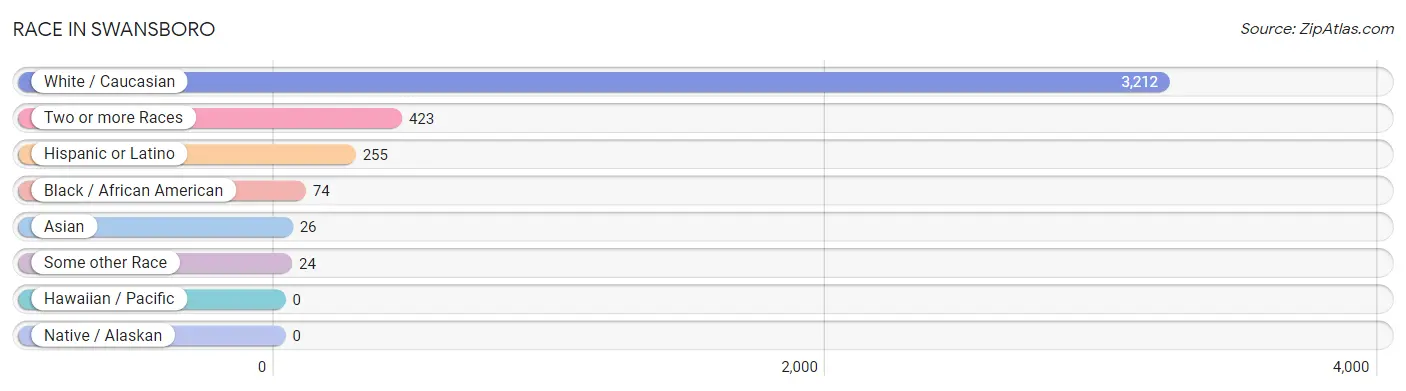
| Race | # Population | % Population |
| Asian | 26 | 0.7% |
| Black / African American | 74 | 2.0% |
| Hawaiian / Pacific | 0 | 0.0% |
| Hispanic or Latino | 255 | 6.8% |
| Native / Alaskan | 0 | 0.0% |
| White / Caucasian | 3,212 | 85.5% |
| Two or more Races | 423 | 11.3% |
| Some other Race | 24 | 0.6% |
| Total | 3,759 | 100.0% |
Ancestry in Swansboro
The most populous ancestries reported in Swansboro are English (739 | 19.7%), German (594 | 15.8%), Irish (256 | 6.8%), Scottish (244 | 6.5%), and American (238 | 6.3%), together accounting for 55.1% of all Swansboro residents.
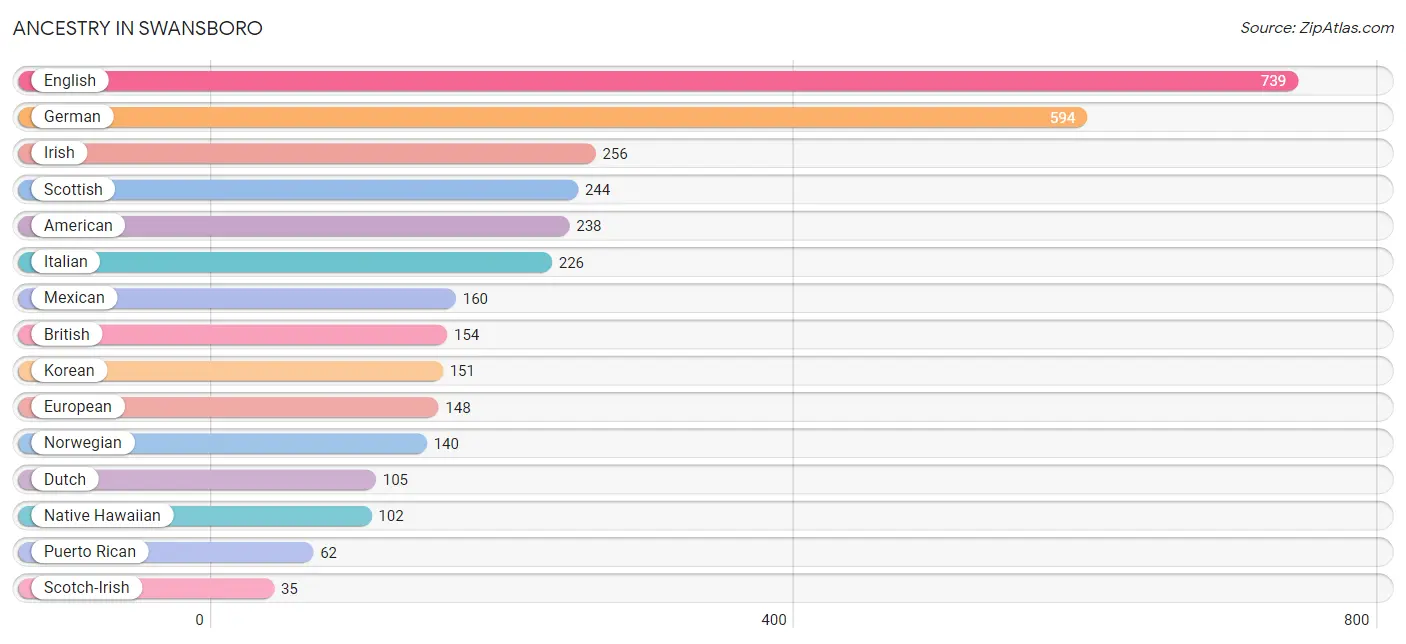
| Ancestry | # Population | % Population |
| American | 238 | 6.3% |
| British | 154 | 4.1% |
| Cuban | 14 | 0.4% |
| Czech | 21 | 0.6% |
| Danish | 21 | 0.6% |
| Dominican | 19 | 0.5% |
| Dutch | 105 | 2.8% |
| English | 739 | 19.7% |
| European | 148 | 3.9% |
| French | 10 | 0.3% |
| French Canadian | 9 | 0.2% |
| German | 594 | 15.8% |
| Greek | 21 | 0.6% |
| Hungarian | 15 | 0.4% |
| Indian (Asian) | 16 | 0.4% |
| Irish | 256 | 6.8% |
| Italian | 226 | 6.0% |
| Korean | 151 | 4.0% |
| Mexican | 160 | 4.3% |
| Native Hawaiian | 102 | 2.7% |
| Norwegian | 140 | 3.7% |
| Polish | 20 | 0.5% |
| Puerto Rican | 62 | 1.7% |
| Scandinavian | 8 | 0.2% |
| Scotch-Irish | 35 | 0.9% |
| Scottish | 244 | 6.5% | View All 26 Rows |
Immigrants in Swansboro
The most numerous immigrant groups reported in Swansboro came from Europe (85 | 2.3%), Northern Europe (85 | 2.3%), Asia (73 | 1.9%), Philippines (48 | 1.3%), and South Eastern Asia (48 | 1.3%), together accounting for 9.0% of all Swansboro residents.
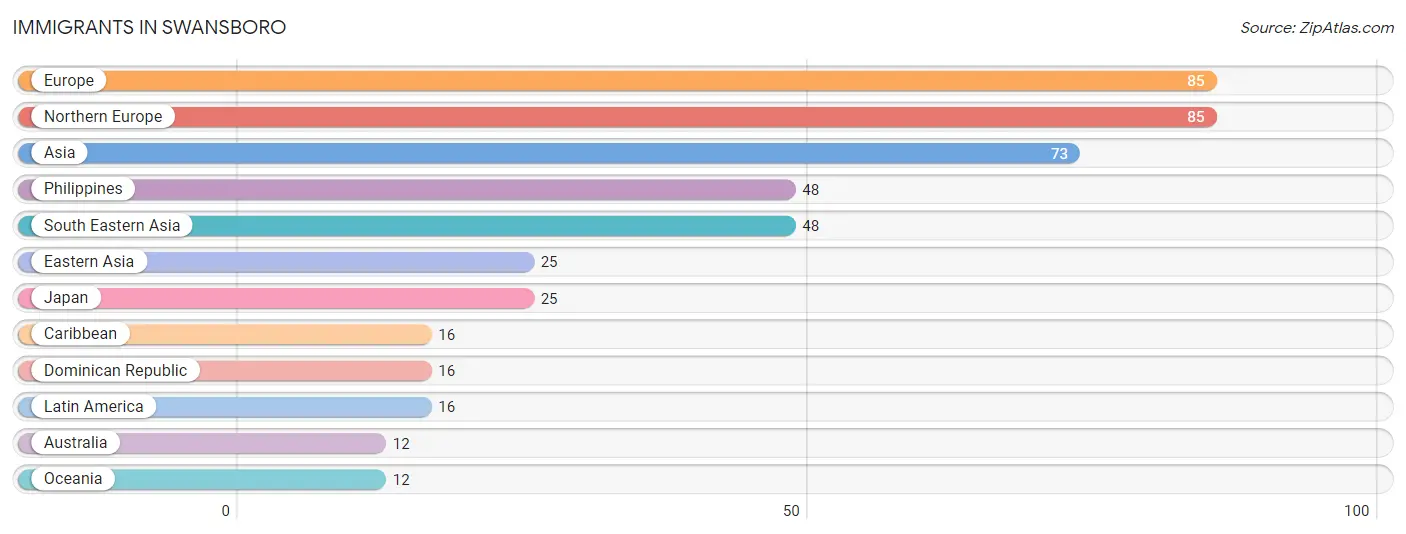
| Immigration Origin | # Population | % Population |
| Asia | 73 | 1.9% |
| Australia | 12 | 0.3% |
| Caribbean | 16 | 0.4% |
| Dominican Republic | 16 | 0.4% |
| Eastern Asia | 25 | 0.7% |
| Europe | 85 | 2.3% |
| Japan | 25 | 0.7% |
| Latin America | 16 | 0.4% |
| Northern Europe | 85 | 2.3% |
| Oceania | 12 | 0.3% |
| Philippines | 48 | 1.3% |
| South Eastern Asia | 48 | 1.3% | View All 12 Rows |
Sex and Age in Swansboro
Sex and Age in Swansboro
The most populous age groups in Swansboro are 35 to 39 Years (215 | 12.2%) for men and 65 to 69 Years (250 | 12.5%) for women.
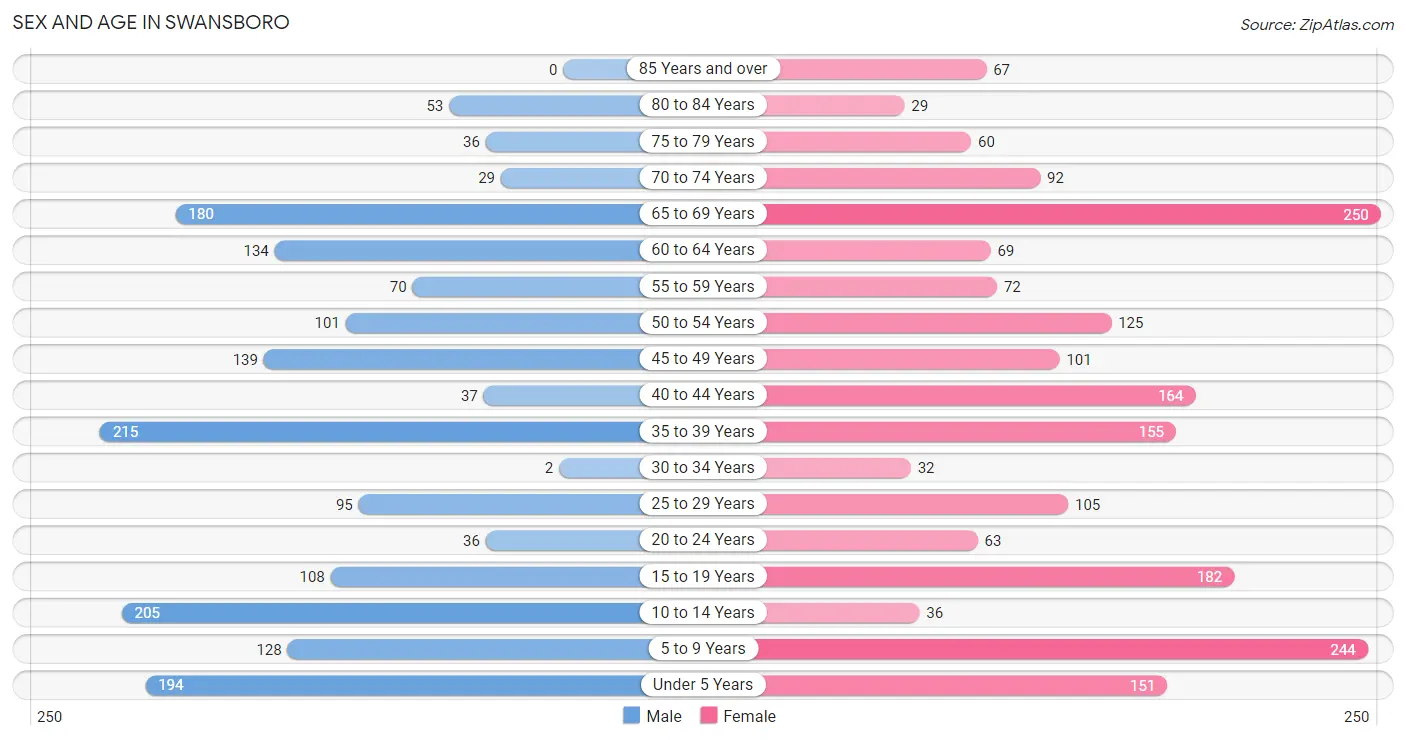
| Age Bracket | Male | Female |
| Under 5 Years | 194 (11.0%) | 151 (7.6%) |
| 5 to 9 Years | 128 (7.3%) | 244 (12.2%) |
| 10 to 14 Years | 205 (11.6%) | 36 (1.8%) |
| 15 to 19 Years | 108 (6.1%) | 182 (9.1%) |
| 20 to 24 Years | 36 (2.0%) | 63 (3.2%) |
| 25 to 29 Years | 95 (5.4%) | 105 (5.3%) |
| 30 to 34 Years | 2 (0.1%) | 32 (1.6%) |
| 35 to 39 Years | 215 (12.2%) | 155 (7.8%) |
| 40 to 44 Years | 37 (2.1%) | 164 (8.2%) |
| 45 to 49 Years | 139 (7.9%) | 101 (5.1%) |
| 50 to 54 Years | 101 (5.7%) | 125 (6.3%) |
| 55 to 59 Years | 70 (4.0%) | 72 (3.6%) |
| 60 to 64 Years | 134 (7.6%) | 69 (3.5%) |
| 65 to 69 Years | 180 (10.2%) | 250 (12.5%) |
| 70 to 74 Years | 29 (1.7%) | 92 (4.6%) |
| 75 to 79 Years | 36 (2.0%) | 60 (3.0%) |
| 80 to 84 Years | 53 (3.0%) | 29 (1.5%) |
| 85 Years and over | 0 (0.0%) | 67 (3.4%) |
| Total | 1,762 (100.0%) | 1,997 (100.0%) |
Families and Households in Swansboro
Median Family Size in Swansboro
The median family size in Swansboro is 3.06 persons per family, with single female/mother families (221 | 20.1%) accounting for the largest median family size of 3.16 persons per family. On the other hand, single male/father families (57 | 5.2%) represent the smallest median family size with 2.49 persons per family.
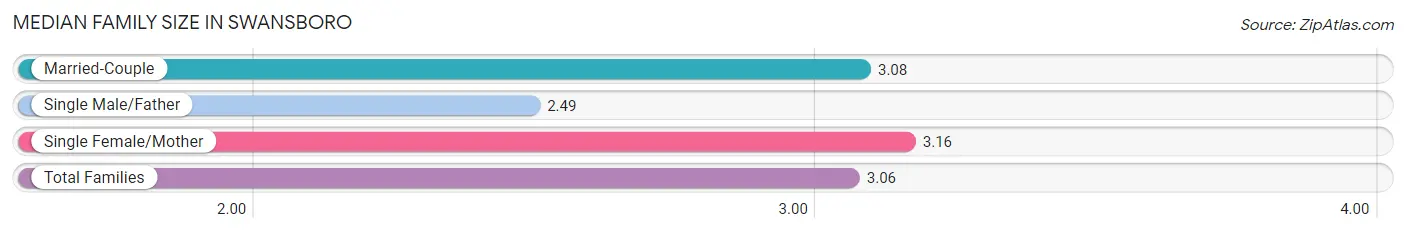
| Family Type | # Families | Family Size |
| Married-Couple | 823 (74.8%) | 3.08 |
| Single Male/Father | 57 (5.2%) | 2.49 |
| Single Female/Mother | 221 (20.1%) | 3.16 |
| Total Families | 1,101 (100.0%) | 3.06 |
Median Household Size in Swansboro
The median household size in Swansboro is 2.64 persons per household, with single female/mother households (221 | 15.5%) accounting for the largest median household size of 3.16 persons per household. non-family households (322 | 22.6%) represent the smallest median household size with 1.11 persons per household.
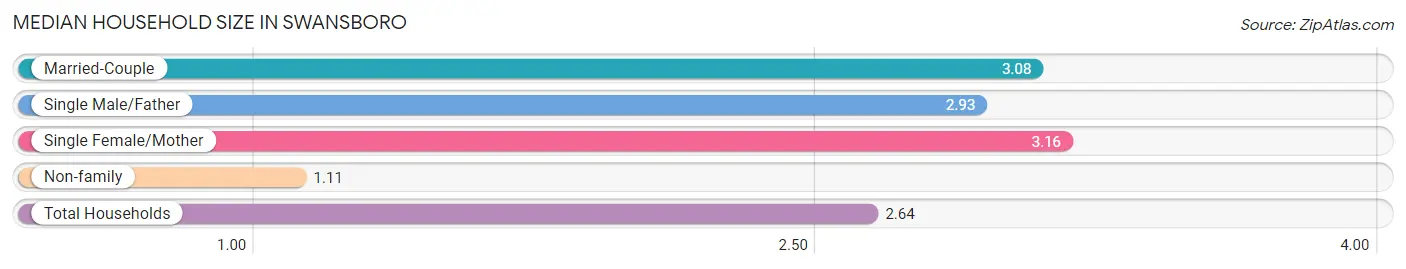
| Household Type | # Households | Household Size |
| Married-Couple | 823 (57.8%) | 3.08 |
| Single Male/Father | 57 (4.0%) | 2.93 |
| Single Female/Mother | 221 (15.5%) | 3.16 |
| Non-family | 322 (22.6%) | 1.11 |
| Total Households | 1,423 (100.0%) | 2.64 |
Household Size by Marriage Status in Swansboro
Out of a total of 1,423 households in Swansboro, 1,101 (77.4%) are family households, while 322 (22.6%) are nonfamily households. The most numerous type of family households are 2-person households, comprising 620, and the most common type of nonfamily households are 1-person households, comprising 279.
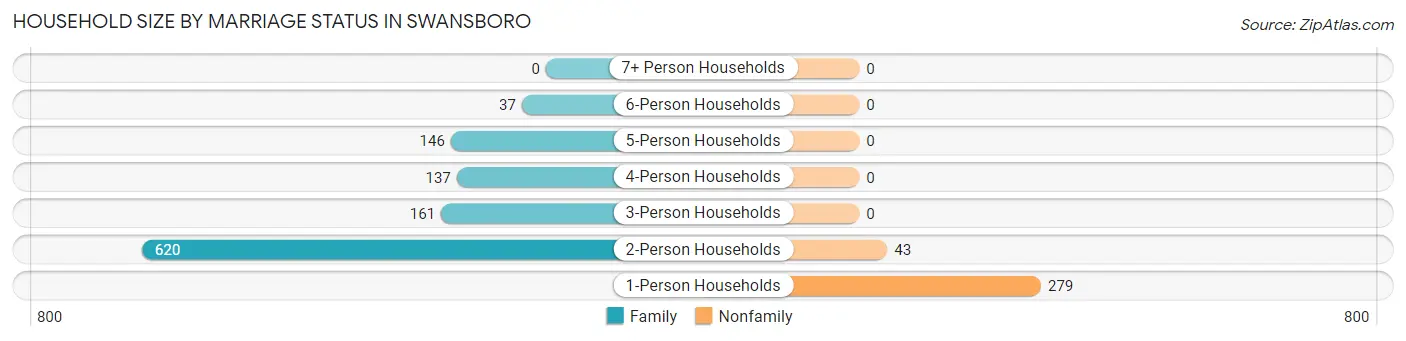
| Household Size | Family Households | Nonfamily Households |
| 1-Person Households | - | 279 (19.6%) |
| 2-Person Households | 620 (43.6%) | 43 (3.0%) |
| 3-Person Households | 161 (11.3%) | 0 (0.0%) |
| 4-Person Households | 137 (9.6%) | 0 (0.0%) |
| 5-Person Households | 146 (10.3%) | 0 (0.0%) |
| 6-Person Households | 37 (2.6%) | 0 (0.0%) |
| 7+ Person Households | 0 (0.0%) | 0 (0.0%) |
| Total | 1,101 (77.4%) | 322 (22.6%) |
Female Fertility in Swansboro
Fertility by Age in Swansboro
| Age Bracket | Women with Births | Births / 1,000 Women |
| 15 to 19 years | 0 (0.0%) | 0.0 |
| 20 to 34 years | 0 (0.0%) | 0.0 |
| 35 to 50 years | 0 (0.0%) | 0.0 |
| Total | 0 (0.0%) | 0.0 |
Fertility by Age by Marriage Status in Swansboro
| Age Bracket | Married | Unmarried |
| 15 to 19 years | 0 (0.0%) | 0 (0.0%) |
| 20 to 34 years | 0 (0.0%) | 0 (0.0%) |
| 35 to 50 years | 0 (0.0%) | 0 (0.0%) |
| Total | 0 (0.0%) | 0 (0.0%) |
Fertility by Education in Swansboro
| Educational Attainment | Women with Births | Births / 1,000 Women |
| Less than High School | 0 (0.0%) | 0.0 |
| High School Diploma | 0 (0.0%) | 0.0 |
| College or Associate's Degree | 0 (0.0%) | 0.0 |
| Bachelor's Degree | 0 (0.0%) | 0.0 |
| Graduate Degree | 0 (0.0%) | 0.0 |
| Total | 0 (0.0%) | 0.0 |
Fertility by Education by Marriage Status in Swansboro
| Educational Attainment | Married | Unmarried |
| Less than High School | 0 (0.0%) | 0 (0.0%) |
| High School Diploma | 0 (0.0%) | 0 (0.0%) |
| College or Associate's Degree | 0 (0.0%) | 0 (0.0%) |
| Bachelor's Degree | 0 (0.0%) | 0 (0.0%) |
| Graduate Degree | 0 (0.0%) | 0 (0.0%) |
| Total | 0 (0.0%) | 0 (0.0%) |
Employment Characteristics in Swansboro
Employment by Class of Employer in Swansboro
Among the 1,641 employed individuals in Swansboro, private company employees (707 | 43.1%), federal government employees (374 | 22.8%), and local government employees (238 | 14.5%) make up the most common classes of employment.
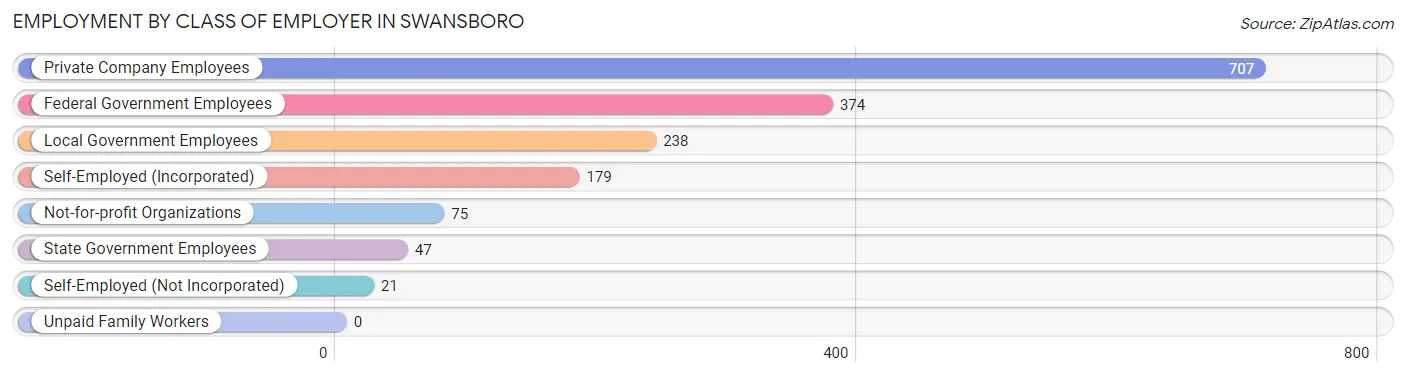
| Employer Class | # Employees | % Employees |
| Private Company Employees | 707 | 43.1% |
| Self-Employed (Incorporated) | 179 | 10.9% |
| Self-Employed (Not Incorporated) | 21 | 1.3% |
| Not-for-profit Organizations | 75 | 4.6% |
| Local Government Employees | 238 | 14.5% |
| State Government Employees | 47 | 2.9% |
| Federal Government Employees | 374 | 22.8% |
| Unpaid Family Workers | 0 | 0.0% |
| Total | 1,641 | 100.0% |
Employment Status by Age in Swansboro
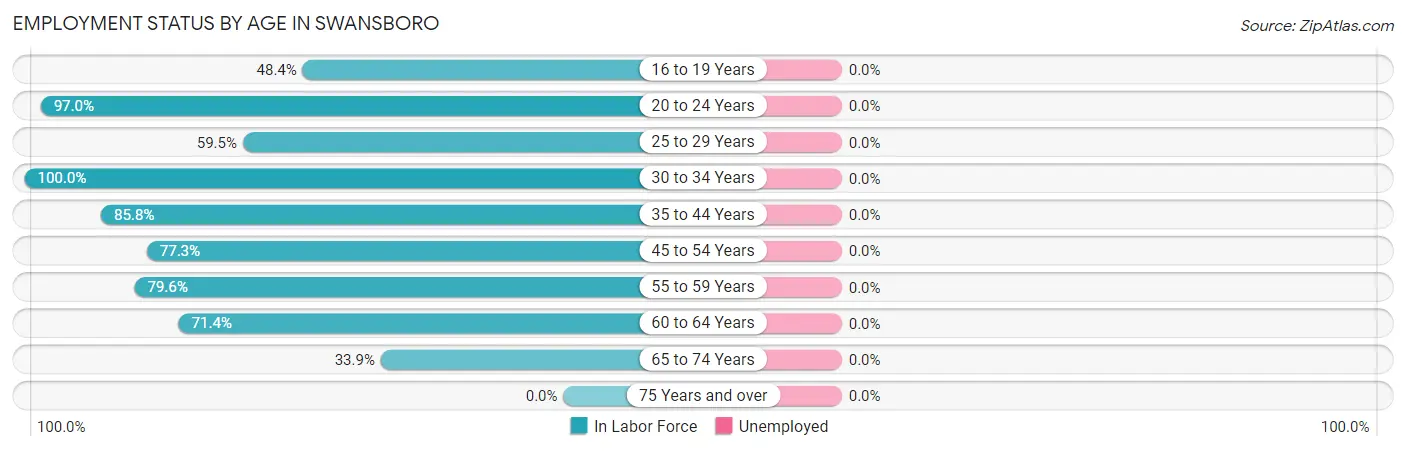
| Age Bracket | In Labor Force | Unemployed |
| 16 to 19 Years | 106 (48.4%) | 0 (0.0%) |
| 20 to 24 Years | 96 (97.0%) | 0 (0.0%) |
| 25 to 29 Years | 119 (59.5%) | 0 (0.0%) |
| 30 to 34 Years | 34 (100.0%) | 0 (0.0%) |
| 35 to 44 Years | 490 (85.8%) | 0 (0.0%) |
| 45 to 54 Years | 360 (77.3%) | 0 (0.0%) |
| 55 to 59 Years | 113 (79.6%) | 0 (0.0%) |
| 60 to 64 Years | 145 (71.4%) | 0 (0.0%) |
| 65 to 74 Years | 187 (33.9%) | 0 (0.0%) |
| 75 Years and over | 0 (0.0%) | 0 (0.0%) |
| Total | 1,649 (60.4%) | 0 (0.0%) |
Employment Status by Educational Attainment in Swansboro
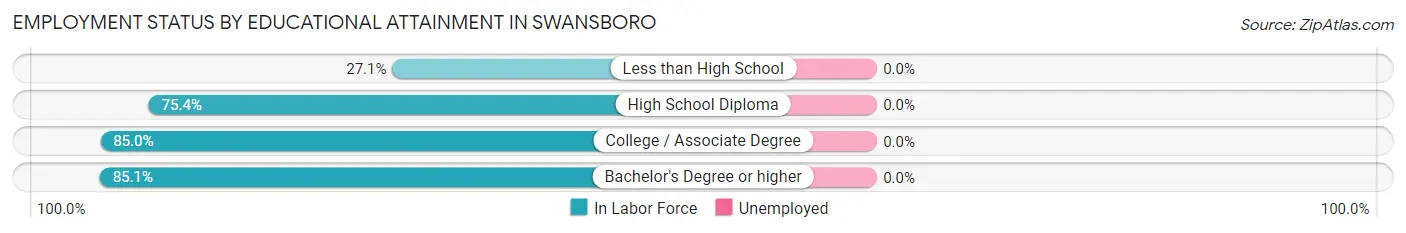
| Educational Attainment | In Labor Force | Unemployed |
| Less than High School | 35 (27.1%) | 0 (0.0%) |
| High School Diploma | 301 (75.4%) | 0 (0.0%) |
| College / Associate Degree | 401 (85.0%) | 0 (0.0%) |
| Bachelor's Degree or higher | 524 (85.1%) | 0 (0.0%) |
| Total | 1,260 (78.0%) | 0 (0.0%) |
Employment Occupations by Sex in Swansboro
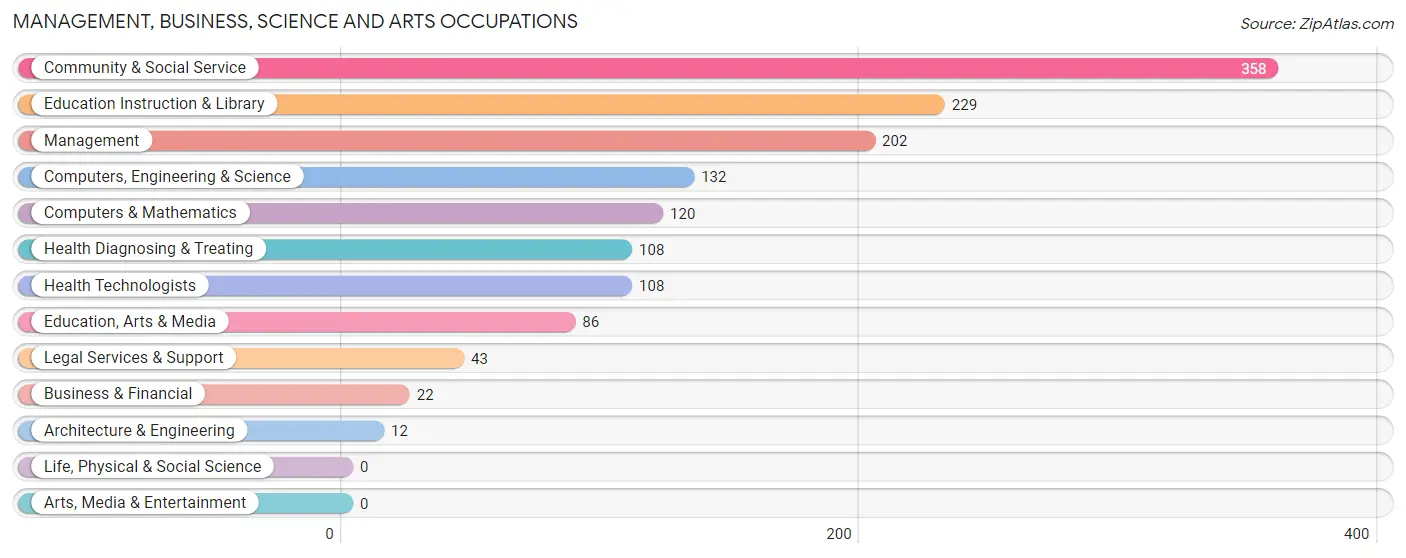
Management, Business, Science and Arts Occupations
The most common Management, Business, Science and Arts occupations in Swansboro are Community & Social Service (358 | 25.3%), Education Instruction & Library (229 | 16.2%), Management (202 | 14.3%), Computers, Engineering & Science (132 | 9.3%), and Computers & Mathematics (120 | 8.5%).
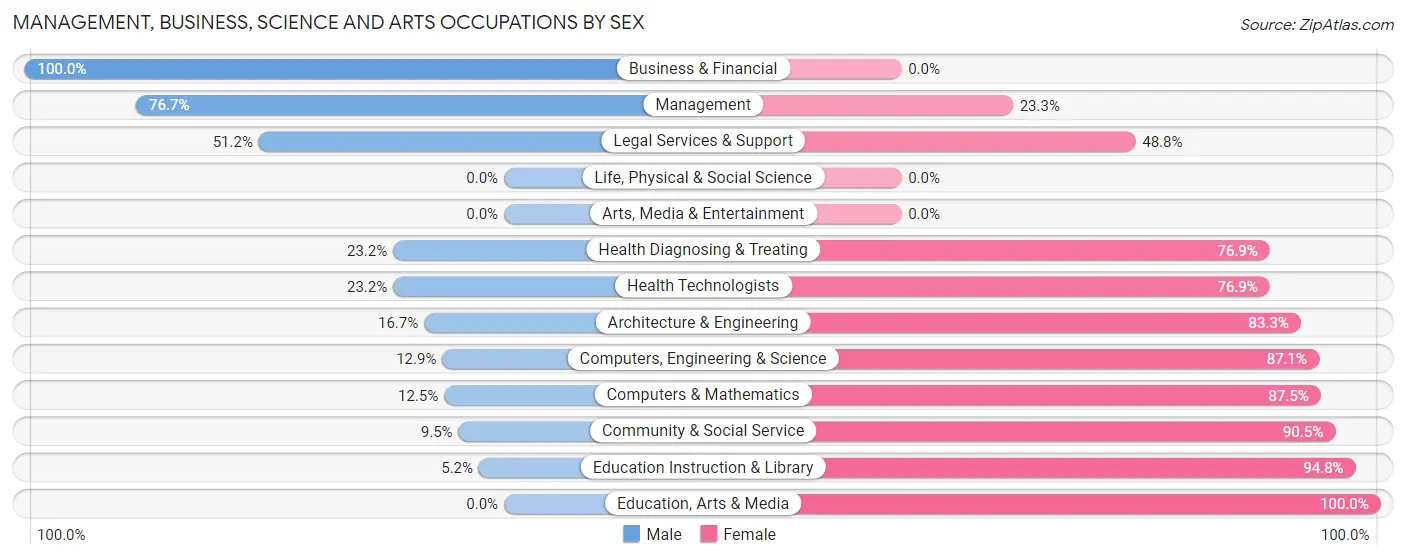
Management, Business, Science and Arts Occupations by Sex
Within the Management, Business, Science and Arts occupations in Swansboro, the most male-oriented occupations are Business & Financial (100.0%), Management (76.7%), and Legal Services & Support (51.2%), while the most female-oriented occupations are Education, Arts & Media (100.0%), Education Instruction & Library (94.8%), and Community & Social Service (90.5%).
| Occupation | Male | Female |
| Management | 155 (76.7%) | 47 (23.3%) |
| Business & Financial | 22 (100.0%) | 0 (0.0%) |
| Computers, Engineering & Science | 17 (12.9%) | 115 (87.1%) |
| Computers & Mathematics | 15 (12.5%) | 105 (87.5%) |
| Architecture & Engineering | 2 (16.7%) | 10 (83.3%) |
| Life, Physical & Social Science | 0 (0.0%) | 0 (0.0%) |
| Community & Social Service | 34 (9.5%) | 324 (90.5%) |
| Education, Arts & Media | 0 (0.0%) | 86 (100.0%) |
| Legal Services & Support | 22 (51.2%) | 21 (48.8%) |
| Education Instruction & Library | 12 (5.2%) | 217 (94.8%) |
| Arts, Media & Entertainment | 0 (0.0%) | 0 (0.0%) |
| Health Diagnosing & Treating | 25 (23.2%) | 83 (76.8%) |
| Health Technologists | 25 (23.2%) | 83 (76.8%) |
| Total (Category) | 253 (30.8%) | 569 (69.2%) |
| Total (Overall) | 583 (41.1%) | 834 (58.9%) |
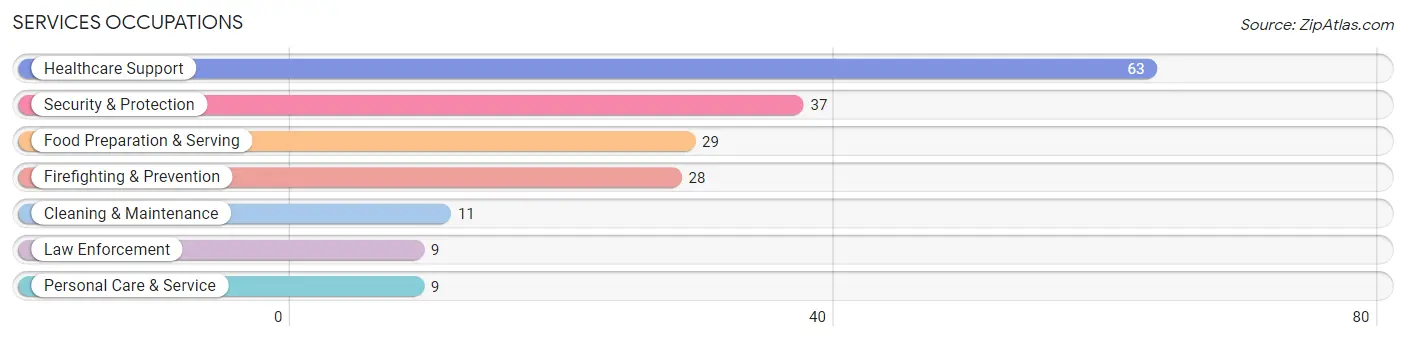
Services Occupations
The most common Services occupations in Swansboro are Healthcare Support (63 | 4.4%), Security & Protection (37 | 2.6%), Food Preparation & Serving (29 | 2.1%), Firefighting & Prevention (28 | 2.0%), and Cleaning & Maintenance (11 | 0.8%).
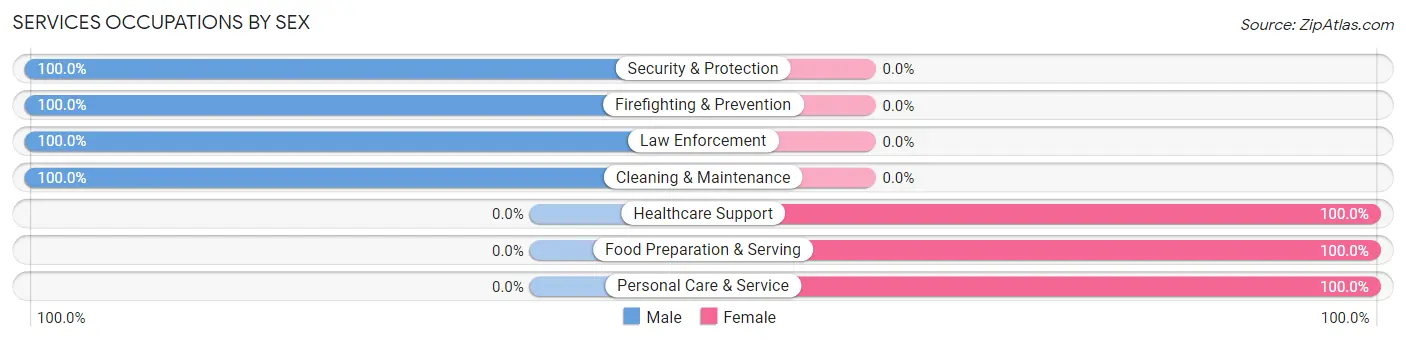
Services Occupations by Sex
Within the Services occupations in Swansboro, the most male-oriented occupations are Security & Protection (100.0%), Firefighting & Prevention (100.0%), and Law Enforcement (100.0%), while the most female-oriented occupations are Healthcare Support (100.0%), Food Preparation & Serving (100.0%), and Personal Care & Service (100.0%).
| Occupation | Male | Female |
| Healthcare Support | 0 (0.0%) | 63 (100.0%) |
| Security & Protection | 37 (100.0%) | 0 (0.0%) |
| Firefighting & Prevention | 28 (100.0%) | 0 (0.0%) |
| Law Enforcement | 9 (100.0%) | 0 (0.0%) |
| Food Preparation & Serving | 0 (0.0%) | 29 (100.0%) |
| Cleaning & Maintenance | 11 (100.0%) | 0 (0.0%) |
| Personal Care & Service | 0 (0.0%) | 9 (100.0%) |
| Total (Category) | 48 (32.2%) | 101 (67.8%) |
| Total (Overall) | 583 (41.1%) | 834 (58.9%) |
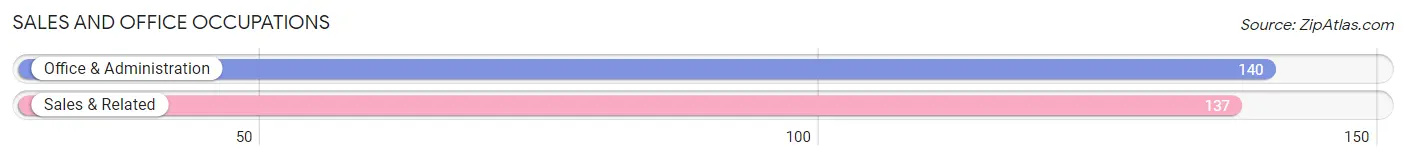
Sales and Office Occupations
The most common Sales and Office occupations in Swansboro are Office & Administration (140 | 9.9%), and Sales & Related (137 | 9.7%).
Sales and Office Occupations by Sex
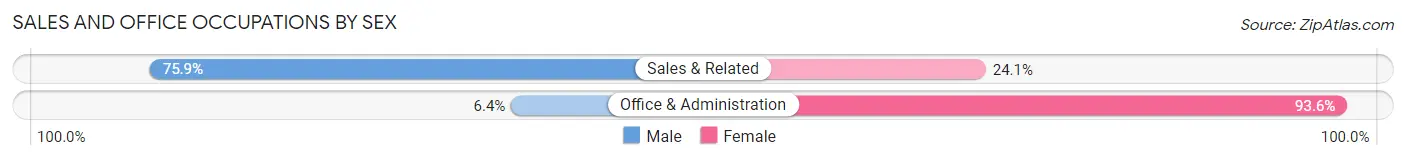
| Occupation | Male | Female |
| Sales & Related | 104 (75.9%) | 33 (24.1%) |
| Office & Administration | 9 (6.4%) | 131 (93.6%) |
| Total (Category) | 113 (40.8%) | 164 (59.2%) |
| Total (Overall) | 583 (41.1%) | 834 (58.9%) |
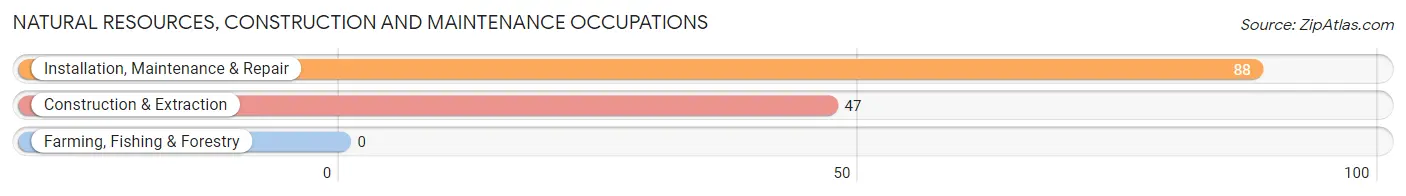
Natural Resources, Construction and Maintenance Occupations
The most common Natural Resources, Construction and Maintenance occupations in Swansboro are Installation, Maintenance & Repair (88 | 6.2%), and Construction & Extraction (47 | 3.3%).
Natural Resources, Construction and Maintenance Occupations by Sex
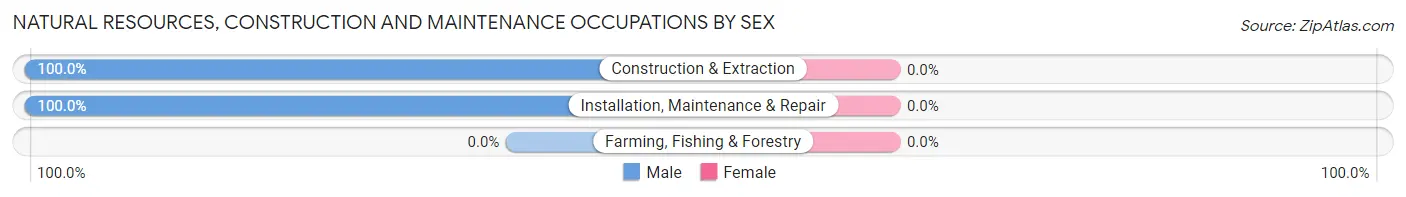
| Occupation | Male | Female |
| Farming, Fishing & Forestry | 0 (0.0%) | 0 (0.0%) |
| Construction & Extraction | 47 (100.0%) | 0 (0.0%) |
| Installation, Maintenance & Repair | 88 (100.0%) | 0 (0.0%) |
| Total (Category) | 135 (100.0%) | 0 (0.0%) |
| Total (Overall) | 583 (41.1%) | 834 (58.9%) |
Production, Transportation and Moving Occupations
The most common Production, Transportation and Moving occupations in Swansboro are , and Material Moving (34 | 2.4%).
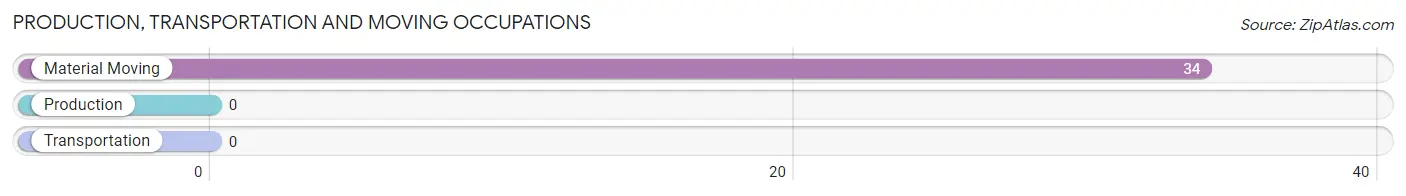
Production, Transportation and Moving Occupations by Sex
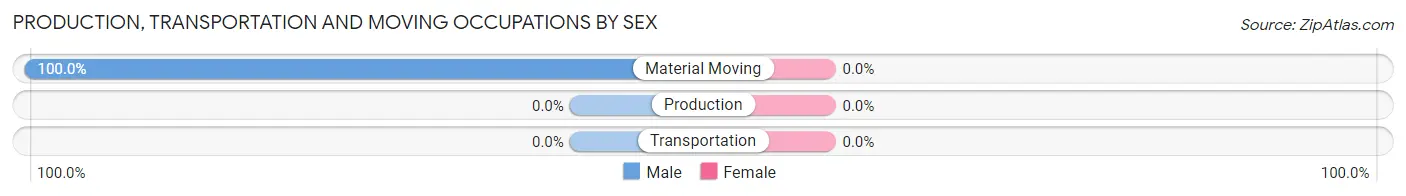
| Occupation | Male | Female |
| Production | 0 (0.0%) | 0 (0.0%) |
| Transportation | 0 (0.0%) | 0 (0.0%) |
| Material Moving | 34 (100.0%) | 0 (0.0%) |
| Total (Category) | 34 (100.0%) | 0 (0.0%) |
| Total (Overall) | 583 (41.1%) | 834 (58.9%) |
Employment Industries by Sex in Swansboro
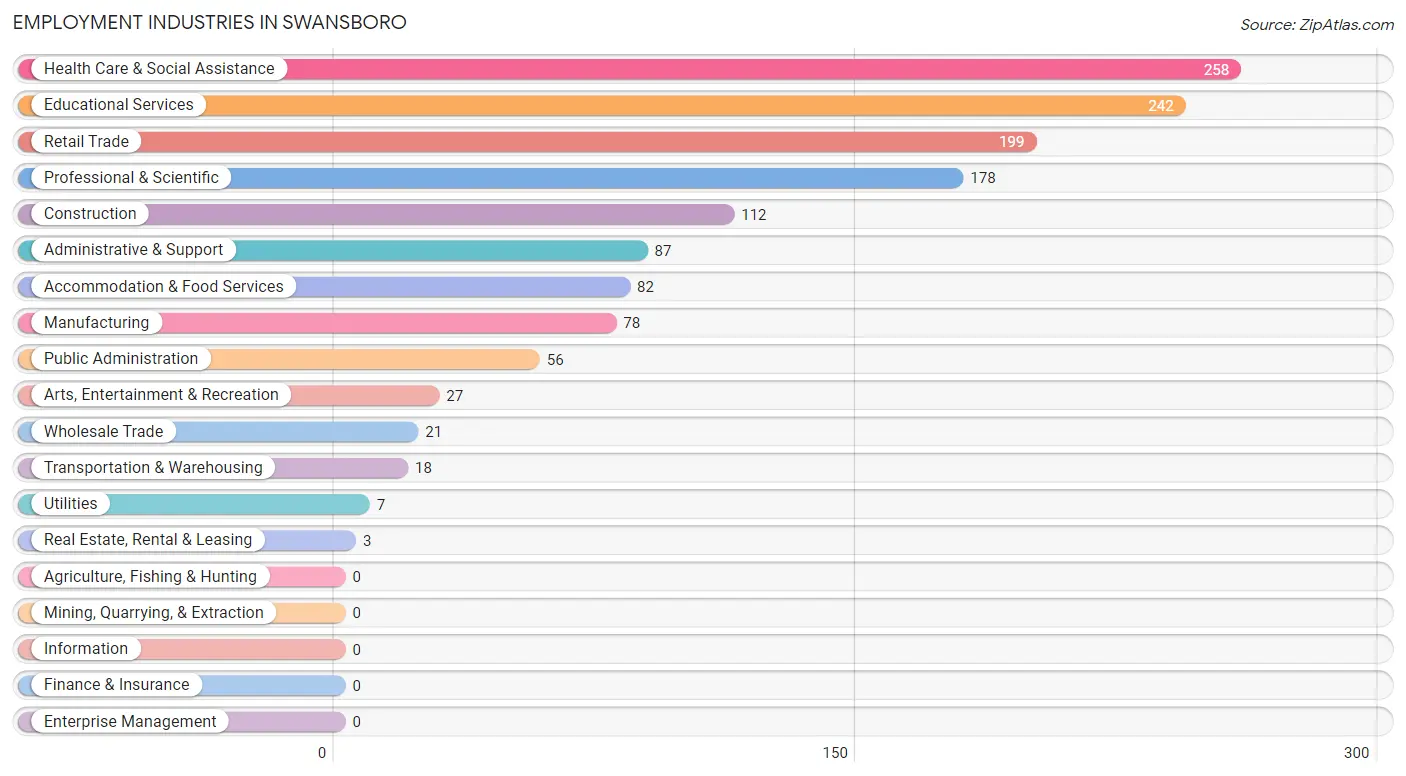
Employment Industries in Swansboro
The major employment industries in Swansboro include Health Care & Social Assistance (258 | 18.2%), Educational Services (242 | 17.1%), Retail Trade (199 | 14.0%), Professional & Scientific (178 | 12.6%), and Construction (112 | 7.9%).
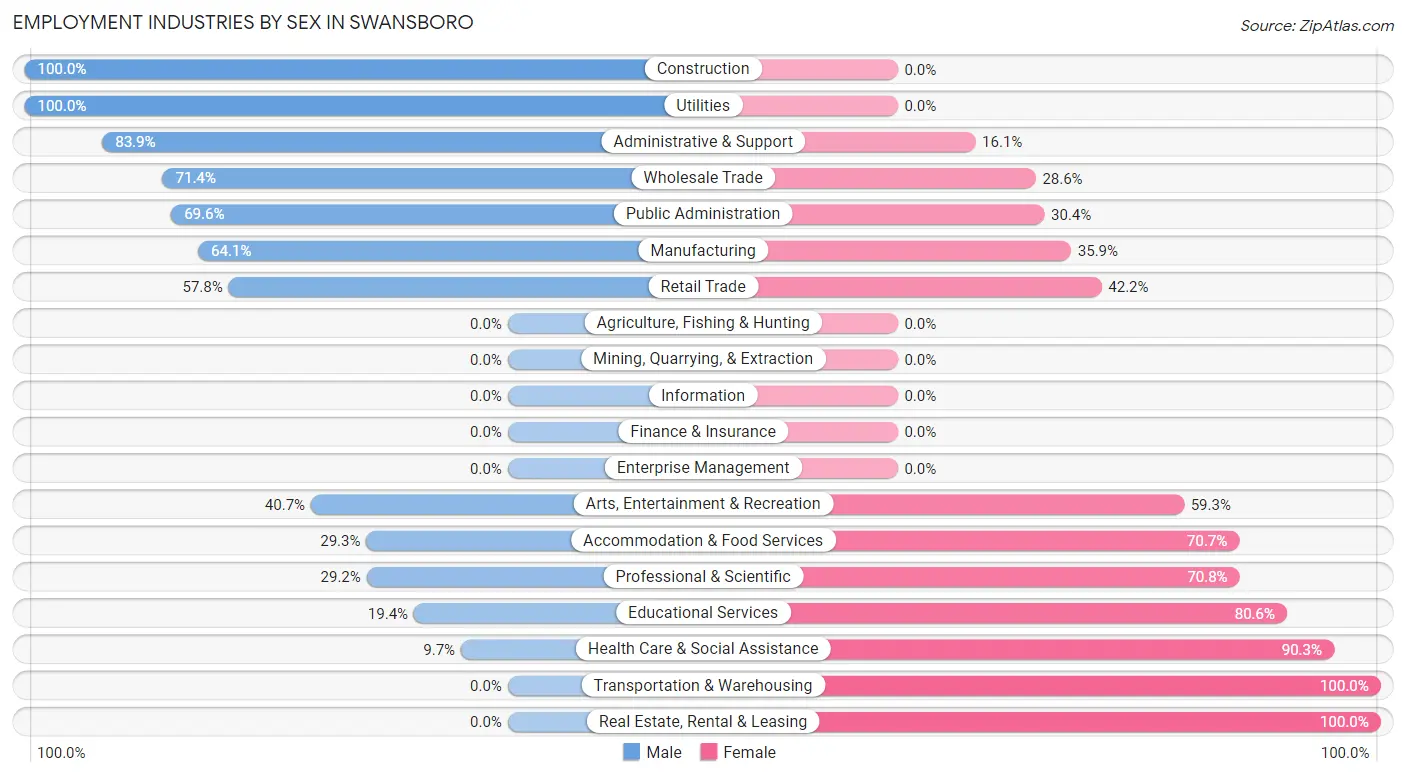
Employment Industries by Sex in Swansboro
The Swansboro industries that see more men than women are Construction (100.0%), Utilities (100.0%), and Administrative & Support (83.9%), whereas the industries that tend to have a higher number of women are Transportation & Warehousing (100.0%), Real Estate, Rental & Leasing (100.0%), and Health Care & Social Assistance (90.3%).
| Industry | Male | Female |
| Agriculture, Fishing & Hunting | 0 (0.0%) | 0 (0.0%) |
| Mining, Quarrying, & Extraction | 0 (0.0%) | 0 (0.0%) |
| Construction | 112 (100.0%) | 0 (0.0%) |
| Manufacturing | 50 (64.1%) | 28 (35.9%) |
| Wholesale Trade | 15 (71.4%) | 6 (28.6%) |
| Retail Trade | 115 (57.8%) | 84 (42.2%) |
| Transportation & Warehousing | 0 (0.0%) | 18 (100.0%) |
| Utilities | 7 (100.0%) | 0 (0.0%) |
| Information | 0 (0.0%) | 0 (0.0%) |
| Finance & Insurance | 0 (0.0%) | 0 (0.0%) |
| Real Estate, Rental & Leasing | 0 (0.0%) | 3 (100.0%) |
| Professional & Scientific | 52 (29.2%) | 126 (70.8%) |
| Enterprise Management | 0 (0.0%) | 0 (0.0%) |
| Administrative & Support | 73 (83.9%) | 14 (16.1%) |
| Educational Services | 47 (19.4%) | 195 (80.6%) |
| Health Care & Social Assistance | 25 (9.7%) | 233 (90.3%) |
| Arts, Entertainment & Recreation | 11 (40.7%) | 16 (59.3%) |
| Accommodation & Food Services | 24 (29.3%) | 58 (70.7%) |
| Public Administration | 39 (69.6%) | 17 (30.4%) |
| Total | 583 (41.1%) | 834 (58.9%) |
Education in Swansboro
School Enrollment in Swansboro
The most common levels of schooling among the 1,139 students in Swansboro are high school (315 | 27.7%), elementary school (270 | 23.7%), and nursery / preschool (185 | 16.2%).
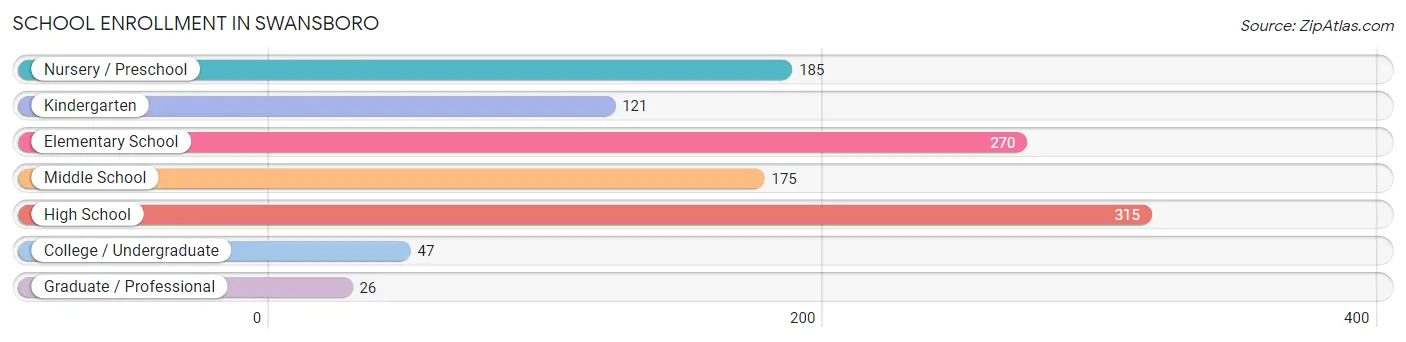
| School Level | # Students | % Students |
| Nursery / Preschool | 185 | 16.2% |
| Kindergarten | 121 | 10.6% |
| Elementary School | 270 | 23.7% |
| Middle School | 175 | 15.4% |
| High School | 315 | 27.7% |
| College / Undergraduate | 47 | 4.1% |
| Graduate / Professional | 26 | 2.3% |
| Total | 1,139 | 100.0% |
School Enrollment by Age by Funding Source in Swansboro
Out of a total of 1,139 students who are enrolled in schools in Swansboro, 82 (7.2%) attend a private institution, while the remaining 1,057 (92.8%) are enrolled in public schools. The age group of 35 years and over has the highest likelihood of being enrolled in private schools, with 25 (28.4% in the age bracket) enrolled. Conversely, the age group of 3 to 4 year olds has the lowest likelihood of being enrolled in a private school, with 184 (100.0% in the age bracket) attending a public institution.
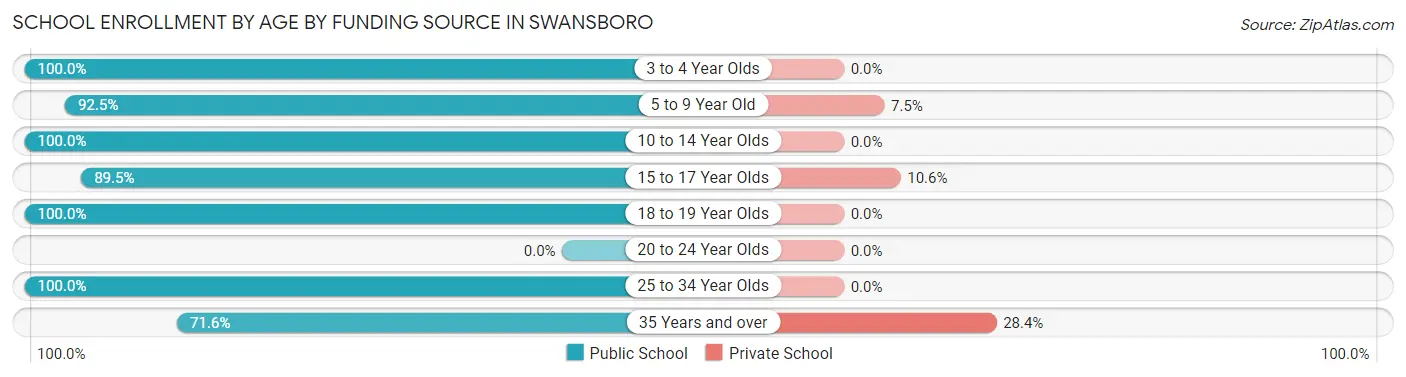
| Age Bracket | Public School | Private School |
| 3 to 4 Year Olds | 184 (100.0%) | 0 (0.0%) |
| 5 to 9 Year Old | 344 (92.5%) | 28 (7.5%) |
| 10 to 14 Year Olds | 195 (100.0%) | 0 (0.0%) |
| 15 to 17 Year Olds | 246 (89.4%) | 29 (10.5%) |
| 18 to 19 Year Olds | 15 (100.0%) | 0 (0.0%) |
| 20 to 24 Year Olds | 0 (0.0%) | 0 (0.0%) |
| 25 to 34 Year Olds | 10 (100.0%) | 0 (0.0%) |
| 35 Years and over | 63 (71.6%) | 25 (28.4%) |
| Total | 1,057 (92.8%) | 82 (7.2%) |
Educational Attainment by Field of Study in Swansboro
Education (419 | 39.2%), bio, nature & agricultural (109 | 10.2%), business (108 | 10.1%), communications (96 | 9.0%), and psychology (87 | 8.2%) are the most common fields of study among 1,068 individuals in Swansboro who have obtained a bachelor's degree or higher.
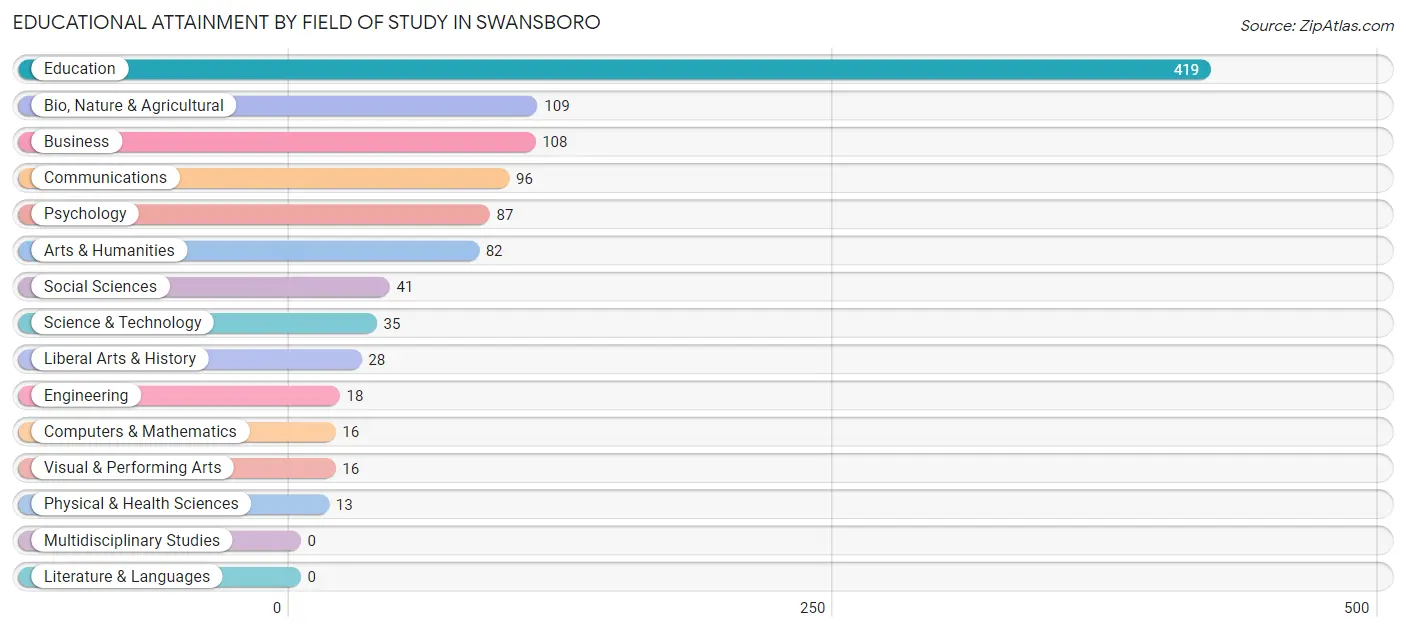
| Field of Study | # Graduates | % Graduates |
| Computers & Mathematics | 16 | 1.5% |
| Bio, Nature & Agricultural | 109 | 10.2% |
| Physical & Health Sciences | 13 | 1.2% |
| Psychology | 87 | 8.2% |
| Social Sciences | 41 | 3.8% |
| Engineering | 18 | 1.7% |
| Multidisciplinary Studies | 0 | 0.0% |
| Science & Technology | 35 | 3.3% |
| Business | 108 | 10.1% |
| Education | 419 | 39.2% |
| Literature & Languages | 0 | 0.0% |
| Liberal Arts & History | 28 | 2.6% |
| Visual & Performing Arts | 16 | 1.5% |
| Communications | 96 | 9.0% |
| Arts & Humanities | 82 | 7.7% |
| Total | 1,068 | 100.0% |
Transportation & Commute in Swansboro
Vehicle Availability by Sex in Swansboro
The most prevalent vehicle ownership categories in Swansboro are males with 2 vehicles (307, accounting for 39.8%) and females with 2 vehicles (439, making up 35.3%).
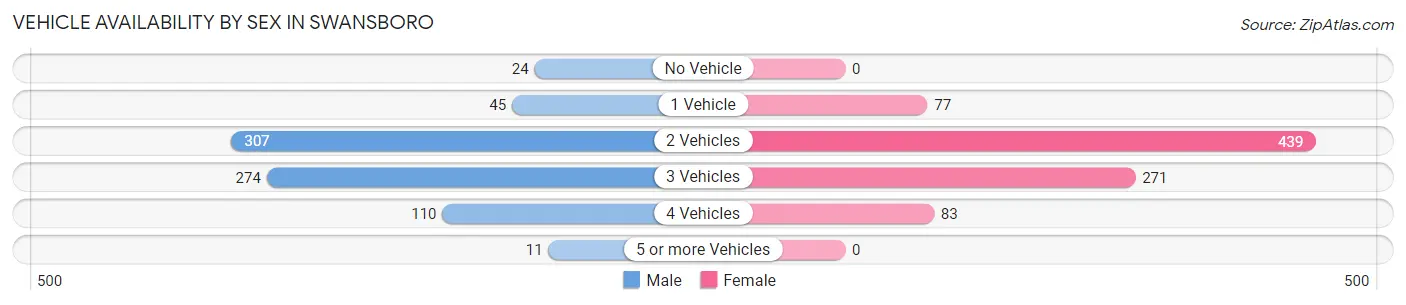
| Vehicles Available | Male | Female |
| No Vehicle | 24 (3.1%) | 0 (0.0%) |
| 1 Vehicle | 45 (5.8%) | 77 (8.8%) |
| 2 Vehicles | 307 (39.8%) | 439 (50.5%) |
| 3 Vehicles | 274 (35.5%) | 271 (31.1%) |
| 4 Vehicles | 110 (14.3%) | 83 (9.5%) |
| 5 or more Vehicles | 11 (1.4%) | 0 (0.0%) |
| Total | 771 (100.0%) | 870 (100.0%) |
Commute Time in Swansboro
The most frequently occuring commute durations in Swansboro are 20 to 24 minutes (309 commuters, 22.2%), 5 to 9 minutes (257 commuters, 18.4%), and 30 to 34 minutes (239 commuters, 17.2%).
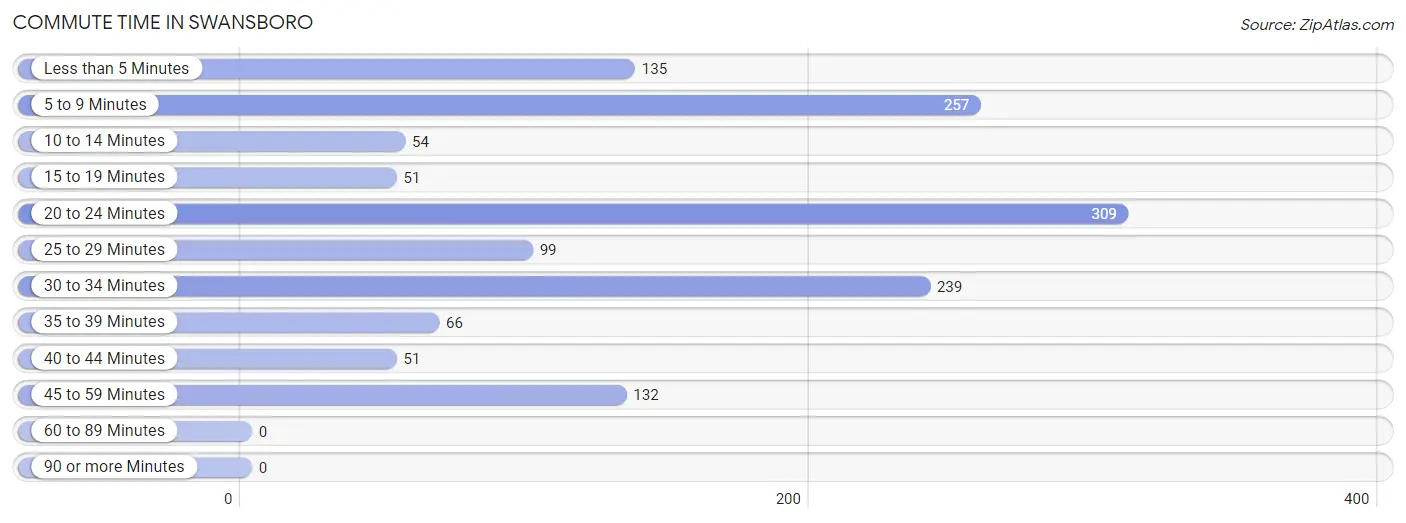
| Commute Time | # Commuters | % Commuters |
| Less than 5 Minutes | 135 | 9.7% |
| 5 to 9 Minutes | 257 | 18.4% |
| 10 to 14 Minutes | 54 | 3.9% |
| 15 to 19 Minutes | 51 | 3.7% |
| 20 to 24 Minutes | 309 | 22.2% |
| 25 to 29 Minutes | 99 | 7.1% |
| 30 to 34 Minutes | 239 | 17.2% |
| 35 to 39 Minutes | 66 | 4.7% |
| 40 to 44 Minutes | 51 | 3.7% |
| 45 to 59 Minutes | 132 | 9.5% |
| 60 to 89 Minutes | 0 | 0.0% |
| 90 or more Minutes | 0 | 0.0% |
Commute Time by Sex in Swansboro
The most common commute times in Swansboro are 20 to 24 minutes (209 commuters, 29.7%) for males and 5 to 9 minutes (244 commuters, 35.4%) for females.
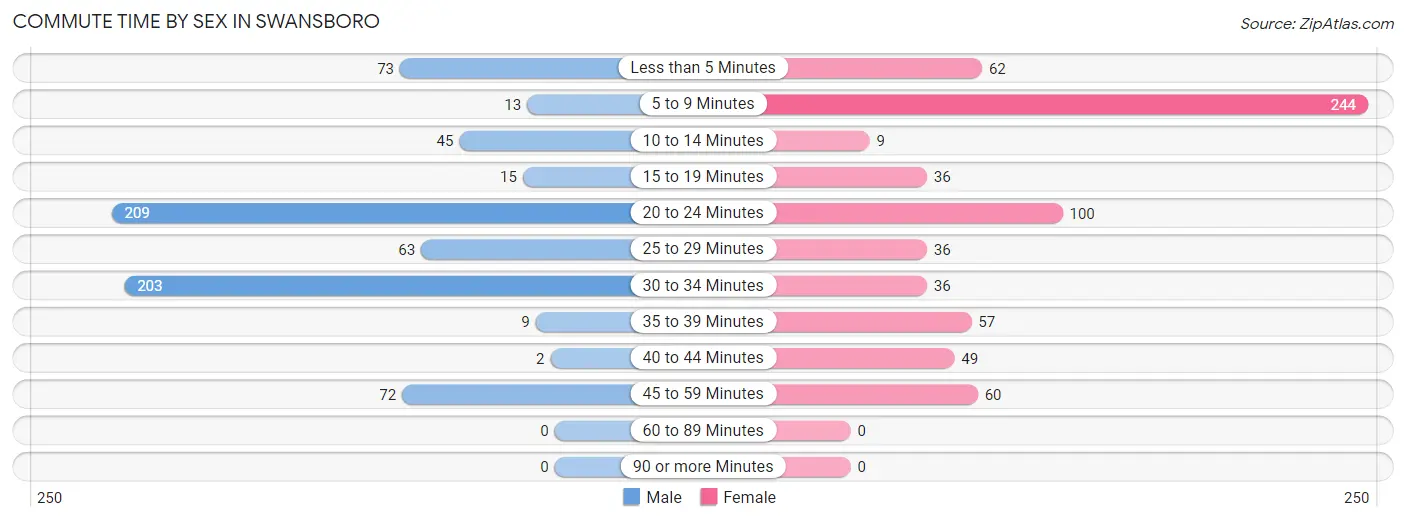
| Commute Time | Male | Female |
| Less than 5 Minutes | 73 (10.4%) | 62 (9.0%) |
| 5 to 9 Minutes | 13 (1.8%) | 244 (35.4%) |
| 10 to 14 Minutes | 45 (6.4%) | 9 (1.3%) |
| 15 to 19 Minutes | 15 (2.1%) | 36 (5.2%) |
| 20 to 24 Minutes | 209 (29.7%) | 100 (14.5%) |
| 25 to 29 Minutes | 63 (8.9%) | 36 (5.2%) |
| 30 to 34 Minutes | 203 (28.8%) | 36 (5.2%) |
| 35 to 39 Minutes | 9 (1.3%) | 57 (8.3%) |
| 40 to 44 Minutes | 2 (0.3%) | 49 (7.1%) |
| 45 to 59 Minutes | 72 (10.2%) | 60 (8.7%) |
| 60 to 89 Minutes | 0 (0.0%) | 0 (0.0%) |
| 90 or more Minutes | 0 (0.0%) | 0 (0.0%) |
Time of Departure to Work by Sex in Swansboro
The most frequent times of departure to work in Swansboro are 7:00 AM to 7:29 AM (280, 39.8%) for males and 7:00 AM to 7:29 AM (227, 33.0%) for females.
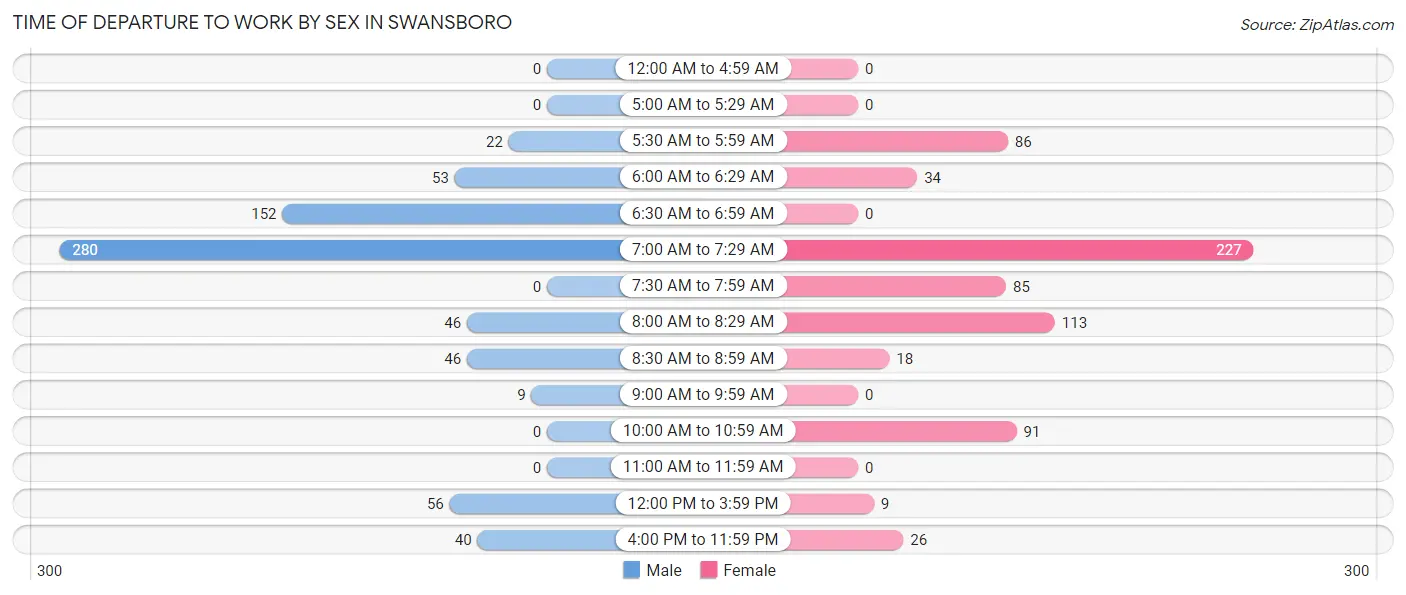
| Time of Departure | Male | Female |
| 12:00 AM to 4:59 AM | 0 (0.0%) | 0 (0.0%) |
| 5:00 AM to 5:29 AM | 0 (0.0%) | 0 (0.0%) |
| 5:30 AM to 5:59 AM | 22 (3.1%) | 86 (12.5%) |
| 6:00 AM to 6:29 AM | 53 (7.5%) | 34 (4.9%) |
| 6:30 AM to 6:59 AM | 152 (21.6%) | 0 (0.0%) |
| 7:00 AM to 7:29 AM | 280 (39.8%) | 227 (33.0%) |
| 7:30 AM to 7:59 AM | 0 (0.0%) | 85 (12.3%) |
| 8:00 AM to 8:29 AM | 46 (6.5%) | 113 (16.4%) |
| 8:30 AM to 8:59 AM | 46 (6.5%) | 18 (2.6%) |
| 9:00 AM to 9:59 AM | 9 (1.3%) | 0 (0.0%) |
| 10:00 AM to 10:59 AM | 0 (0.0%) | 91 (13.2%) |
| 11:00 AM to 11:59 AM | 0 (0.0%) | 0 (0.0%) |
| 12:00 PM to 3:59 PM | 56 (8.0%) | 9 (1.3%) |
| 4:00 PM to 11:59 PM | 40 (5.7%) | 26 (3.8%) |
| Total | 704 (100.0%) | 689 (100.0%) |
Housing Occupancy in Swansboro
Occupancy by Ownership in Swansboro
Of the total 1,423 dwellings in Swansboro, owner-occupied units account for 960 (67.5%), while renter-occupied units make up 463 (32.5%).
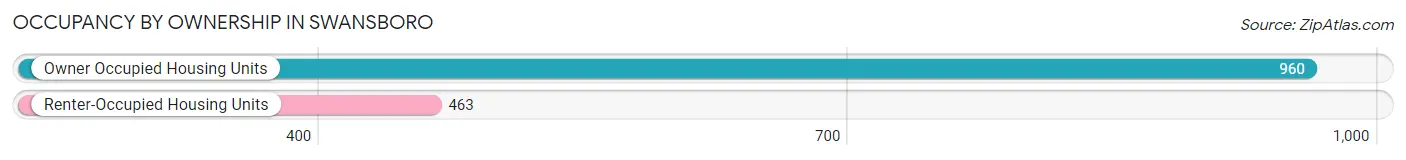
| Occupancy | # Housing Units | % Housing Units |
| Owner Occupied Housing Units | 960 | 67.5% |
| Renter-Occupied Housing Units | 463 | 32.5% |
| Total Occupied Housing Units | 1,423 | 100.0% |
Occupancy by Household Size in Swansboro
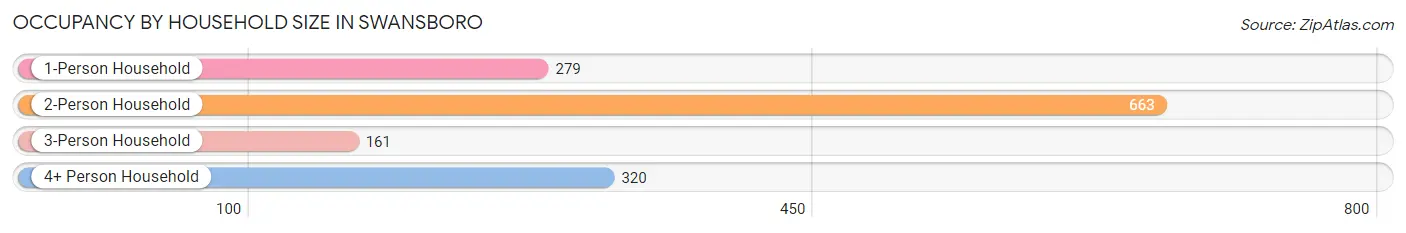
| Household Size | # Housing Units | % Housing Units |
| 1-Person Household | 279 | 19.6% |
| 2-Person Household | 663 | 46.6% |
| 3-Person Household | 161 | 11.3% |
| 4+ Person Household | 320 | 22.5% |
| Total Housing Units | 1,423 | 100.0% |
Occupancy by Ownership by Household Size in Swansboro
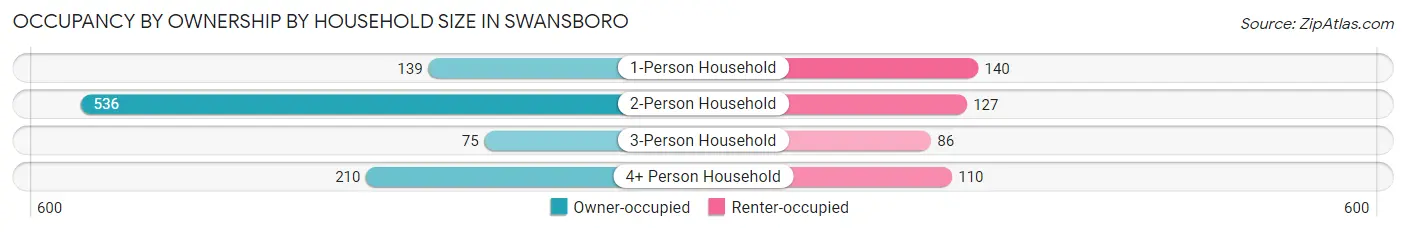
| Household Size | Owner-occupied | Renter-occupied |
| 1-Person Household | 139 (49.8%) | 140 (50.2%) |
| 2-Person Household | 536 (80.8%) | 127 (19.2%) |
| 3-Person Household | 75 (46.6%) | 86 (53.4%) |
| 4+ Person Household | 210 (65.6%) | 110 (34.4%) |
| Total Housing Units | 960 (67.5%) | 463 (32.5%) |
Occupancy by Educational Attainment in Swansboro
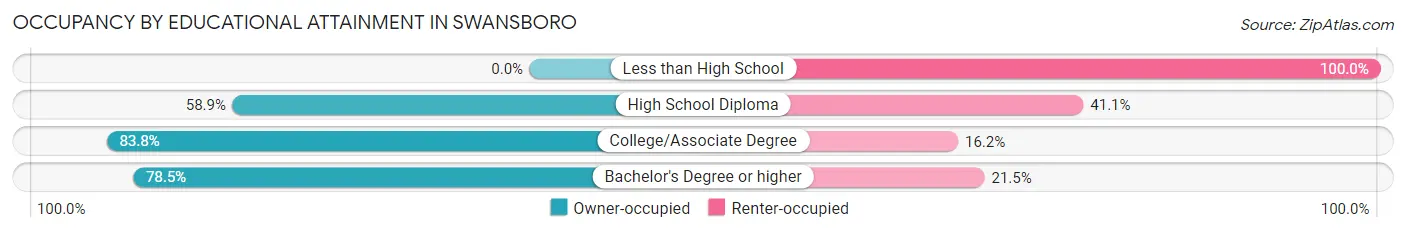
| Household Size | Owner-occupied | Renter-occupied |
| Less than High School | 0 (0.0%) | 131 (100.0%) |
| High School Diploma | 218 (58.9%) | 152 (41.1%) |
| College/Associate Degree | 289 (83.8%) | 56 (16.2%) |
| Bachelor's Degree or higher | 453 (78.5%) | 124 (21.5%) |
Occupancy by Age of Householder in Swansboro
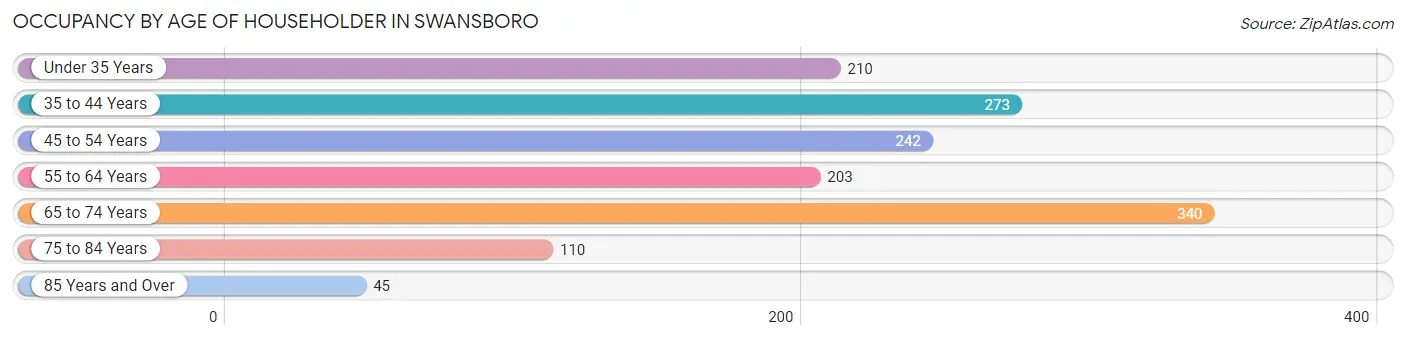
| Age Bracket | # Households | % Households |
| Under 35 Years | 210 | 14.8% |
| 35 to 44 Years | 273 | 19.2% |
| 45 to 54 Years | 242 | 17.0% |
| 55 to 64 Years | 203 | 14.3% |
| 65 to 74 Years | 340 | 23.9% |
| 75 to 84 Years | 110 | 7.7% |
| 85 Years and Over | 45 | 3.2% |
| Total | 1,423 | 100.0% |
Housing Finances in Swansboro
Median Income by Occupancy in Swansboro
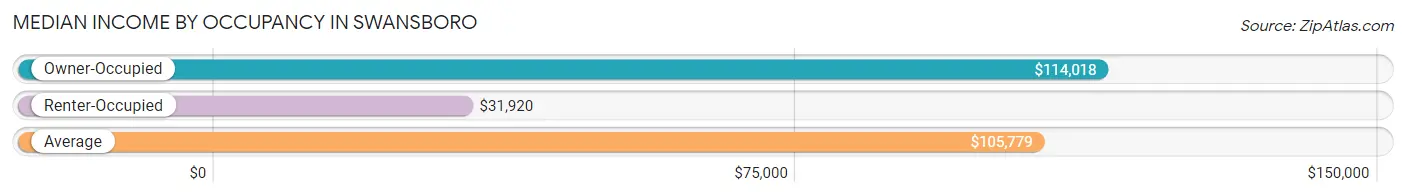
| Occupancy Type | # Households | Median Income |
| Owner-Occupied | 960 (67.5%) | $114,018 |
| Renter-Occupied | 463 (32.5%) | $31,920 |
| Average | 1,423 (100.0%) | $105,779 |
Occupancy by Householder Income Bracket in Swansboro

| Income Bracket | Owner-occupied | Renter-occupied |
| Less than $5,000 | 0 (0.0%) | 78 (16.9%) |
| $5,000 to $9,999 | 0 (0.0%) | 0 (0.0%) |
| $10,000 to $14,999 | 0 (0.0%) | 82 (17.7%) |
| $15,000 to $19,999 | 15 (1.6%) | 0 (0.0%) |
| $20,000 to $24,999 | 82 (8.5%) | 38 (8.2%) |
| $25,000 to $34,999 | 42 (4.4%) | 40 (8.6%) |
| $35,000 to $49,999 | 25 (2.6%) | 74 (16.0%) |
| $50,000 to $74,999 | 104 (10.8%) | 0 (0.0%) |
| $75,000 to $99,999 | 69 (7.2%) | 21 (4.5%) |
| $100,000 to $149,999 | 216 (22.5%) | 83 (17.9%) |
| $150,000 or more | 407 (42.4%) | 47 (10.2%) |
| Total | 960 (100.0%) | 463 (100.0%) |
Monthly Housing Cost Tiers in Swansboro
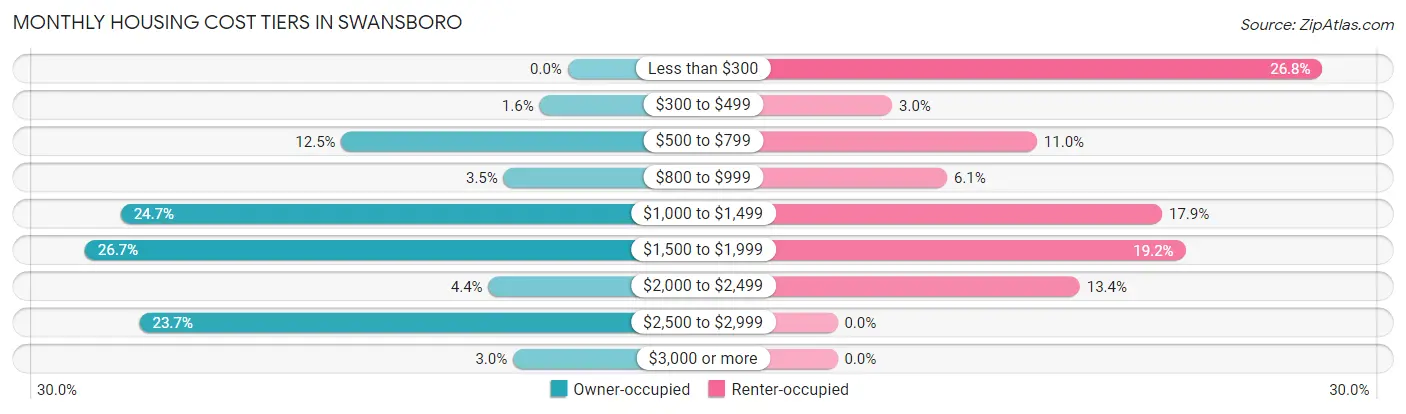
| Monthly Cost | Owner-occupied | Renter-occupied |
| Less than $300 | 0 (0.0%) | 124 (26.8%) |
| $300 to $499 | 15 (1.6%) | 14 (3.0%) |
| $500 to $799 | 120 (12.5%) | 51 (11.0%) |
| $800 to $999 | 34 (3.5%) | 28 (6.0%) |
| $1,000 to $1,499 | 237 (24.7%) | 83 (17.9%) |
| $1,500 to $1,999 | 256 (26.7%) | 89 (19.2%) |
| $2,000 to $2,499 | 42 (4.4%) | 62 (13.4%) |
| $2,500 to $2,999 | 227 (23.6%) | 0 (0.0%) |
| $3,000 or more | 29 (3.0%) | 0 (0.0%) |
| Total | 960 (100.0%) | 463 (100.0%) |
Physical Housing Characteristics in Swansboro
Housing Structures in Swansboro
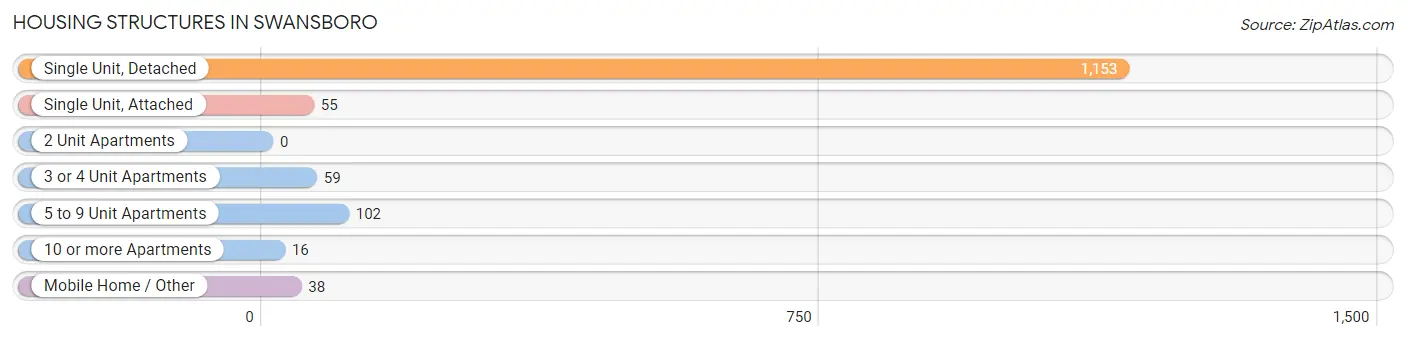
| Structure Type | # Housing Units | % Housing Units |
| Single Unit, Detached | 1,153 | 81.0% |
| Single Unit, Attached | 55 | 3.9% |
| 2 Unit Apartments | 0 | 0.0% |
| 3 or 4 Unit Apartments | 59 | 4.2% |
| 5 to 9 Unit Apartments | 102 | 7.2% |
| 10 or more Apartments | 16 | 1.1% |
| Mobile Home / Other | 38 | 2.7% |
| Total | 1,423 | 100.0% |
Housing Structures by Occupancy in Swansboro
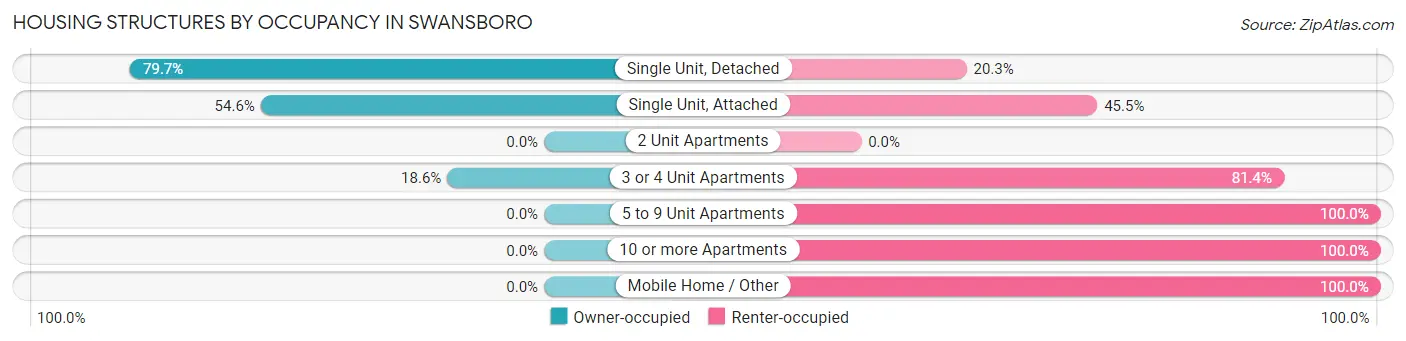
| Structure Type | Owner-occupied | Renter-occupied |
| Single Unit, Detached | 919 (79.7%) | 234 (20.3%) |
| Single Unit, Attached | 30 (54.5%) | 25 (45.5%) |
| 2 Unit Apartments | 0 (0.0%) | 0 (0.0%) |
| 3 or 4 Unit Apartments | 11 (18.6%) | 48 (81.4%) |
| 5 to 9 Unit Apartments | 0 (0.0%) | 102 (100.0%) |
| 10 or more Apartments | 0 (0.0%) | 16 (100.0%) |
| Mobile Home / Other | 0 (0.0%) | 38 (100.0%) |
| Total | 960 (67.5%) | 463 (32.5%) |
Housing Structures by Number of Rooms in Swansboro
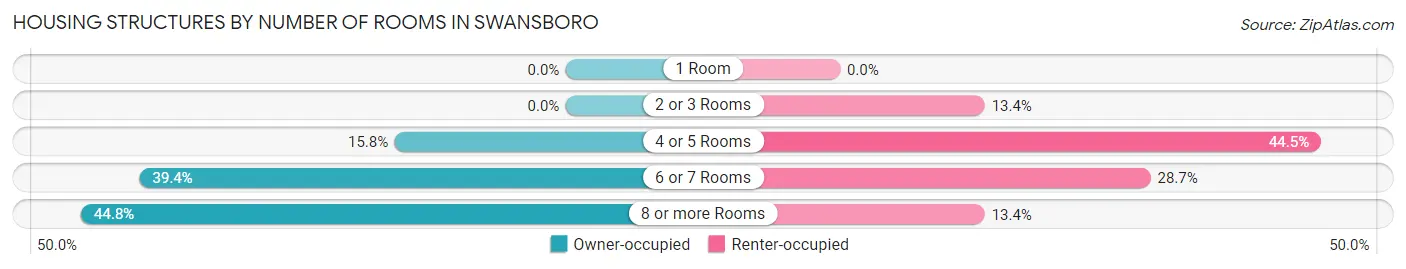
| Number of Rooms | Owner-occupied | Renter-occupied |
| 1 Room | 0 (0.0%) | 0 (0.0%) |
| 2 or 3 Rooms | 0 (0.0%) | 62 (13.4%) |
| 4 or 5 Rooms | 152 (15.8%) | 206 (44.5%) |
| 6 or 7 Rooms | 378 (39.4%) | 133 (28.7%) |
| 8 or more Rooms | 430 (44.8%) | 62 (13.4%) |
| Total | 960 (100.0%) | 463 (100.0%) |
Housing Structure by Heating Type in Swansboro
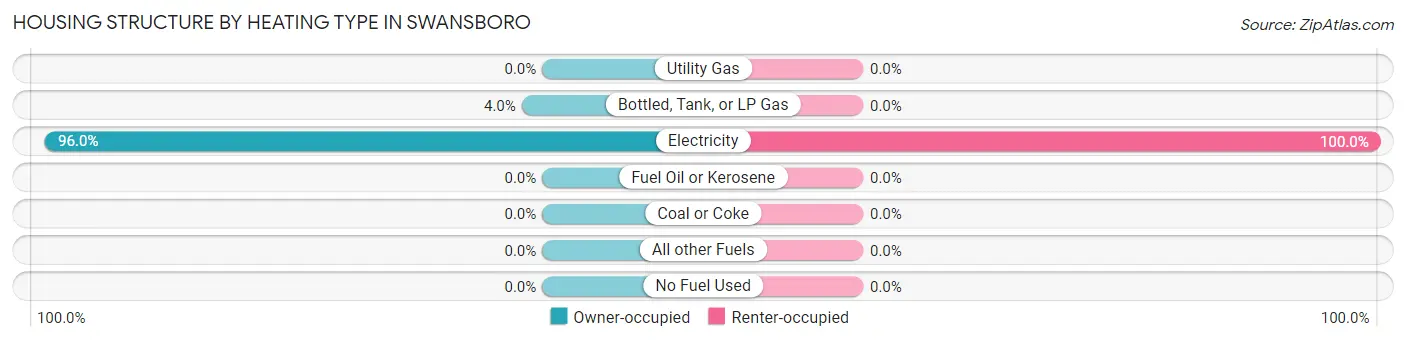
| Heating Type | Owner-occupied | Renter-occupied |
| Utility Gas | 0 (0.0%) | 0 (0.0%) |
| Bottled, Tank, or LP Gas | 38 (4.0%) | 0 (0.0%) |
| Electricity | 922 (96.0%) | 463 (100.0%) |
| Fuel Oil or Kerosene | 0 (0.0%) | 0 (0.0%) |
| Coal or Coke | 0 (0.0%) | 0 (0.0%) |
| All other Fuels | 0 (0.0%) | 0 (0.0%) |
| No Fuel Used | 0 (0.0%) | 0 (0.0%) |
| Total | 960 (100.0%) | 463 (100.0%) |
Household Vehicle Usage in Swansboro
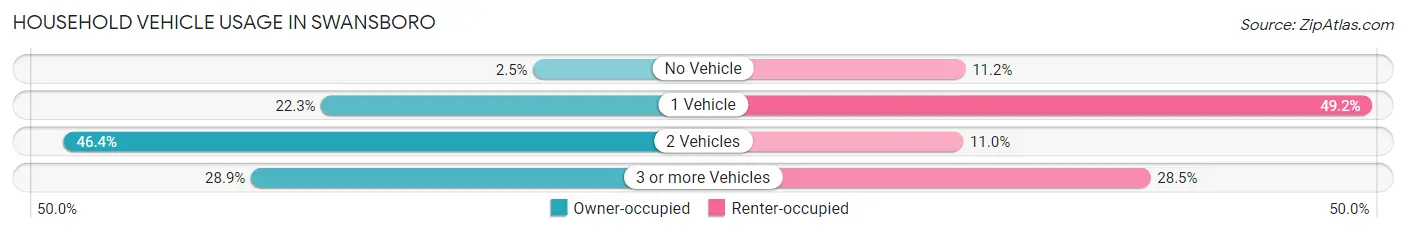
| Vehicles per Household | Owner-occupied | Renter-occupied |
| No Vehicle | 24 (2.5%) | 52 (11.2%) |
| 1 Vehicle | 214 (22.3%) | 228 (49.2%) |
| 2 Vehicles | 445 (46.4%) | 51 (11.0%) |
| 3 or more Vehicles | 277 (28.8%) | 132 (28.5%) |
| Total | 960 (100.0%) | 463 (100.0%) |
Real Estate & Mortgages in Swansboro
Real Estate and Mortgage Overview in Swansboro
| Characteristic | Without Mortgage | With Mortgage |
| Housing Units | 174 | 786 |
| Median Property Value | $264,300 | $334,600 |
| Median Household Income | $76,591 | $387 |
| Monthly Housing Costs | $731 | $29 |
| Real Estate Taxes | $2,307 | $0 |
Property Value by Mortgage Status in Swansboro
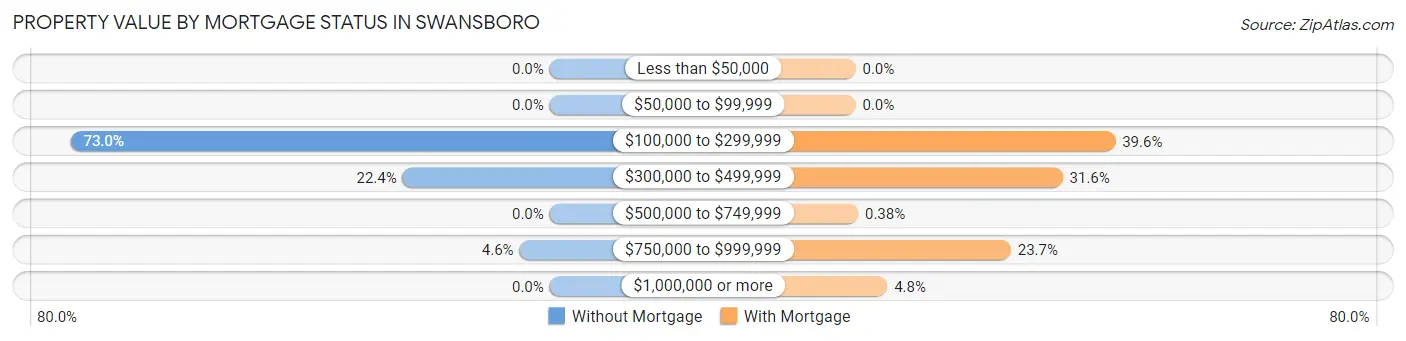
| Property Value | Without Mortgage | With Mortgage |
| Less than $50,000 | 0 (0.0%) | 0 (0.0%) |
| $50,000 to $99,999 | 0 (0.0%) | 0 (0.0%) |
| $100,000 to $299,999 | 127 (73.0%) | 311 (39.6%) |
| $300,000 to $499,999 | 39 (22.4%) | 248 (31.6%) |
| $500,000 to $749,999 | 0 (0.0%) | 3 (0.4%) |
| $750,000 to $999,999 | 8 (4.6%) | 186 (23.7%) |
| $1,000,000 or more | 0 (0.0%) | 38 (4.8%) |
| Total | 174 (100.0%) | 786 (100.0%) |
Household Income by Mortgage Status in Swansboro
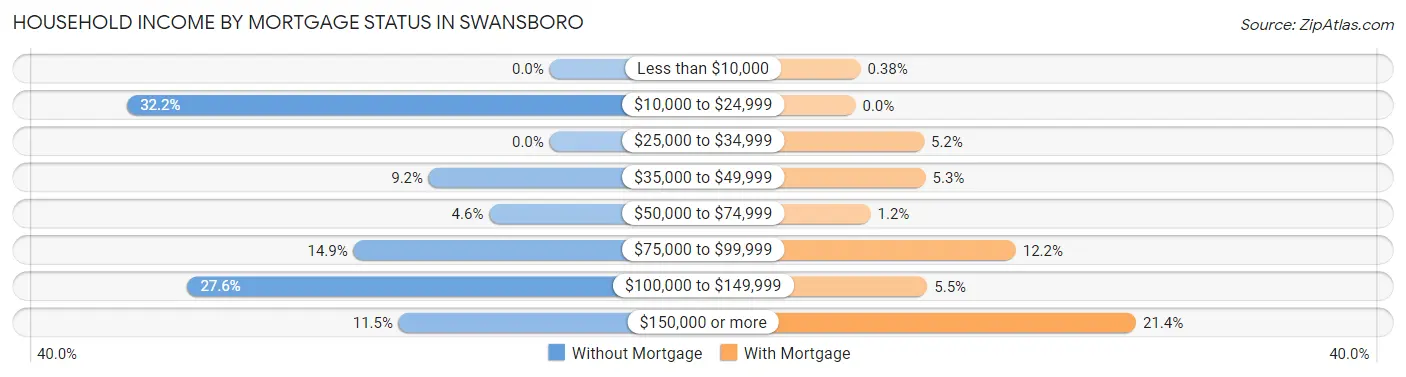
| Household Income | Without Mortgage | With Mortgage |
| Less than $10,000 | 0 (0.0%) | 3 (0.4%) |
| $10,000 to $24,999 | 56 (32.2%) | 0 (0.0%) |
| $25,000 to $34,999 | 0 (0.0%) | 41 (5.2%) |
| $35,000 to $49,999 | 16 (9.2%) | 42 (5.3%) |
| $50,000 to $74,999 | 8 (4.6%) | 9 (1.1%) |
| $75,000 to $99,999 | 26 (14.9%) | 96 (12.2%) |
| $100,000 to $149,999 | 48 (27.6%) | 43 (5.5%) |
| $150,000 or more | 20 (11.5%) | 168 (21.4%) |
| Total | 174 (100.0%) | 786 (100.0%) |
Property Value to Household Income Ratio in Swansboro
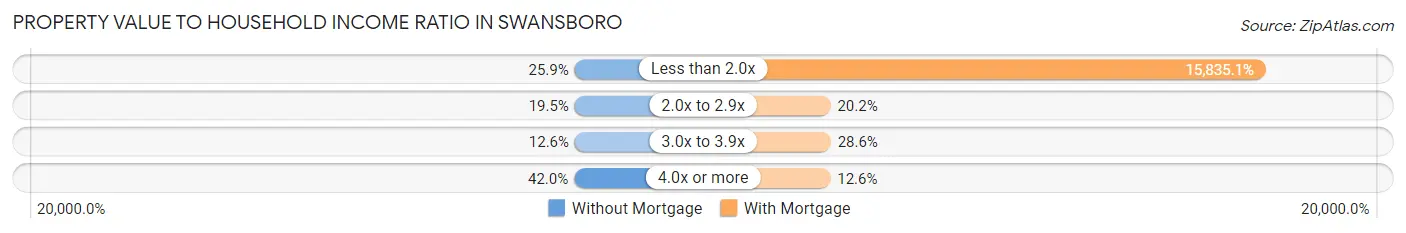
| Value-to-Income Ratio | Without Mortgage | With Mortgage |
| Less than 2.0x | 45 (25.9%) | 124,464 (15,835.1%) |
| 2.0x to 2.9x | 34 (19.5%) | 159 (20.2%) |
| 3.0x to 3.9x | 22 (12.6%) | 225 (28.6%) |
| 4.0x or more | 73 (41.9%) | 99 (12.6%) |
| Total | 174 (100.0%) | 786 (100.0%) |
Real Estate Taxes by Mortgage Status in Swansboro
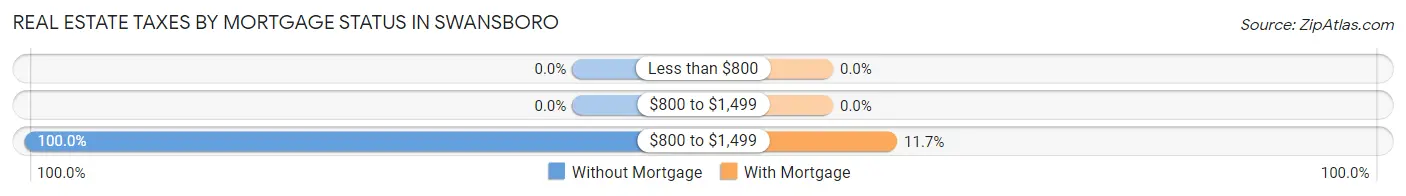
| Property Taxes | Without Mortgage | With Mortgage |
| Less than $800 | 0 (0.0%) | 0 (0.0%) |
| $800 to $1,499 | 0 (0.0%) | 0 (0.0%) |
| $800 to $1,499 | 174 (100.0%) | 92 (11.7%) |
| Total | 174 (100.0%) | 786 (100.0%) |
Health & Disability in Swansboro
Health Insurance Coverage by Age in Swansboro
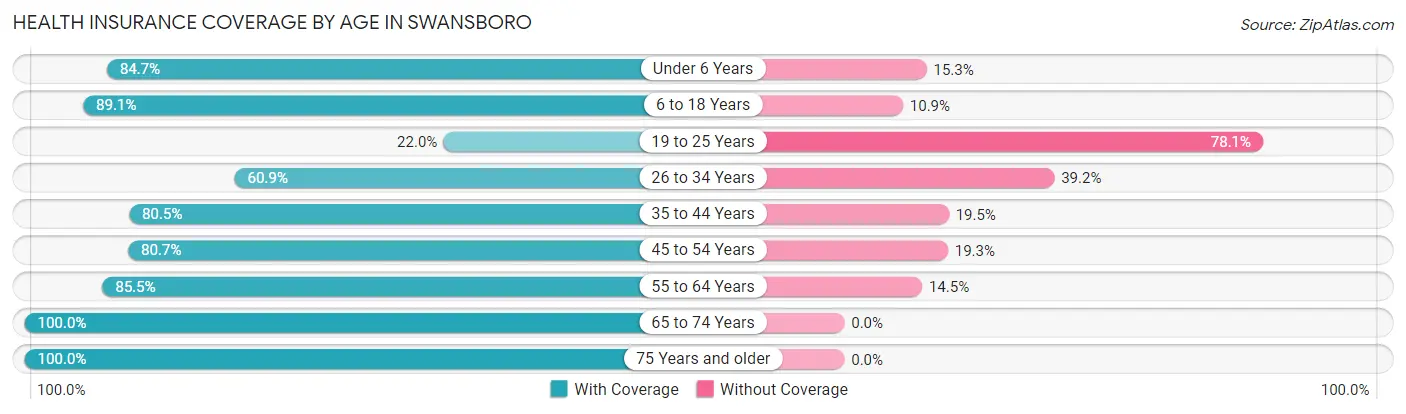
| Age Bracket | With Coverage | Without Coverage |
| Under 6 Years | 359 (84.7%) | 65 (15.3%) |
| 6 to 18 Years | 734 (89.1%) | 90 (10.9%) |
| 19 to 25 Years | 27 (22.0%) | 96 (78.0%) |
| 26 to 34 Years | 115 (60.9%) | 74 (39.2%) |
| 35 to 44 Years | 364 (80.5%) | 88 (19.5%) |
| 45 to 54 Years | 301 (80.7%) | 72 (19.3%) |
| 55 to 64 Years | 295 (85.5%) | 50 (14.5%) |
| 65 to 74 Years | 551 (100.0%) | 0 (0.0%) |
| 75 Years and older | 245 (100.0%) | 0 (0.0%) |
| Total | 2,991 (84.8%) | 535 (15.2%) |
Health Insurance Coverage by Citizenship Status in Swansboro
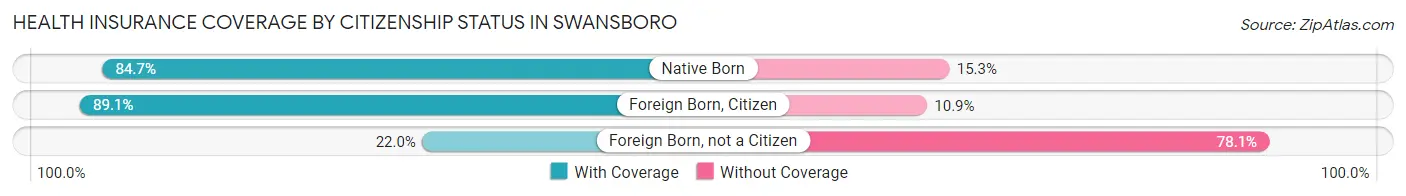
| Citizenship Status | With Coverage | Without Coverage |
| Native Born | 359 (84.7%) | 65 (15.3%) |
| Foreign Born, Citizen | 734 (89.1%) | 90 (10.9%) |
| Foreign Born, not a Citizen | 27 (22.0%) | 96 (78.0%) |
Health Insurance Coverage by Household Income in Swansboro
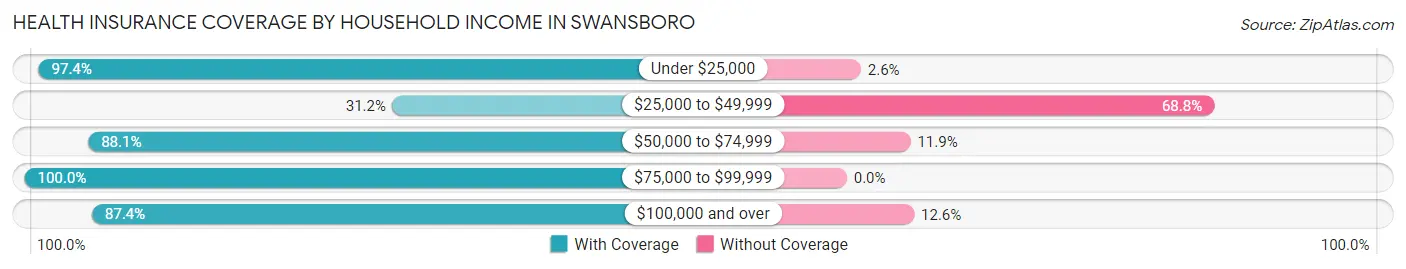
| Household Income | With Coverage | Without Coverage |
| Under $25,000 | 704 (97.4%) | 19 (2.6%) |
| $25,000 to $49,999 | 103 (31.2%) | 227 (68.8%) |
| $50,000 to $74,999 | 155 (88.1%) | 21 (11.9%) |
| $75,000 to $99,999 | 165 (100.0%) | 0 (0.0%) |
| $100,000 and over | 1,858 (87.4%) | 268 (12.6%) |
Public vs Private Health Insurance Coverage by Age in Swansboro
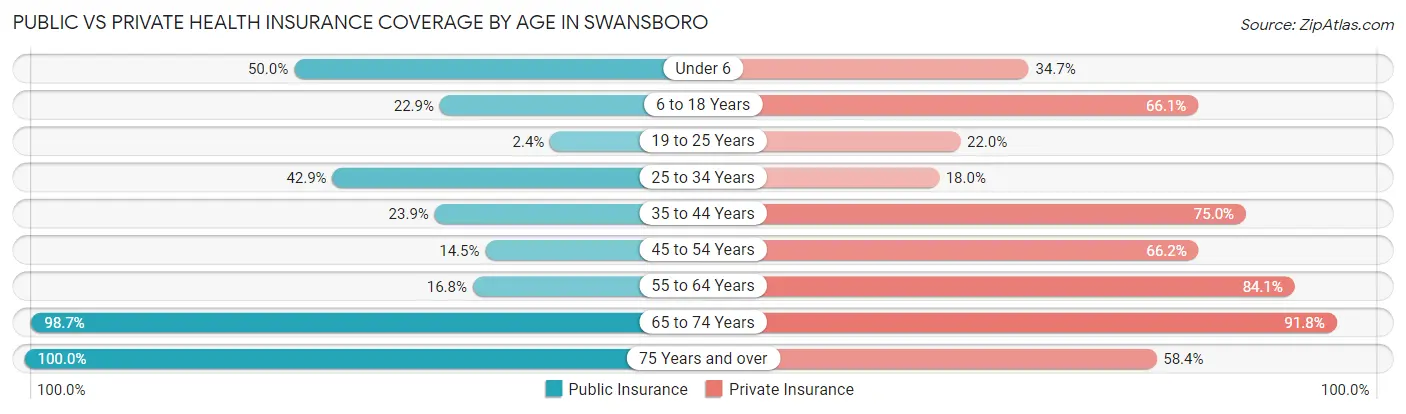
| Age Bracket | Public Insurance | Private Insurance |
| Under 6 | 212 (50.0%) | 147 (34.7%) |
| 6 to 18 Years | 189 (22.9%) | 545 (66.1%) |
| 19 to 25 Years | 3 (2.4%) | 27 (22.0%) |
| 25 to 34 Years | 81 (42.9%) | 34 (18.0%) |
| 35 to 44 Years | 108 (23.9%) | 339 (75.0%) |
| 45 to 54 Years | 54 (14.5%) | 247 (66.2%) |
| 55 to 64 Years | 58 (16.8%) | 290 (84.1%) |
| 65 to 74 Years | 544 (98.7%) | 506 (91.8%) |
| 75 Years and over | 245 (100.0%) | 143 (58.4%) |
| Total | 1,494 (42.4%) | 2,278 (64.6%) |
Disability Status by Sex by Age in Swansboro
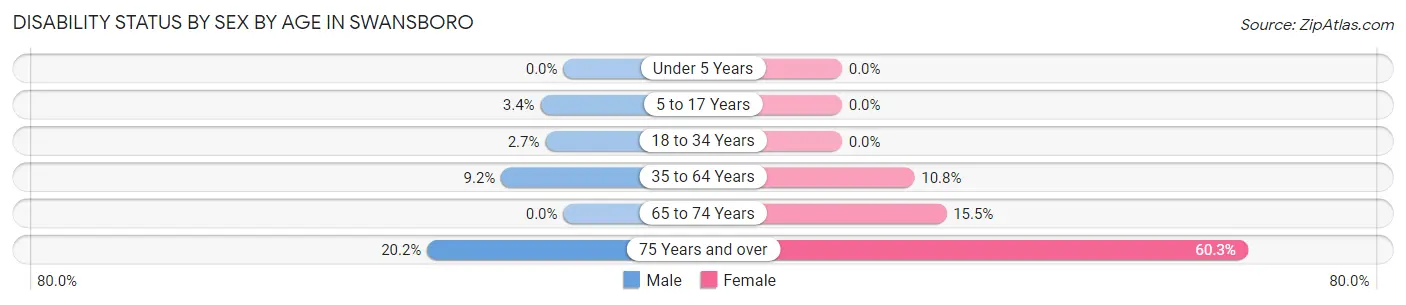
| Age Bracket | Male | Female |
| Under 5 Years | 0 (0.0%) | 0 (0.0%) |
| 5 to 17 Years | 15 (3.4%) | 0 (0.0%) |
| 18 to 34 Years | 3 (2.7%) | 0 (0.0%) |
| 35 to 64 Years | 48 (9.2%) | 70 (10.8%) |
| 65 to 74 Years | 0 (0.0%) | 53 (15.5%) |
| 75 Years and over | 18 (20.2%) | 94 (60.3%) |
Disability Class by Sex by Age in Swansboro
Disability Class: Hearing Difficulty
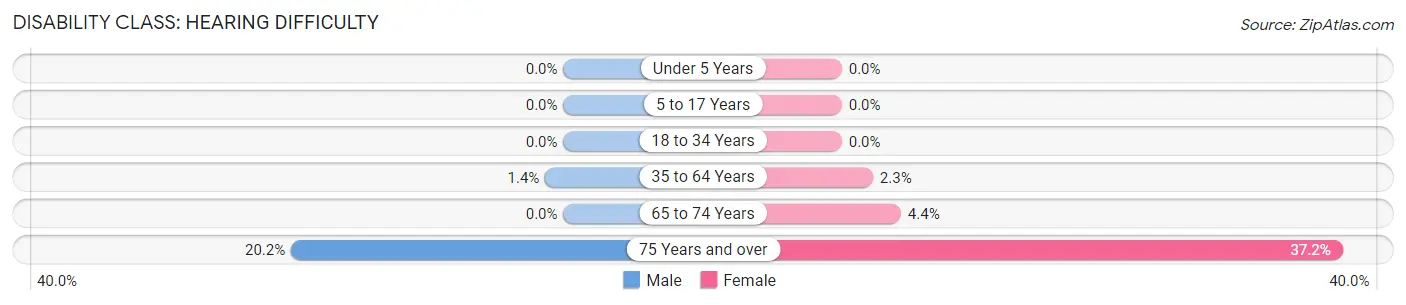
| Age Bracket | Male | Female |
| Under 5 Years | 0 (0.0%) | 0 (0.0%) |
| 5 to 17 Years | 0 (0.0%) | 0 (0.0%) |
| 18 to 34 Years | 0 (0.0%) | 0 (0.0%) |
| 35 to 64 Years | 7 (1.3%) | 15 (2.3%) |
| 65 to 74 Years | 0 (0.0%) | 15 (4.4%) |
| 75 Years and over | 18 (20.2%) | 58 (37.2%) |
Disability Class: Vision Difficulty
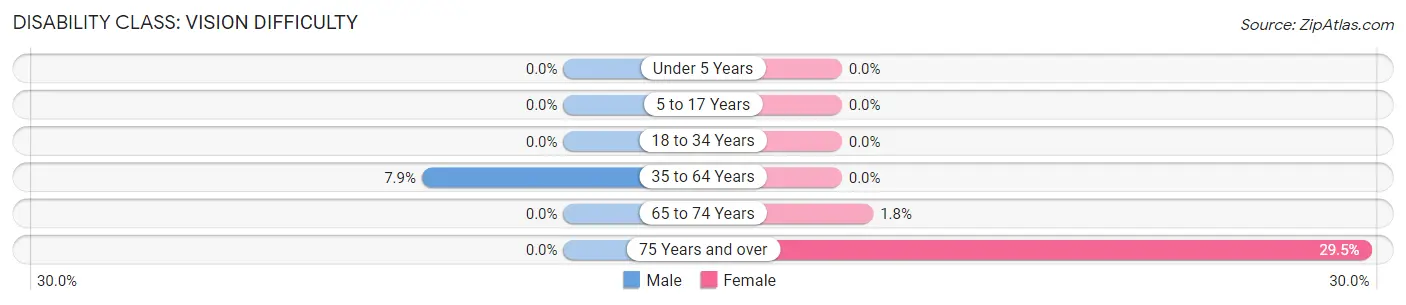
| Age Bracket | Male | Female |
| Under 5 Years | 0 (0.0%) | 0 (0.0%) |
| 5 to 17 Years | 0 (0.0%) | 0 (0.0%) |
| 18 to 34 Years | 0 (0.0%) | 0 (0.0%) |
| 35 to 64 Years | 41 (7.9%) | 0 (0.0%) |
| 65 to 74 Years | 0 (0.0%) | 6 (1.8%) |
| 75 Years and over | 0 (0.0%) | 46 (29.5%) |
Disability Class: Cognitive Difficulty
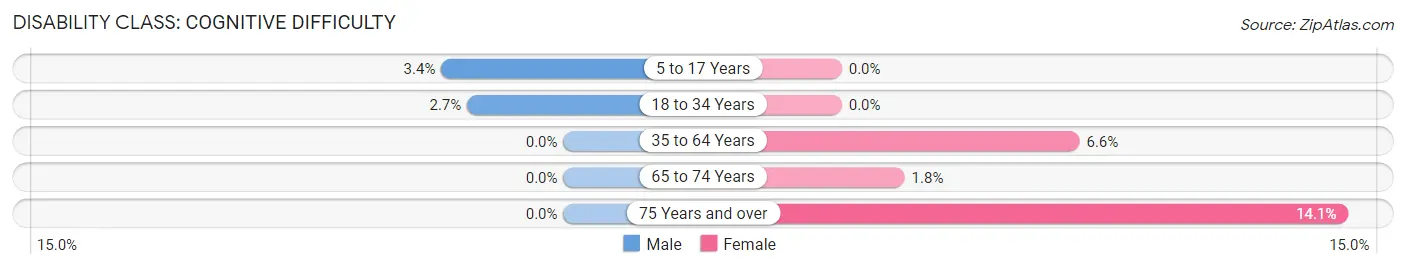
| Age Bracket | Male | Female |
| 5 to 17 Years | 15 (3.4%) | 0 (0.0%) |
| 18 to 34 Years | 3 (2.7%) | 0 (0.0%) |
| 35 to 64 Years | 0 (0.0%) | 43 (6.6%) |
| 65 to 74 Years | 0 (0.0%) | 6 (1.8%) |
| 75 Years and over | 0 (0.0%) | 22 (14.1%) |
Disability Class: Ambulatory Difficulty
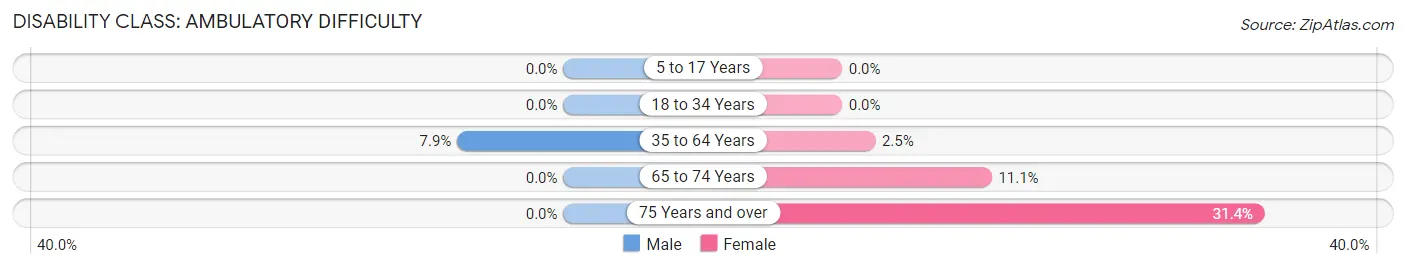
| Age Bracket | Male | Female |
| 5 to 17 Years | 0 (0.0%) | 0 (0.0%) |
| 18 to 34 Years | 0 (0.0%) | 0 (0.0%) |
| 35 to 64 Years | 41 (7.9%) | 16 (2.5%) |
| 65 to 74 Years | 0 (0.0%) | 38 (11.1%) |
| 75 Years and over | 0 (0.0%) | 49 (31.4%) |
Disability Class: Self-Care Difficulty
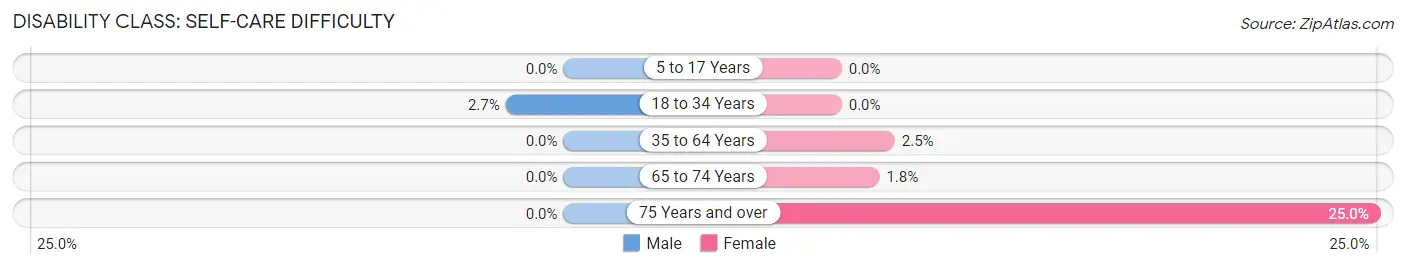
| Age Bracket | Male | Female |
| 5 to 17 Years | 0 (0.0%) | 0 (0.0%) |
| 18 to 34 Years | 3 (2.7%) | 0 (0.0%) |
| 35 to 64 Years | 0 (0.0%) | 16 (2.5%) |
| 65 to 74 Years | 0 (0.0%) | 6 (1.8%) |
| 75 Years and over | 0 (0.0%) | 39 (25.0%) |
Technology Access in Swansboro
Computing Device Access in Swansboro
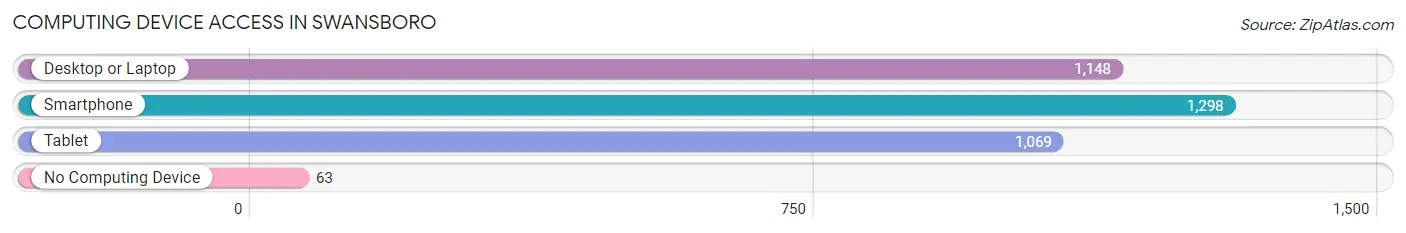
| Device Type | # Households | % Households |
| Desktop or Laptop | 1,148 | 80.7% |
| Smartphone | 1,298 | 91.2% |
| Tablet | 1,069 | 75.1% |
| No Computing Device | 63 | 4.4% |
| Total | 1,423 | 100.0% |
Internet Access in Swansboro
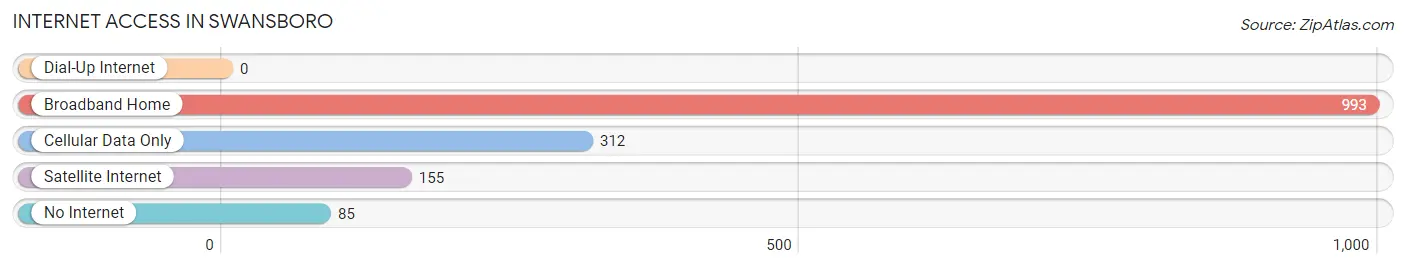
| Internet Type | # Households | % Households |
| Dial-Up Internet | 0 | 0.0% |
| Broadband Home | 993 | 69.8% |
| Cellular Data Only | 312 | 21.9% |
| Satellite Internet | 155 | 10.9% |
| No Internet | 85 | 6.0% |
| Total | 1,423 | 100.0% |
Swansboro Summary
Swansboro, North Carolina is a small town located in Onslow County, North Carolina. It is situated on the White Oak River, which is part of the Intracoastal Waterway. The town is located approximately 30 miles north of Jacksonville, North Carolina and is part of the Jacksonville Metropolitan Statistical Area. The town has a population of approximately 2,500 people and is known for its historic downtown area, which is listed on the National Register of Historic Places.
History
Swansboro was founded in 1783 by William Swan, a Revolutionary War veteran. The town was originally known as Swansborough, but the name was changed to Swansboro in 1883. The town was incorporated in 1885 and has remained a small, rural community ever since.
The town was an important port during the 19th century, and was home to a number of shipbuilding companies. The town was also home to a number of naval stores, which were used to supply ships with supplies. The town was also home to a number of fishing and oyster harvesting operations.
Geography
Swansboro is located in Onslow County, North Carolina. The town is situated on the White Oak River, which is part of the Intracoastal Waterway. The town is located approximately 30 miles north of Jacksonville, North Carolina and is part of the Jacksonville Metropolitan Statistical Area. The town has a total area of 2.2 square miles, all of which is land.
Economy
The economy of Swansboro is largely based on tourism and the service industry. The town is home to a number of restaurants, shops, and other businesses that cater to tourists. The town is also home to a number of marinas, which provide services to boaters. The town is also home to a number of boat builders and other marine-related businesses.
Demographics
As of the 2010 census, Swansboro had a population of 2,521 people. The racial makeup of the town was 87.3% White, 8.2% African American, 0.7% Native American, 0.7% Asian, 0.1% Pacific Islander, 1.2% from other races, and 1.9% from two or more races. Hispanic or Latino of any race were 3.2% of the population.
The median income for a household in the town was $41,250, and the median income for a family was $50,000. The per capita income for the town was $20,945. About 11.2% of families and 14.2% of the population were below the poverty line, including 18.2% of those under age 18 and 8.3% of those age 65 or over.
Common Questions
What is Per Capita Income in Swansboro?
Per Capita income in Swansboro is $45,028.
What is the Median Family Income in Swansboro?
Median Family Income in Swansboro is $113,384.
What is the Median Household income in Swansboro?
Median Household Income in Swansboro is $105,779.
What is Income or Wage Gap in Swansboro?
Income or Wage Gap in Swansboro is 8.1%.
Women in Swansboro earn 91.9 cents for every dollar earned by a man.
What is Inequality or Gini Index in Swansboro?
Inequality or Gini Index in Swansboro is 0.49.
What is the Total Population of Swansboro?
Total Population of Swansboro is 3,759.
What is the Total Male Population of Swansboro?
Total Male Population of Swansboro is 1,762.
What is the Total Female Population of Swansboro?
Total Female Population of Swansboro is 1,997.
What is the Ratio of Males per 100 Females in Swansboro?
There are 88.23 Males per 100 Females in Swansboro.
What is the Ratio of Females per 100 Males in Swansboro?
There are 113.34 Females per 100 Males in Swansboro.
What is the Median Population Age in Swansboro?
Median Population Age in Swansboro is 39.0 Years.
What is the Average Family Size in Swansboro
Average Family Size in Swansboro is 3.1 People.
What is the Average Household Size in Swansboro
Average Household Size in Swansboro is 2.6 People.
How Large is the Labor Force in Swansboro?
There are 1,649 People in the Labor Forcein in Swansboro.
What is the Percentage of People in the Labor Force in Swansboro?
60.4% of People are in the Labor Force in Swansboro.