Alamance, NC Map & Demographics
Alamance Map
Alamance Overview
$37,233
PER CAPITA INCOME
$110,938
AVG FAMILY INCOME
$93,309
AVG HOUSEHOLD INCOME
12.2%
WAGE / INCOME GAP [ % ]
87.8¢/ $1
WAGE / INCOME GAP [ $ ]
0.35
INEQUALITY / GINI INDEX
1,287
TOTAL POPULATION
614
MALE POPULATION
673
FEMALE POPULATION
91.23
MALES / 100 FEMALES
109.61
FEMALES / 100 MALES
40.4
MEDIAN AGE
3.5
AVG FAMILY SIZE
3.1
AVG HOUSEHOLD SIZE
570
LABOR FORCE [ PEOPLE ]
63.3%
PERCENT IN LABOR FORCE
0.2%
UNEMPLOYMENT RATE
Alamance Zip Codes
Income in Alamance
Income Overview in Alamance
Per Capita Income in Alamance is $37,233, while median incomes of families and households are $110,938 and $93,309 respectively.
| Characteristic | Number | Measure |
| Per Capita Income | 1,287 | $37,233 |
| Median Family Income | 341 | $110,938 |
| Mean Family Income | 341 | $121,360 |
| Median Household Income | 409 | $93,309 |
| Mean Household Income | 409 | $112,088 |
| Income Deficit | 341 | $0 |
| Wage / Income Gap (%) | 1,287 | 12.24% |
| Wage / Income Gap ($) | 1,287 | 87.76¢ per $1 |
| Gini / Inequality Index | 1,287 | 0.35 |
Earnings by Sex in Alamance
Average Earnings in Alamance are $58,899, $66,250 for men and $58,141 for women, a difference of 12.2%.
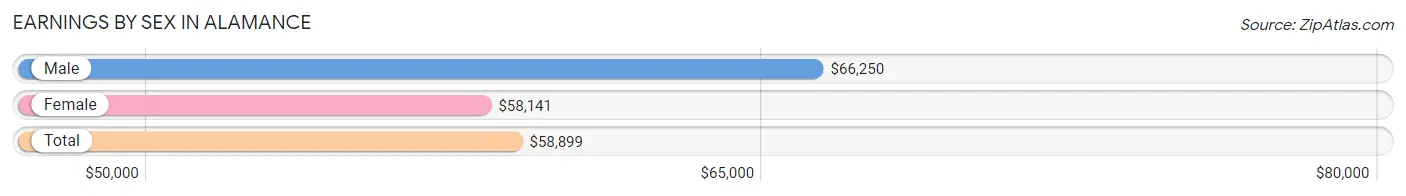
| Sex | Number | Average Earnings |
| Male | 317 (50.4%) | $66,250 |
| Female | 312 (49.6%) | $58,141 |
| Total | 629 (100.0%) | $58,899 |
Earnings by Sex by Income Bracket in Alamance
The most common earnings brackets in Alamance are $100,000+ for men (106 | 33.4%) and $55,000 to $64,999 for women (77 | 24.7%).
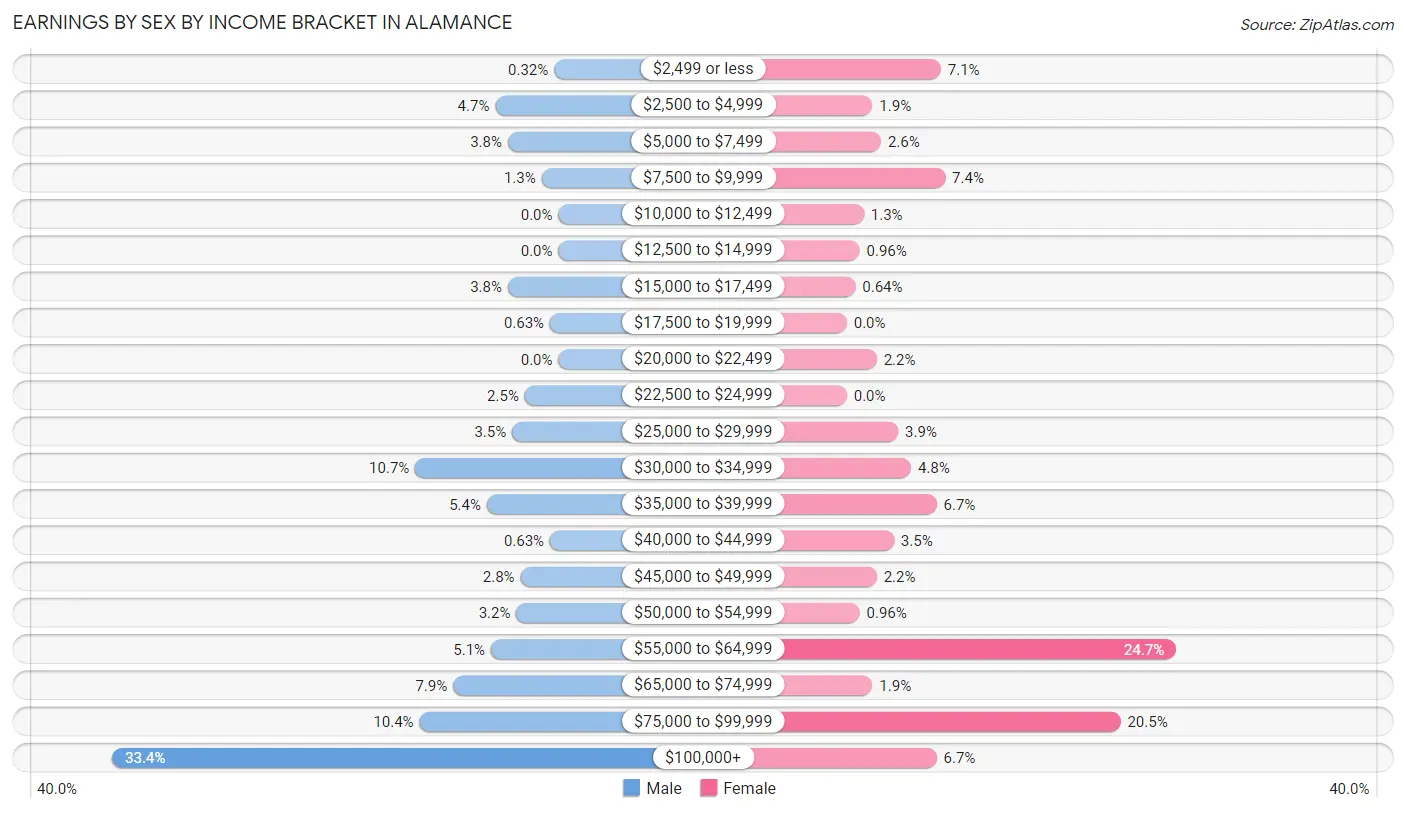
| Income | Male | Female |
| $2,499 or less | 1 (0.3%) | 22 (7.0%) |
| $2,500 to $4,999 | 15 (4.7%) | 6 (1.9%) |
| $5,000 to $7,499 | 12 (3.8%) | 8 (2.6%) |
| $7,500 to $9,999 | 4 (1.3%) | 23 (7.4%) |
| $10,000 to $12,499 | 0 (0.0%) | 4 (1.3%) |
| $12,500 to $14,999 | 0 (0.0%) | 3 (1.0%) |
| $15,000 to $17,499 | 12 (3.8%) | 2 (0.6%) |
| $17,500 to $19,999 | 2 (0.6%) | 0 (0.0%) |
| $20,000 to $22,499 | 0 (0.0%) | 7 (2.2%) |
| $22,500 to $24,999 | 8 (2.5%) | 0 (0.0%) |
| $25,000 to $29,999 | 11 (3.5%) | 12 (3.8%) |
| $30,000 to $34,999 | 34 (10.7%) | 15 (4.8%) |
| $35,000 to $39,999 | 17 (5.4%) | 21 (6.7%) |
| $40,000 to $44,999 | 2 (0.6%) | 11 (3.5%) |
| $45,000 to $49,999 | 9 (2.8%) | 7 (2.2%) |
| $50,000 to $54,999 | 10 (3.2%) | 3 (1.0%) |
| $55,000 to $64,999 | 16 (5.1%) | 77 (24.7%) |
| $65,000 to $74,999 | 25 (7.9%) | 6 (1.9%) |
| $75,000 to $99,999 | 33 (10.4%) | 64 (20.5%) |
| $100,000+ | 106 (33.4%) | 21 (6.7%) |
| Total | 317 (100.0%) | 312 (100.0%) |
Earnings by Sex by Educational Attainment in Alamance
Average earnings in Alamance are $74,375 for men and $58,974 for women, a difference of 20.7%. Men with an educational attainment of bachelor's degree enjoy the highest average annual earnings of $113,088, while those with less than high school education earn the least with $32,778. Women with an educational attainment of graduate degree earn the most with the average annual earnings of $61,016, while those with college or associate's degree education have the smallest earnings of $40,000.
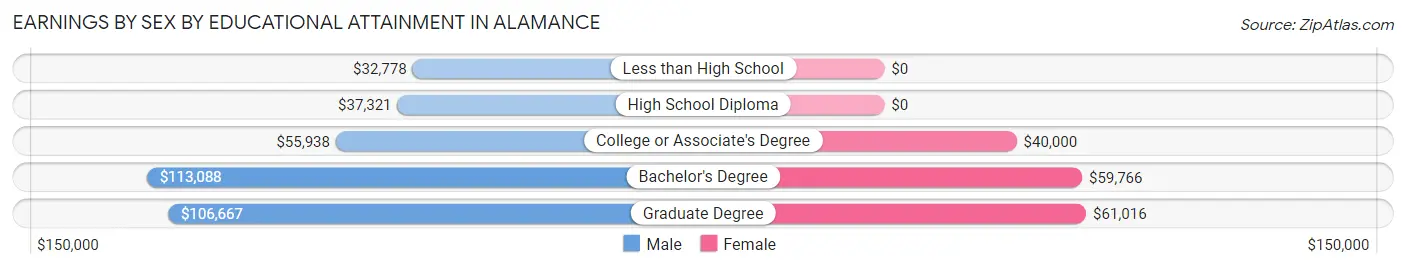
| Educational Attainment | Male Income | Female Income |
| Less than High School | $32,778 | $0 |
| High School Diploma | $37,321 | $0 |
| College or Associate's Degree | $55,938 | $40,000 |
| Bachelor's Degree | $113,088 | $59,766 |
| Graduate Degree | $106,667 | $61,016 |
| Total | $74,375 | $58,974 |
Family Income in Alamance
Family Income Brackets in Alamance
According to the Alamance family income data, there are 73 families falling into the $50,000 to $74,999 income range, which is the most common income bracket and makes up 21.4% of all families.
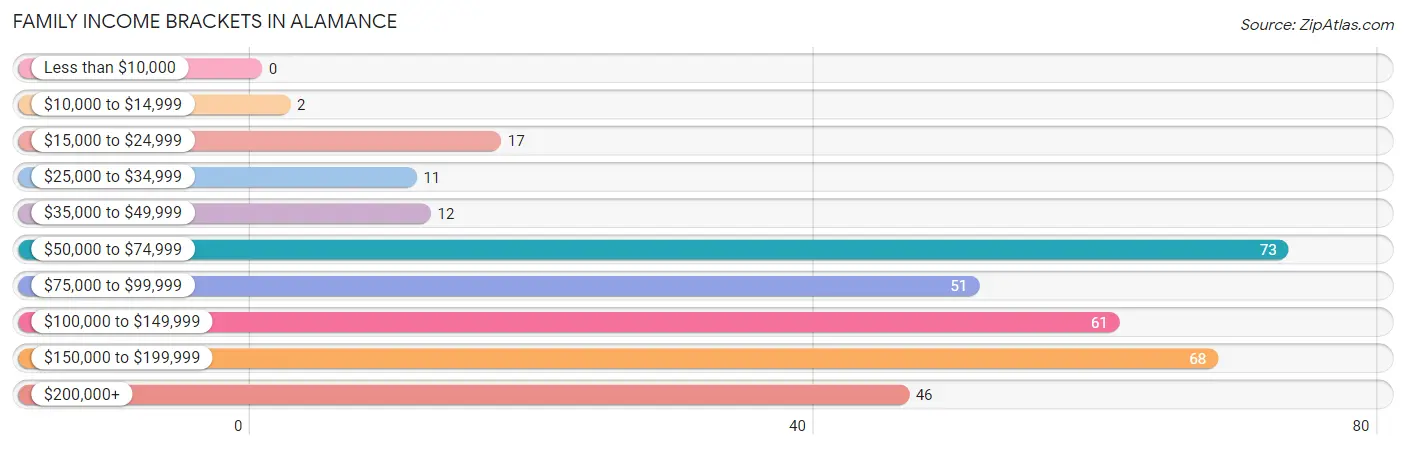
| Income Bracket | # Families | % Families |
| Less than $10,000 | 0 | 0.0% |
| $10,000 to $14,999 | 2 | 0.6% |
| $15,000 to $24,999 | 17 | 5.0% |
| $25,000 to $34,999 | 11 | 3.2% |
| $35,000 to $49,999 | 12 | 3.5% |
| $50,000 to $74,999 | 73 | 21.4% |
| $75,000 to $99,999 | 51 | 15.0% |
| $100,000 to $149,999 | 61 | 17.9% |
| $150,000 to $199,999 | 68 | 19.9% |
| $200,000+ | 46 | 13.5% |
Family Income by Famaliy Size in Alamance
5-person families (52 | 15.2%) account for the highest median family income in Alamance with $175,938 per family, while 3-person families (62 | 18.2%) have the highest median income of $38,333 per family member.
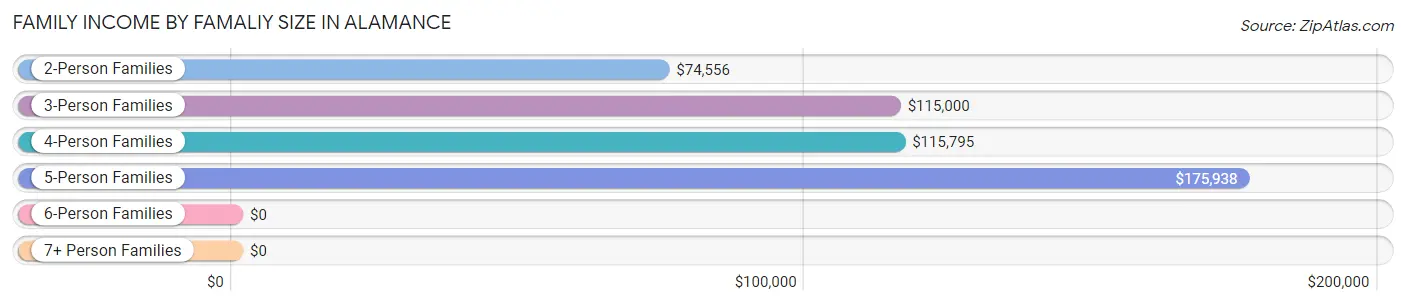
| Income Bracket | # Families | Median Income |
| 2-Person Families | 154 (45.2%) | $74,556 |
| 3-Person Families | 62 (18.2%) | $115,000 |
| 4-Person Families | 55 (16.1%) | $115,795 |
| 5-Person Families | 52 (15.2%) | $175,938 |
| 6-Person Families | 6 (1.8%) | $0 |
| 7+ Person Families | 12 (3.5%) | $0 |
| Total | 341 (100.0%) | $110,938 |
Family Income by Number of Earners in Alamance
The median family income in Alamance is $110,938, with families comprising 2 earners (144) having the highest median family income of $157,000, while families with 1 earner (89) have the lowest median family income of $73,885, accounting for 42.2% and 26.1% of families, respectively.
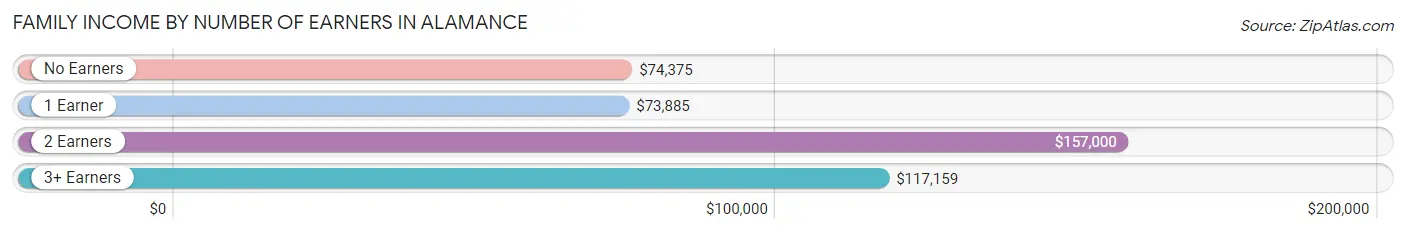
| Number of Earners | # Families | Median Income |
| No Earners | 51 (15.0%) | $74,375 |
| 1 Earner | 89 (26.1%) | $73,885 |
| 2 Earners | 144 (42.2%) | $157,000 |
| 3+ Earners | 57 (16.7%) | $117,159 |
| Total | 341 (100.0%) | $110,938 |
Household Income in Alamance
Household Income Brackets in Alamance
With 83 households falling in the category, the $50,000 to $74,999 income range is the most frequent in Alamance, accounting for 20.3% of all households. In contrast, only 4 households (1.0%) fall into the $10,000 to $14,999 income bracket, making it the least populous group.
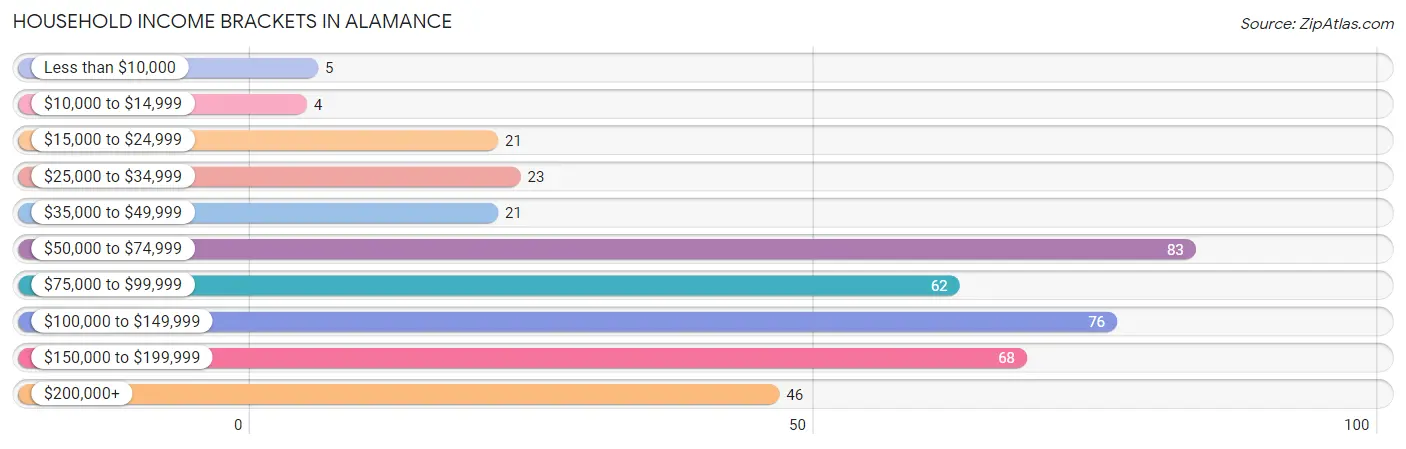
| Income Bracket | # Households | % Households |
| Less than $10,000 | 5 | 1.2% |
| $10,000 to $14,999 | 4 | 1.0% |
| $15,000 to $24,999 | 21 | 5.1% |
| $25,000 to $34,999 | 23 | 5.6% |
| $35,000 to $49,999 | 21 | 5.1% |
| $50,000 to $74,999 | 83 | 20.3% |
| $75,000 to $99,999 | 62 | 15.2% |
| $100,000 to $149,999 | 76 | 18.6% |
| $150,000 to $199,999 | 68 | 16.6% |
| $200,000+ | 46 | 11.2% |
Household Income by Householder Age in Alamance
The median household income in Alamance is $93,309, with the highest median household income of $155,000 found in the 25 to 44 years age bracket for the primary householder. A total of 112 households (27.4%) fall into this category. Meanwhile, the 15 to 24 years age bracket for the primary householder has the lowest median household income of $0, with 3 households (0.7%) in this group.
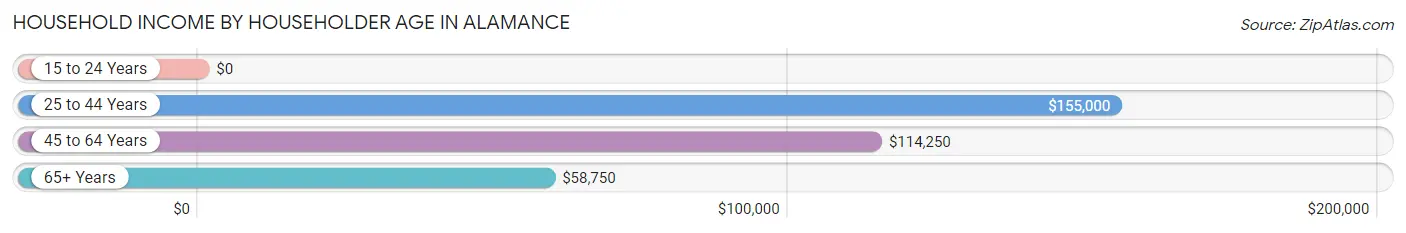
| Income Bracket | # Households | Median Income |
| 15 to 24 Years | 3 (0.7%) | $0 |
| 25 to 44 Years | 112 (27.4%) | $155,000 |
| 45 to 64 Years | 193 (47.2%) | $114,250 |
| 65+ Years | 101 (24.7%) | $58,750 |
| Total | 409 (100.0%) | $93,309 |
Poverty in Alamance
Income Below Poverty by Sex and Age in Alamance
With 9.2% poverty level for males and 8.2% for females among the residents of Alamance, 5 year old males and 25 to 34 year old females are the most vulnerable to poverty, with 7 males (100.0%) and 7 females (25.0%) in their respective age groups living below the poverty level.
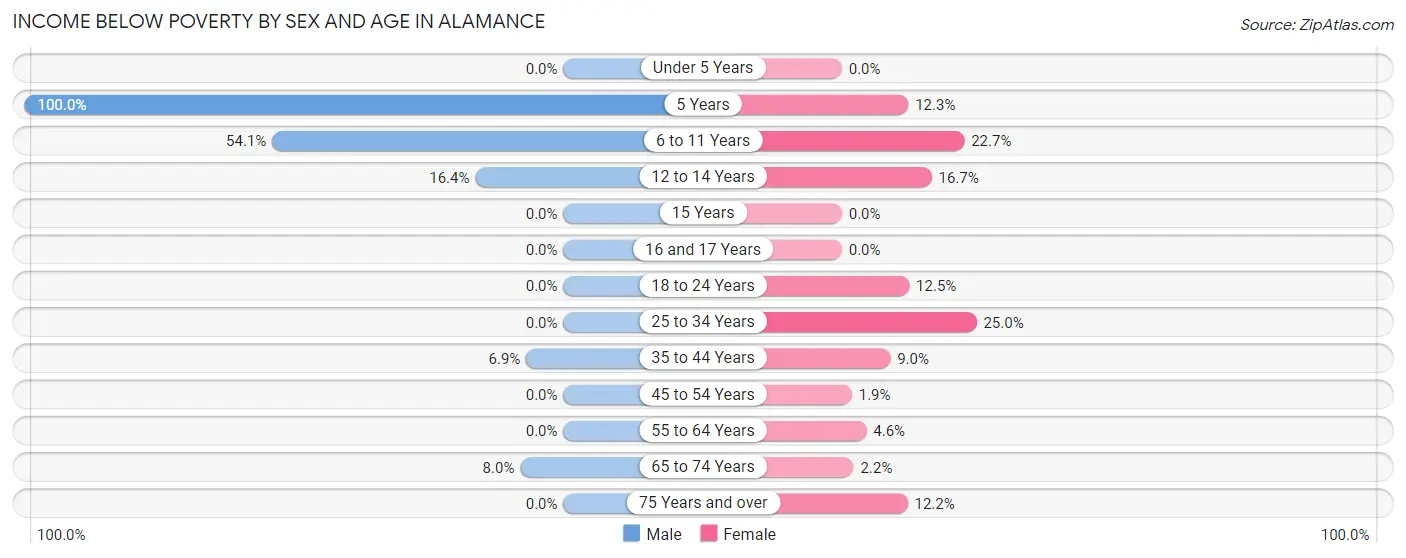
| Age Bracket | Male | Female |
| Under 5 Years | 0 (0.0%) | 0 (0.0%) |
| 5 Years | 7 (100.0%) | 9 (12.3%) |
| 6 to 11 Years | 20 (54.0%) | 10 (22.7%) |
| 12 to 14 Years | 17 (16.4%) | 7 (16.7%) |
| 15 Years | 0 (0.0%) | 0 (0.0%) |
| 16 and 17 Years | 0 (0.0%) | 0 (0.0%) |
| 18 to 24 Years | 0 (0.0%) | 3 (12.5%) |
| 25 to 34 Years | 0 (0.0%) | 7 (25.0%) |
| 35 to 44 Years | 8 (6.9%) | 8 (9.0%) |
| 45 to 54 Years | 0 (0.0%) | 2 (1.8%) |
| 55 to 64 Years | 0 (0.0%) | 2 (4.5%) |
| 65 to 74 Years | 4 (8.0%) | 2 (2.2%) |
| 75 Years and over | 0 (0.0%) | 5 (12.2%) |
| Total | 56 (9.2%) | 55 (8.2%) |
Income Above Poverty by Sex and Age in Alamance
According to the poverty statistics in Alamance, males aged under 5 years and females aged under 5 years are the age groups that are most secure financially, with 100.0% of males and 100.0% of females in these age groups living above the poverty line.
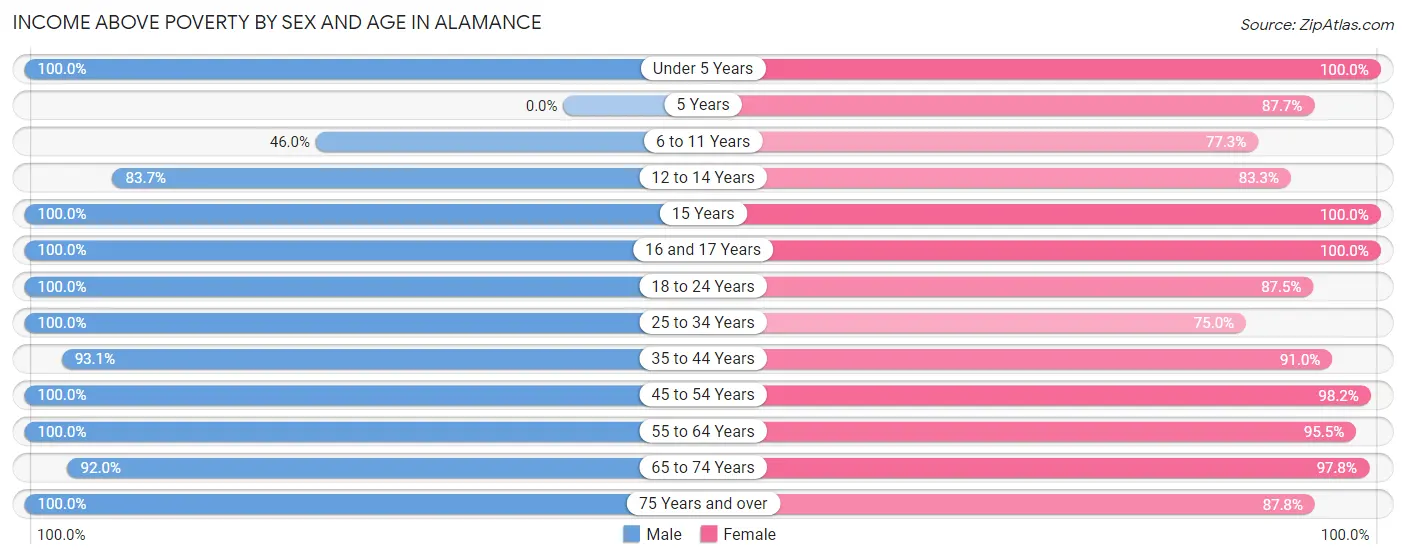
| Age Bracket | Male | Female |
| Under 5 Years | 6 (100.0%) | 7 (100.0%) |
| 5 Years | 0 (0.0%) | 64 (87.7%) |
| 6 to 11 Years | 17 (46.0%) | 34 (77.3%) |
| 12 to 14 Years | 87 (83.7%) | 35 (83.3%) |
| 15 Years | 2 (100.0%) | 57 (100.0%) |
| 16 and 17 Years | 7 (100.0%) | 25 (100.0%) |
| 18 to 24 Years | 53 (100.0%) | 21 (87.5%) |
| 25 to 34 Years | 37 (100.0%) | 21 (75.0%) |
| 35 to 44 Years | 108 (93.1%) | 81 (91.0%) |
| 45 to 54 Years | 68 (100.0%) | 106 (98.2%) |
| 55 to 64 Years | 105 (100.0%) | 42 (95.5%) |
| 65 to 74 Years | 46 (92.0%) | 89 (97.8%) |
| 75 Years and over | 14 (100.0%) | 36 (87.8%) |
| Total | 550 (90.8%) | 618 (91.8%) |
Income Below Poverty Among Married-Couple Families in Alamance
The poverty statistics for married-couple families in Alamance show that 4.1% or 12 of the total 294 families live below the poverty line. Families with 5 or more children have the highest poverty rate of 66.7%, comprising of 8 families. On the other hand, families with 1 or 2 children have the lowest poverty rate of 0.0%, which includes 0 families.
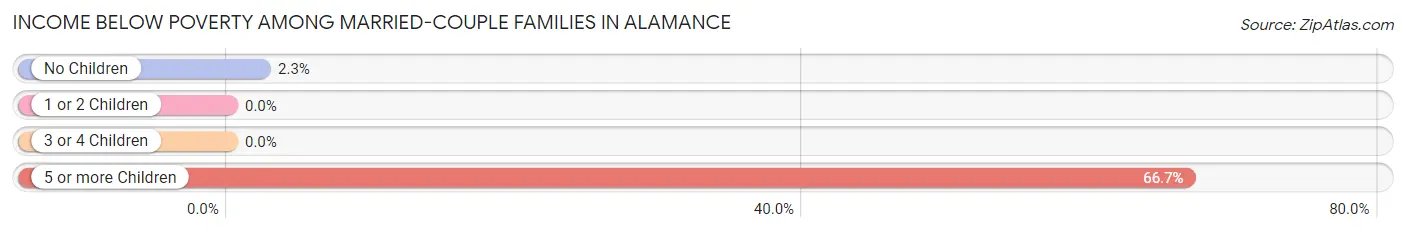
| Children | Above Poverty | Below Poverty |
| No Children | 170 (97.7%) | 4 (2.3%) |
| 1 or 2 Children | 66 (100.0%) | 0 (0.0%) |
| 3 or 4 Children | 42 (100.0%) | 0 (0.0%) |
| 5 or more Children | 4 (33.3%) | 8 (66.7%) |
| Total | 282 (95.9%) | 12 (4.1%) |
Income Below Poverty Among Single-Parent Households in Alamance
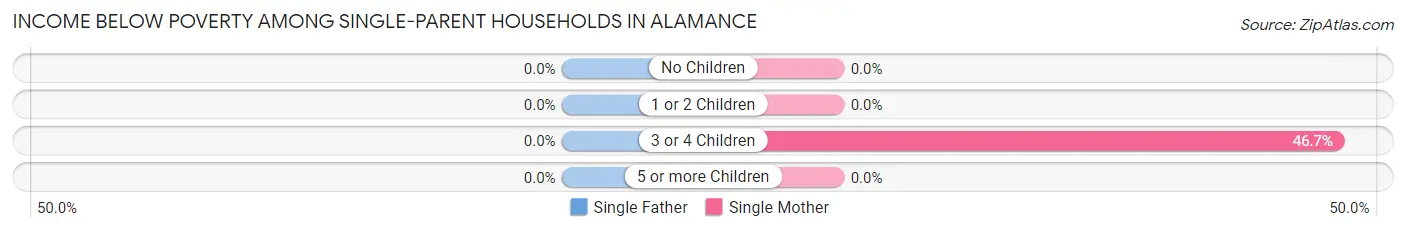
| Children | Single Father | Single Mother |
| No Children | 0 (0.0%) | 0 (0.0%) |
| 1 or 2 Children | 0 (0.0%) | 0 (0.0%) |
| 3 or 4 Children | 0 (0.0%) | 7 (46.7%) |
| 5 or more Children | 0 (0.0%) | 0 (0.0%) |
| Total | 0 (0.0%) | 7 (21.2%) |
Income Below Poverty Among Married-Couple vs Single-Parent Households in Alamance
The poverty data for Alamance shows that 12 of the married-couple family households (4.1%) and 7 of the single-parent households (14.9%) are living below the poverty level. Within the married-couple family households, those with 5 or more children have the highest poverty rate, with 8 households (66.7%) falling below the poverty line. Among the single-parent households, those with 3 or 4 children have the highest poverty rate, with 7 household (46.7%) living below poverty.
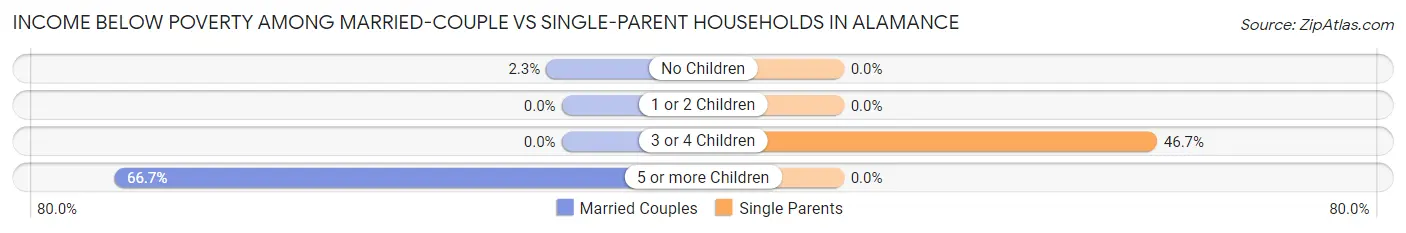
| Children | Married-Couple Families | Single-Parent Households |
| No Children | 4 (2.3%) | 0 (0.0%) |
| 1 or 2 Children | 0 (0.0%) | 0 (0.0%) |
| 3 or 4 Children | 0 (0.0%) | 7 (46.7%) |
| 5 or more Children | 8 (66.7%) | 0 (0.0%) |
| Total | 12 (4.1%) | 7 (14.9%) |
Race in Alamance
The most populous races in Alamance are White / Caucasian (1,053 | 81.8%), Hispanic or Latino (167 | 13.0%), and Two or more Races (116 | 9.0%).
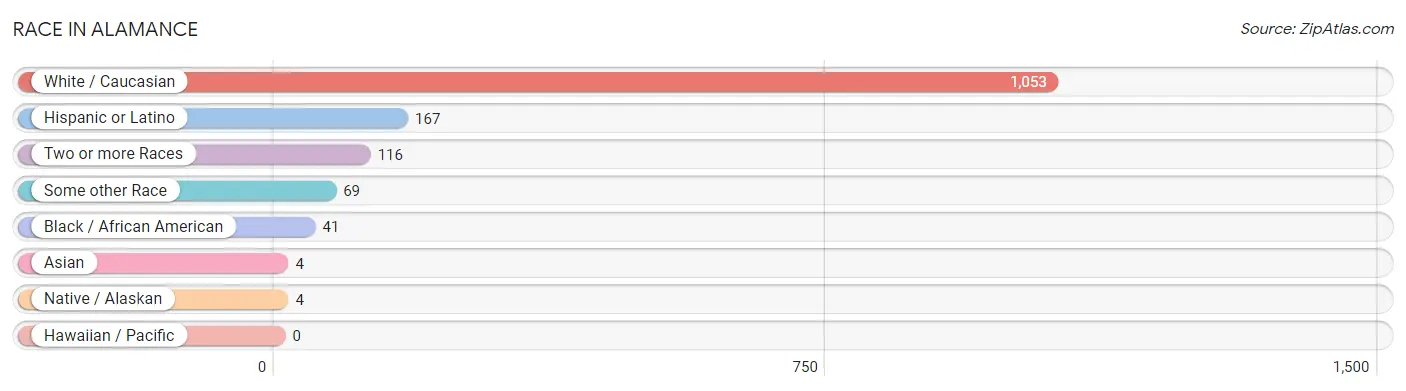
| Race | # Population | % Population |
| Asian | 4 | 0.3% |
| Black / African American | 41 | 3.2% |
| Hawaiian / Pacific | 0 | 0.0% |
| Hispanic or Latino | 167 | 13.0% |
| Native / Alaskan | 4 | 0.3% |
| White / Caucasian | 1,053 | 81.8% |
| Two or more Races | 116 | 9.0% |
| Some other Race | 69 | 5.4% |
| Total | 1,287 | 100.0% |
Ancestry in Alamance
The most populous ancestries reported in Alamance are English (127 | 9.9%), German (120 | 9.3%), Puerto Rican (83 | 6.5%), European (75 | 5.8%), and Italian (71 | 5.5%), together accounting for 37.0% of all Alamance residents.
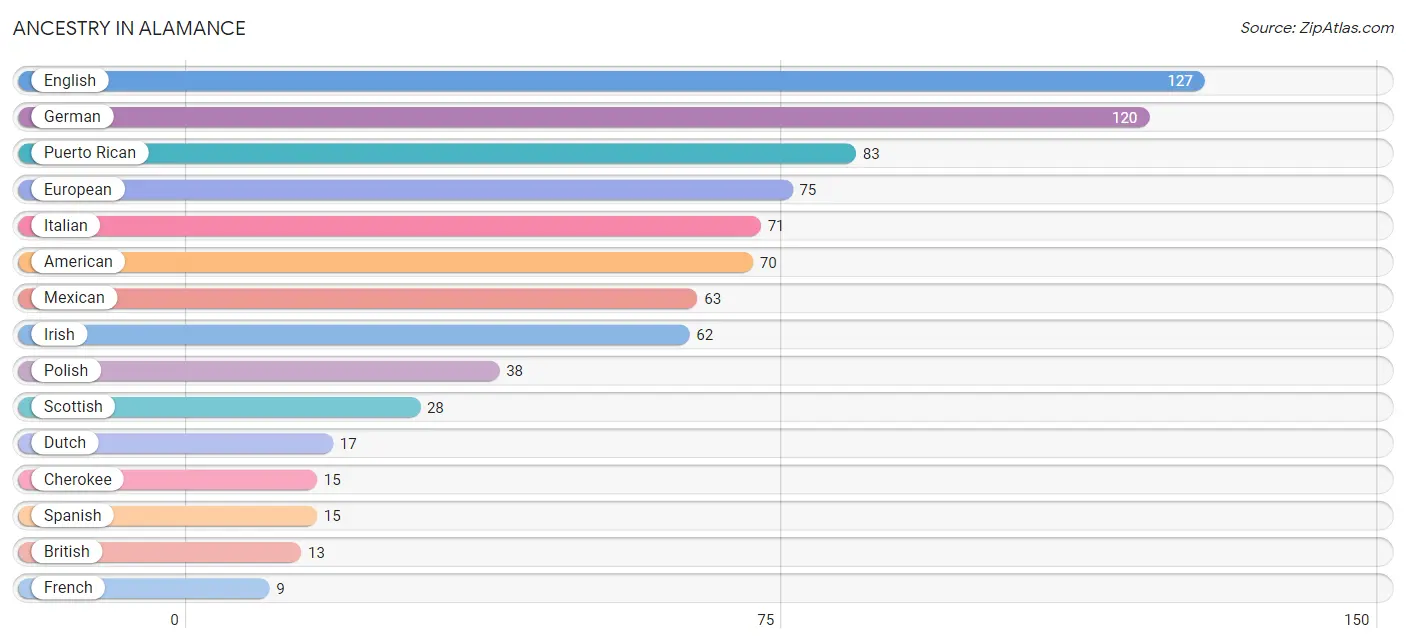
| Ancestry | # Population | % Population |
| African | 2 | 0.2% |
| American | 70 | 5.4% |
| Arab | 5 | 0.4% |
| British | 13 | 1.0% |
| Central American | 4 | 0.3% |
| Cherokee | 15 | 1.2% |
| Cuban | 2 | 0.2% |
| Dutch | 17 | 1.3% |
| Eastern European | 2 | 0.2% |
| English | 127 | 9.9% |
| European | 75 | 5.8% |
| Finnish | 4 | 0.3% |
| French | 9 | 0.7% |
| French Canadian | 2 | 0.2% |
| German | 120 | 9.3% |
| Indian (Asian) | 4 | 0.3% |
| Irish | 62 | 4.8% |
| Italian | 71 | 5.5% |
| Mexican | 63 | 4.9% |
| Nicaraguan | 4 | 0.3% |
| Northern European | 3 | 0.2% |
| Polish | 38 | 2.9% |
| Puerto Rican | 83 | 6.5% |
| Scotch-Irish | 5 | 0.4% |
| Scottish | 28 | 2.2% |
| Spanish | 15 | 1.2% |
| Subsaharan African | 2 | 0.2% |
| Swedish | 3 | 0.2% |
| Swiss | 2 | 0.2% |
| Syrian | 3 | 0.2% |
| Welsh | 8 | 0.6% | View All 31 Rows |
Immigrants in Alamance
The most numerous immigrant groups reported in Alamance came from Central America (19 | 1.5%), Latin America (19 | 1.5%), Mexico (15 | 1.2%), Canada (13 | 1.0%), and Asia (8 | 0.6%), together accounting for 5.8% of all Alamance residents.
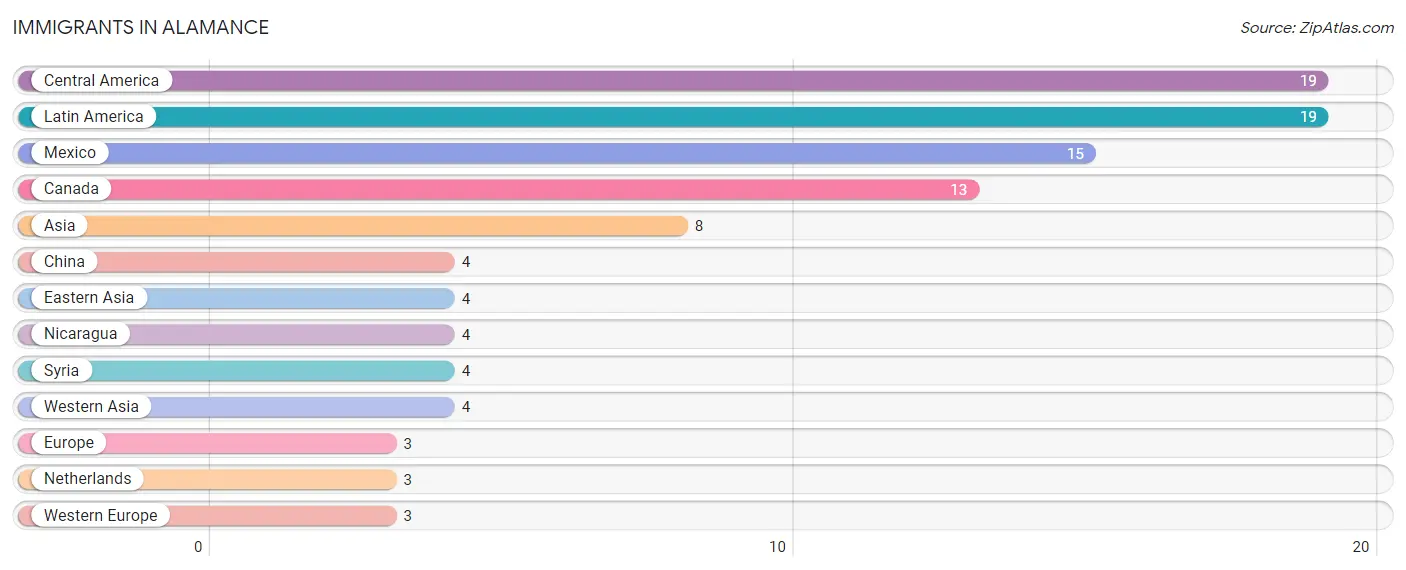
| Immigration Origin | # Population | % Population |
| Asia | 8 | 0.6% |
| Canada | 13 | 1.0% |
| Central America | 19 | 1.5% |
| China | 4 | 0.3% |
| Eastern Asia | 4 | 0.3% |
| Europe | 3 | 0.2% |
| Latin America | 19 | 1.5% |
| Mexico | 15 | 1.2% |
| Netherlands | 3 | 0.2% |
| Nicaragua | 4 | 0.3% |
| Syria | 4 | 0.3% |
| Western Asia | 4 | 0.3% |
| Western Europe | 3 | 0.2% | View All 13 Rows |
Sex and Age in Alamance
Sex and Age in Alamance
The most populous age groups in Alamance are 10 to 14 Years (143 | 23.3%) for men and 5 to 9 Years (103 | 15.3%) for women.
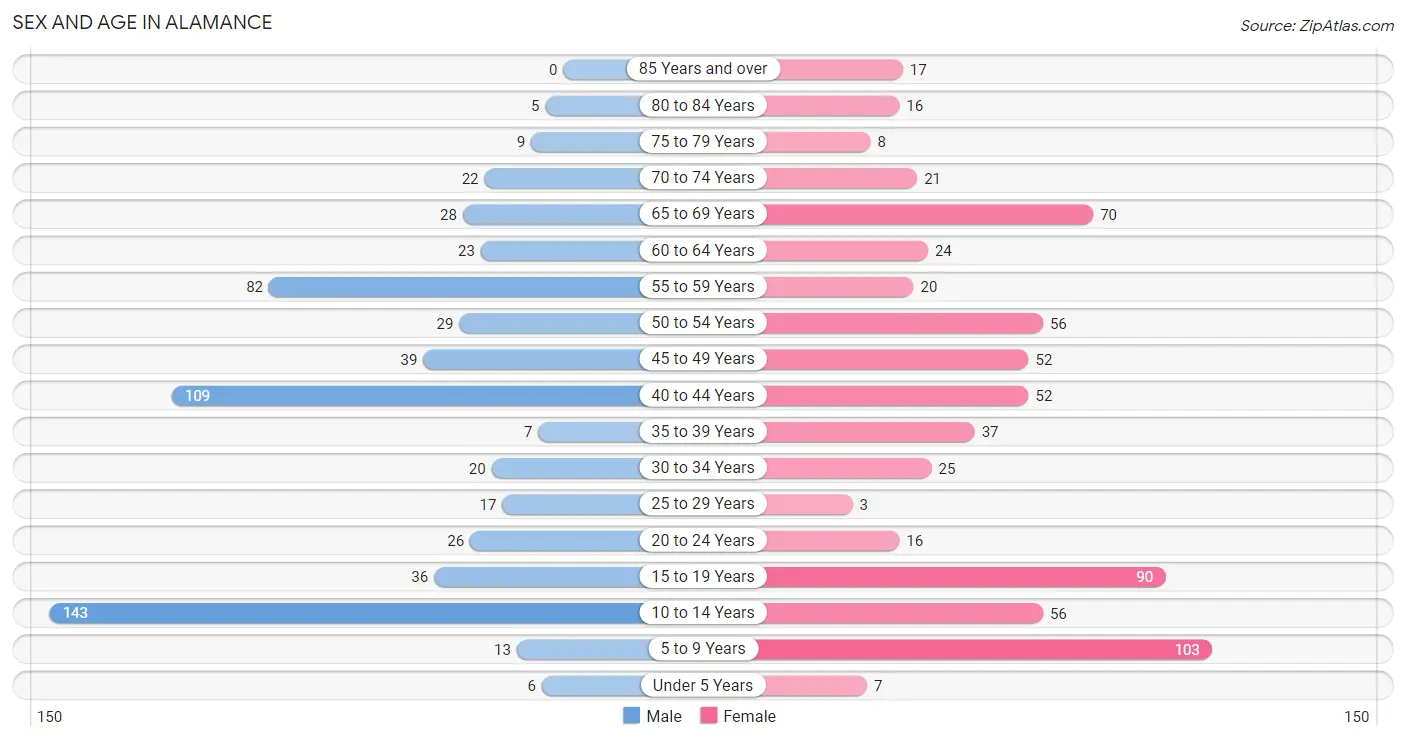
| Age Bracket | Male | Female |
| Under 5 Years | 6 (1.0%) | 7 (1.0%) |
| 5 to 9 Years | 13 (2.1%) | 103 (15.3%) |
| 10 to 14 Years | 143 (23.3%) | 56 (8.3%) |
| 15 to 19 Years | 36 (5.9%) | 90 (13.4%) |
| 20 to 24 Years | 26 (4.2%) | 16 (2.4%) |
| 25 to 29 Years | 17 (2.8%) | 3 (0.4%) |
| 30 to 34 Years | 20 (3.3%) | 25 (3.7%) |
| 35 to 39 Years | 7 (1.1%) | 37 (5.5%) |
| 40 to 44 Years | 109 (17.7%) | 52 (7.7%) |
| 45 to 49 Years | 39 (6.4%) | 52 (7.7%) |
| 50 to 54 Years | 29 (4.7%) | 56 (8.3%) |
| 55 to 59 Years | 82 (13.4%) | 20 (3.0%) |
| 60 to 64 Years | 23 (3.7%) | 24 (3.6%) |
| 65 to 69 Years | 28 (4.6%) | 70 (10.4%) |
| 70 to 74 Years | 22 (3.6%) | 21 (3.1%) |
| 75 to 79 Years | 9 (1.5%) | 8 (1.2%) |
| 80 to 84 Years | 5 (0.8%) | 16 (2.4%) |
| 85 Years and over | 0 (0.0%) | 17 (2.5%) |
| Total | 614 (100.0%) | 673 (100.0%) |
Families and Households in Alamance
Median Family Size in Alamance
The median family size in Alamance is 3.51 persons per family, with single female/mother families (33 | 9.7%) accounting for the largest median family size of 3.82 persons per family. On the other hand, single male/father families (14 | 4.1%) represent the smallest median family size with 3.07 persons per family.
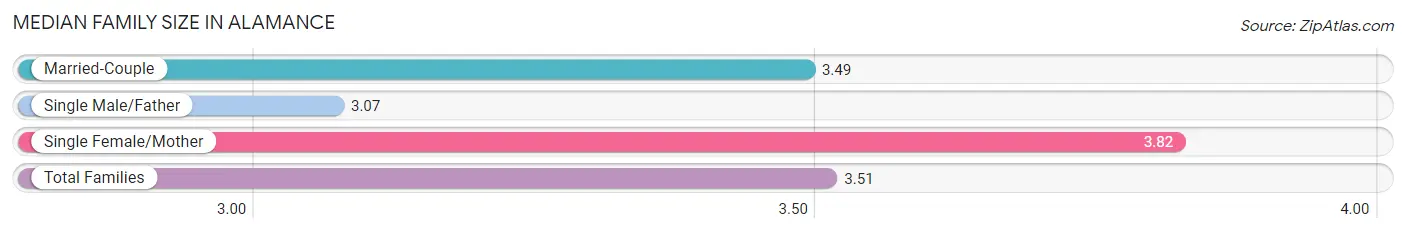
| Family Type | # Families | Family Size |
| Married-Couple | 294 (86.2%) | 3.49 |
| Single Male/Father | 14 (4.1%) | 3.07 |
| Single Female/Mother | 33 (9.7%) | 3.82 |
| Total Families | 341 (100.0%) | 3.51 |
Median Household Size in Alamance
The median household size in Alamance is 3.15 persons per household, with single female/mother households (33 | 8.1%) accounting for the largest median household size of 3.82 persons per household. non-family households (68 | 16.6%) represent the smallest median household size with 1.12 persons per household.
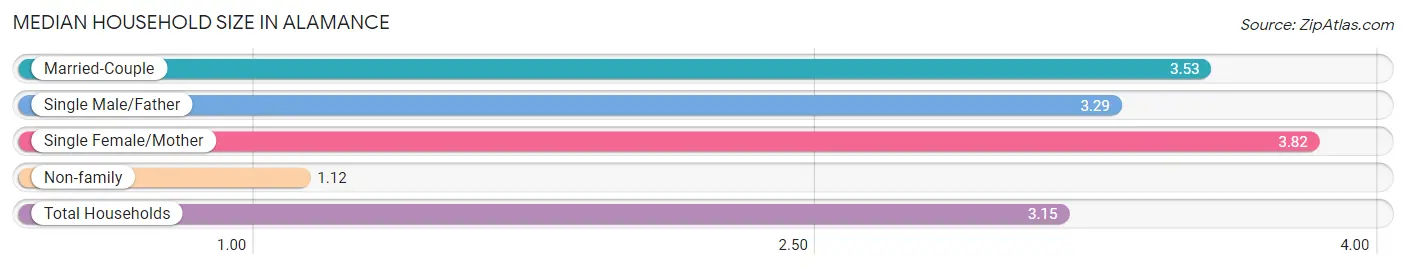
| Household Type | # Households | Household Size |
| Married-Couple | 294 (71.9%) | 3.53 |
| Single Male/Father | 14 (3.4%) | 3.29 |
| Single Female/Mother | 33 (8.1%) | 3.82 |
| Non-family | 68 (16.6%) | 1.12 |
| Total Households | 409 (100.0%) | 3.15 |
Household Size by Marriage Status in Alamance
Out of a total of 409 households in Alamance, 341 (83.4%) are family households, while 68 (16.6%) are nonfamily households. The most numerous type of family households are 2-person households, comprising 154, and the most common type of nonfamily households are 1-person households, comprising 60.
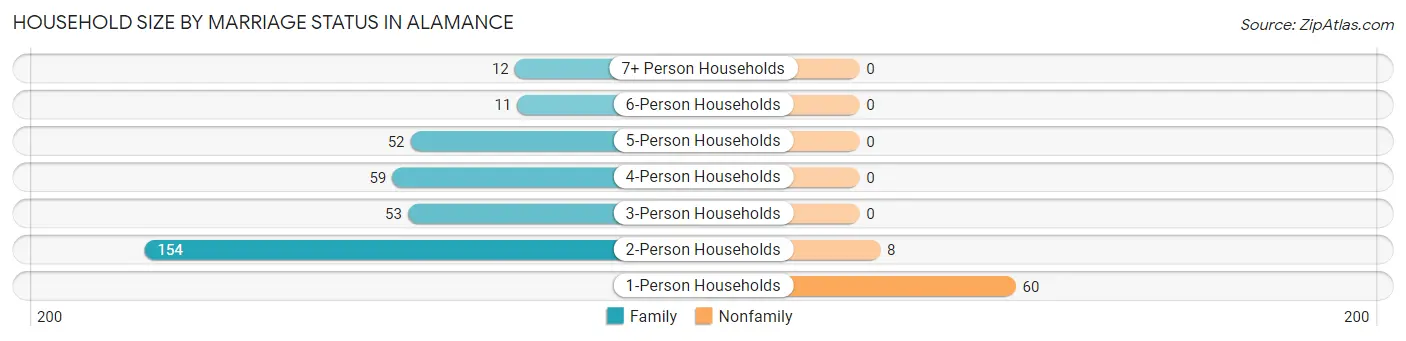
| Household Size | Family Households | Nonfamily Households |
| 1-Person Households | - | 60 (14.7%) |
| 2-Person Households | 154 (37.7%) | 8 (2.0%) |
| 3-Person Households | 53 (13.0%) | 0 (0.0%) |
| 4-Person Households | 59 (14.4%) | 0 (0.0%) |
| 5-Person Households | 52 (12.7%) | 0 (0.0%) |
| 6-Person Households | 11 (2.7%) | 0 (0.0%) |
| 7+ Person Households | 12 (2.9%) | 0 (0.0%) |
| Total | 341 (83.4%) | 68 (16.6%) |
Female Fertility in Alamance
Fertility by Age in Alamance
Average fertility rate in Alamance is 7.0 births per 1,000 women. Women in the age bracket of 20 to 34 years have the highest fertility rate with 45.0 births per 1,000 women. Women in the age bracket of 20 to 34 years acount for 100.0% of all women with births.
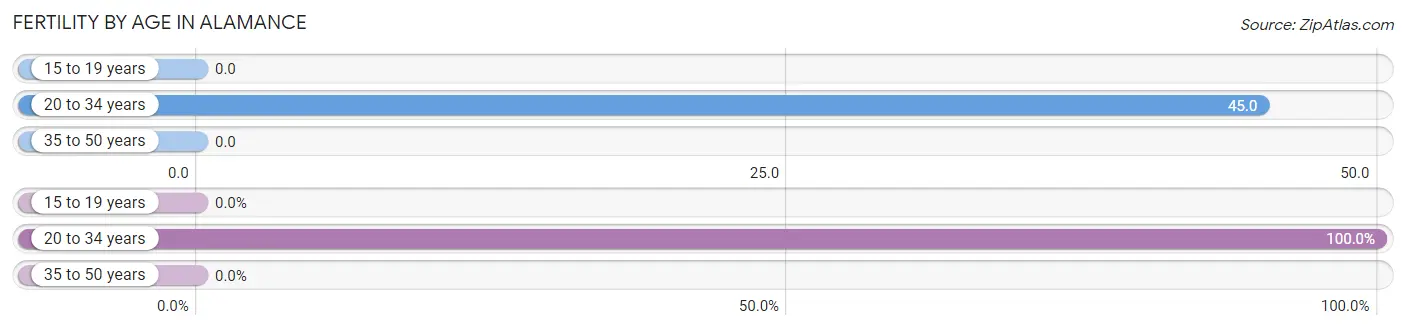
| Age Bracket | Women with Births | Births / 1,000 Women |
| 15 to 19 years | 0 (0.0%) | 0.0 |
| 20 to 34 years | 2 (100.0%) | 45.0 |
| 35 to 50 years | 0 (0.0%) | 0.0 |
| Total | 2 (100.0%) | 7.0 |
Fertility by Age by Marriage Status in Alamance
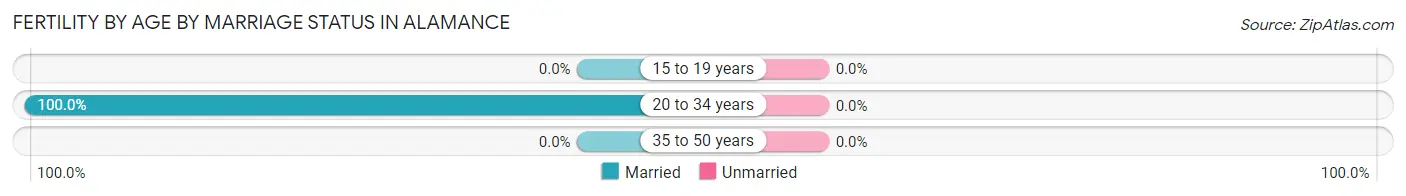
| Age Bracket | Married | Unmarried |
| 15 to 19 years | 0 (0.0%) | 0 (0.0%) |
| 20 to 34 years | 2 (100.0%) | 0 (0.0%) |
| 35 to 50 years | 0 (0.0%) | 0 (0.0%) |
| Total | 2 (100.0%) | 0 (0.0%) |
Fertility by Education in Alamance
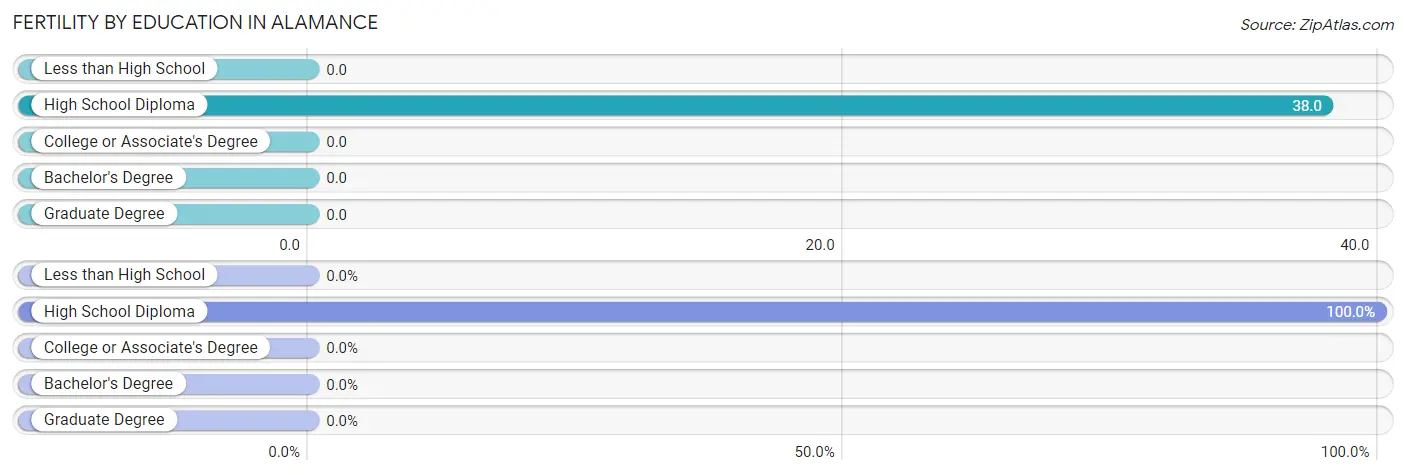
| Educational Attainment | Women with Births | Births / 1,000 Women |
| Less than High School | 0 (0.0%) | 0.0 |
| High School Diploma | 2 (100.0%) | 38.0 |
| College or Associate's Degree | 0 (0.0%) | 0.0 |
| Bachelor's Degree | 0 (0.0%) | 0.0 |
| Graduate Degree | 0 (0.0%) | 0.0 |
| Total | 2 (100.0%) | 7.0 |
Fertility by Education by Marriage Status in Alamance
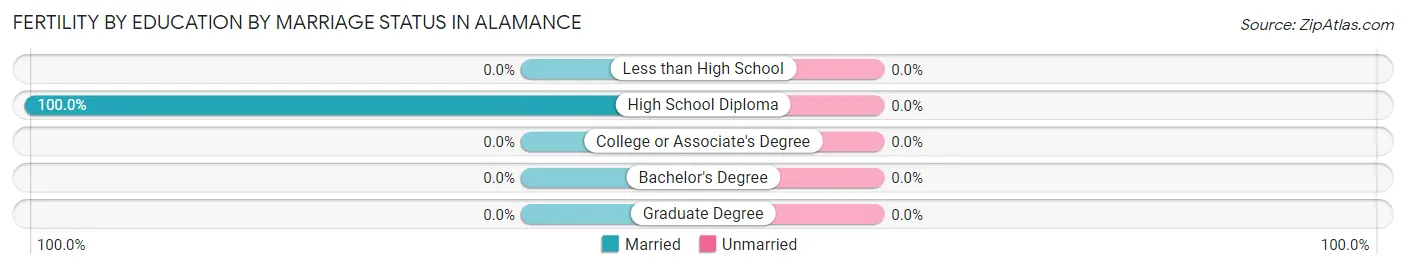
| Educational Attainment | Married | Unmarried |
| Less than High School | 0 (0.0%) | 0 (0.0%) |
| High School Diploma | 2 (100.0%) | 0 (0.0%) |
| College or Associate's Degree | 0 (0.0%) | 0 (0.0%) |
| Bachelor's Degree | 0 (0.0%) | 0 (0.0%) |
| Graduate Degree | 0 (0.0%) | 0 (0.0%) |
| Total | 2 (100.0%) | 0 (0.0%) |
Employment Characteristics in Alamance
Employment by Class of Employer in Alamance
Among the 559 employed individuals in Alamance, private company employees (354 | 63.3%), not-for-profit organizations (68 | 12.2%), and state government employees (54 | 9.7%) make up the most common classes of employment.
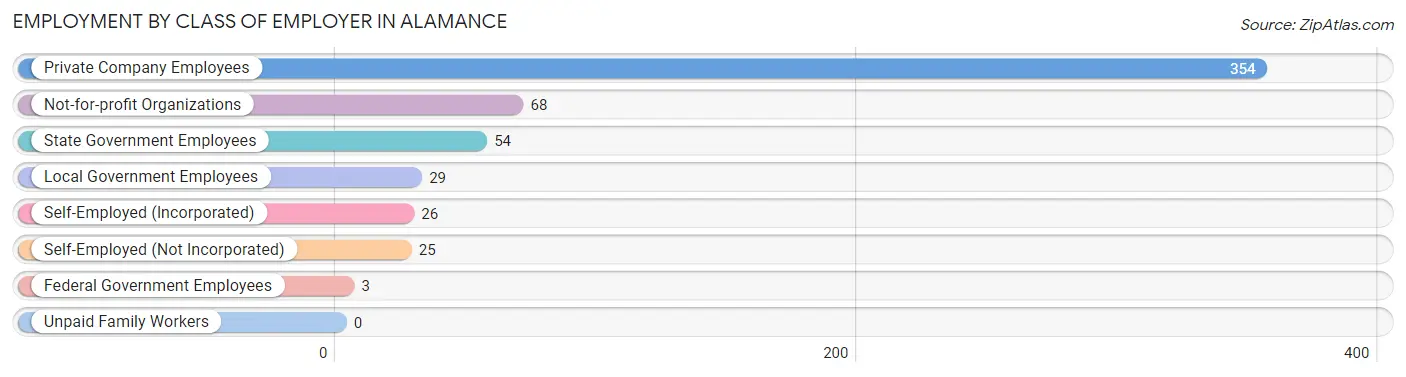
| Employer Class | # Employees | % Employees |
| Private Company Employees | 354 | 63.3% |
| Self-Employed (Incorporated) | 26 | 4.6% |
| Self-Employed (Not Incorporated) | 25 | 4.5% |
| Not-for-profit Organizations | 68 | 12.2% |
| Local Government Employees | 29 | 5.2% |
| State Government Employees | 54 | 9.7% |
| Federal Government Employees | 3 | 0.5% |
| Unpaid Family Workers | 0 | 0.0% |
| Total | 559 | 100.0% |
Employment Status by Age in Alamance
According to the labor force statistics for Alamance, out of the total population over 16 years of age (900), 63.3% or 570 individuals are in the labor force, with 0.2% or 1 of them unemployed. The age group with the highest labor force participation rate is 35 to 44 years, with 95.1% or 195 individuals in the labor force. Within the labor force, the 16 to 19 years age range has the highest percentage of unemployed individuals, with 4.5% or 1 of them being unemployed.
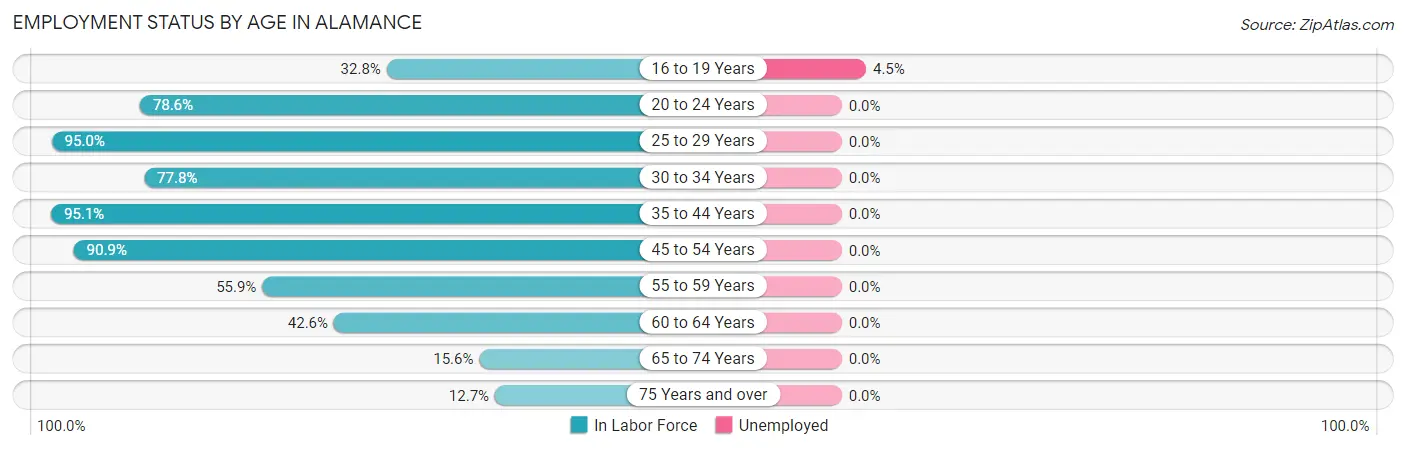
| Age Bracket | In Labor Force | Unemployed |
| 16 to 19 Years | 22 (32.8%) | 1 (4.5%) |
| 20 to 24 Years | 33 (78.6%) | 0 (0.0%) |
| 25 to 29 Years | 19 (95.0%) | 0 (0.0%) |
| 30 to 34 Years | 35 (77.8%) | 0 (0.0%) |
| 35 to 44 Years | 195 (95.1%) | 0 (0.0%) |
| 45 to 54 Years | 160 (90.9%) | 0 (0.0%) |
| 55 to 59 Years | 57 (55.9%) | 0 (0.0%) |
| 60 to 64 Years | 20 (42.6%) | 0 (0.0%) |
| 65 to 74 Years | 22 (15.6%) | 0 (0.0%) |
| 75 Years and over | 7 (12.7%) | 0 (0.0%) |
| Total | 570 (63.3%) | 1 (0.2%) |
Employment Status by Educational Attainment in Alamance
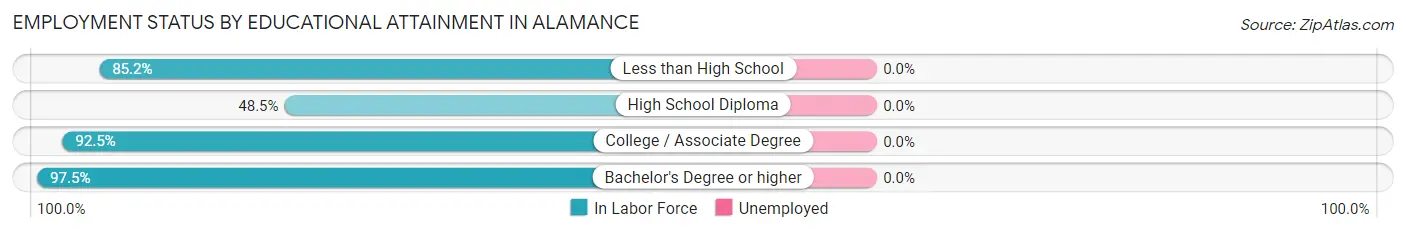
| Educational Attainment | In Labor Force | Unemployed |
| Less than High School | 23 (85.2%) | 0 (0.0%) |
| High School Diploma | 82 (48.5%) | 0 (0.0%) |
| College / Associate Degree | 149 (92.5%) | 0 (0.0%) |
| Bachelor's Degree or higher | 232 (97.5%) | 0 (0.0%) |
| Total | 486 (81.7%) | 0 (0.0%) |
Employment Occupations by Sex in Alamance
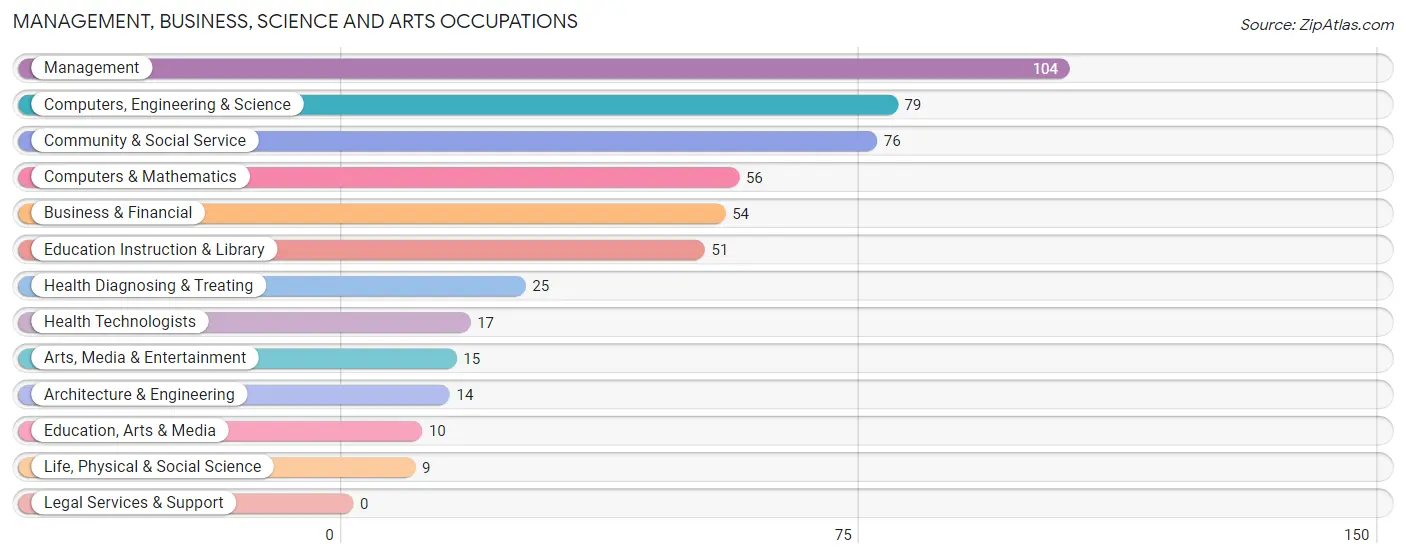
Management, Business, Science and Arts Occupations
The most common Management, Business, Science and Arts occupations in Alamance are Management (104 | 18.3%), Computers, Engineering & Science (79 | 13.9%), Community & Social Service (76 | 13.4%), Computers & Mathematics (56 | 9.8%), and Business & Financial (54 | 9.5%).
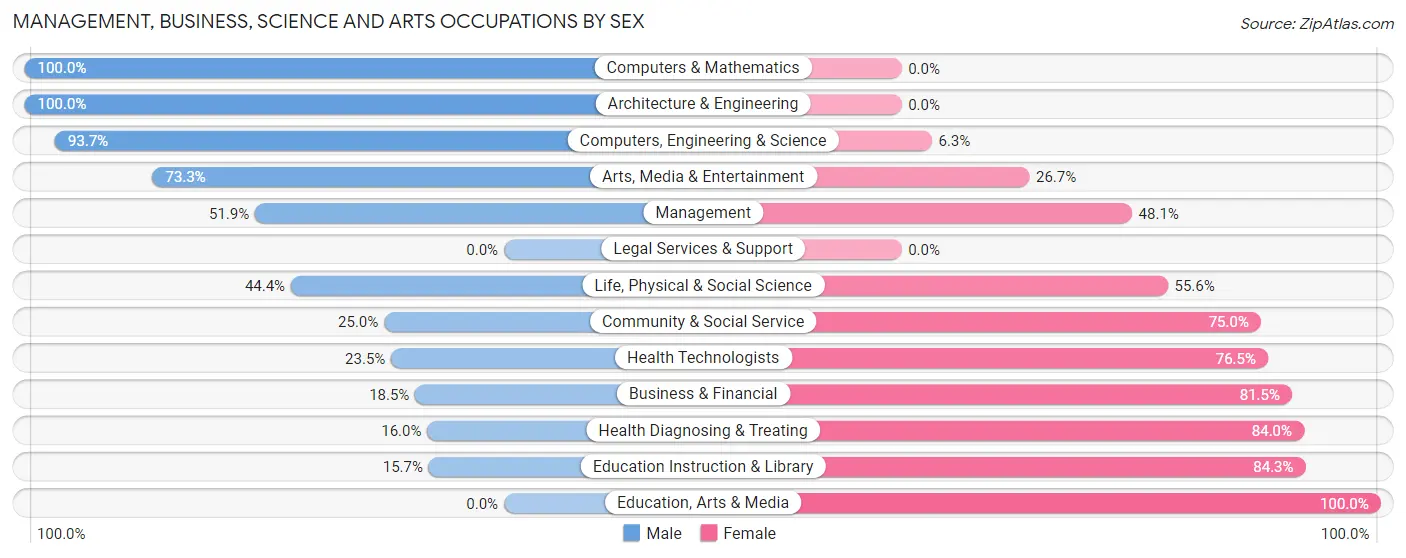
Management, Business, Science and Arts Occupations by Sex
Within the Management, Business, Science and Arts occupations in Alamance, the most male-oriented occupations are Computers & Mathematics (100.0%), Architecture & Engineering (100.0%), and Computers, Engineering & Science (93.7%), while the most female-oriented occupations are Education, Arts & Media (100.0%), Education Instruction & Library (84.3%), and Health Diagnosing & Treating (84.0%).
| Occupation | Male | Female |
| Management | 54 (51.9%) | 50 (48.1%) |
| Business & Financial | 10 (18.5%) | 44 (81.5%) |
| Computers, Engineering & Science | 74 (93.7%) | 5 (6.3%) |
| Computers & Mathematics | 56 (100.0%) | 0 (0.0%) |
| Architecture & Engineering | 14 (100.0%) | 0 (0.0%) |
| Life, Physical & Social Science | 4 (44.4%) | 5 (55.6%) |
| Community & Social Service | 19 (25.0%) | 57 (75.0%) |
| Education, Arts & Media | 0 (0.0%) | 10 (100.0%) |
| Legal Services & Support | 0 (0.0%) | 0 (0.0%) |
| Education Instruction & Library | 8 (15.7%) | 43 (84.3%) |
| Arts, Media & Entertainment | 11 (73.3%) | 4 (26.7%) |
| Health Diagnosing & Treating | 4 (16.0%) | 21 (84.0%) |
| Health Technologists | 4 (23.5%) | 13 (76.5%) |
| Total (Category) | 161 (47.6%) | 177 (52.4%) |
| Total (Overall) | 314 (55.2%) | 255 (44.8%) |
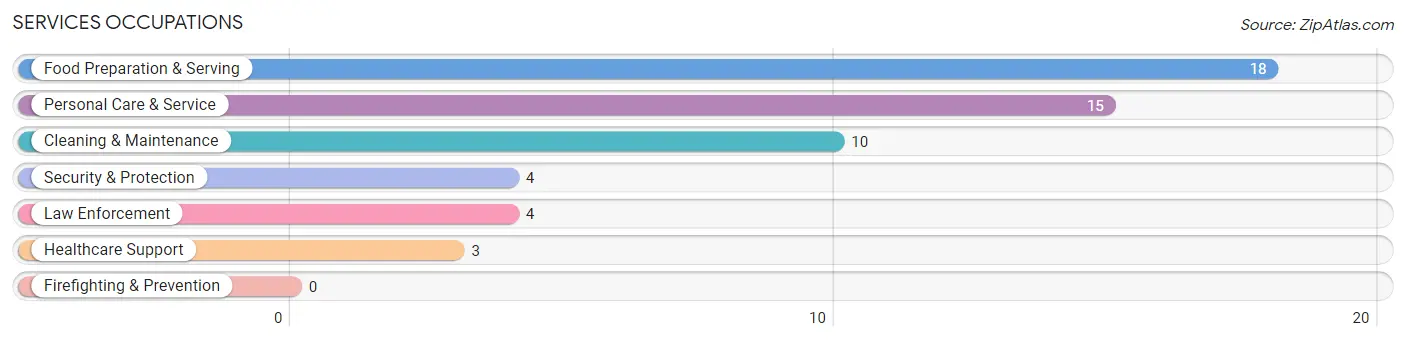
Services Occupations
The most common Services occupations in Alamance are Food Preparation & Serving (18 | 3.2%), Personal Care & Service (15 | 2.6%), Cleaning & Maintenance (10 | 1.8%), Security & Protection (4 | 0.7%), and Law Enforcement (4 | 0.7%).
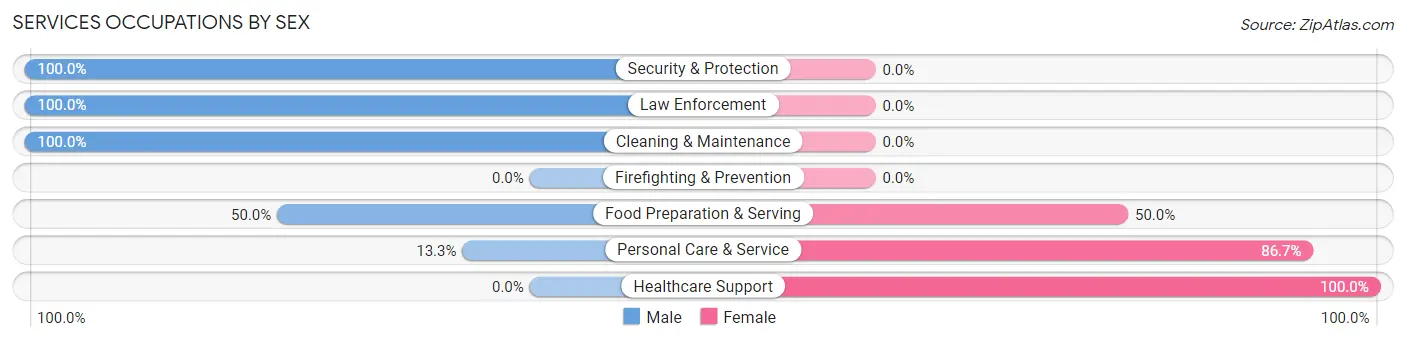
Services Occupations by Sex
Within the Services occupations in Alamance, the most male-oriented occupations are Security & Protection (100.0%), Law Enforcement (100.0%), and Cleaning & Maintenance (100.0%), while the most female-oriented occupations are Healthcare Support (100.0%), Personal Care & Service (86.7%), and Food Preparation & Serving (50.0%).
| Occupation | Male | Female |
| Healthcare Support | 0 (0.0%) | 3 (100.0%) |
| Security & Protection | 4 (100.0%) | 0 (0.0%) |
| Firefighting & Prevention | 0 (0.0%) | 0 (0.0%) |
| Law Enforcement | 4 (100.0%) | 0 (0.0%) |
| Food Preparation & Serving | 9 (50.0%) | 9 (50.0%) |
| Cleaning & Maintenance | 10 (100.0%) | 0 (0.0%) |
| Personal Care & Service | 2 (13.3%) | 13 (86.7%) |
| Total (Category) | 25 (50.0%) | 25 (50.0%) |
| Total (Overall) | 314 (55.2%) | 255 (44.8%) |
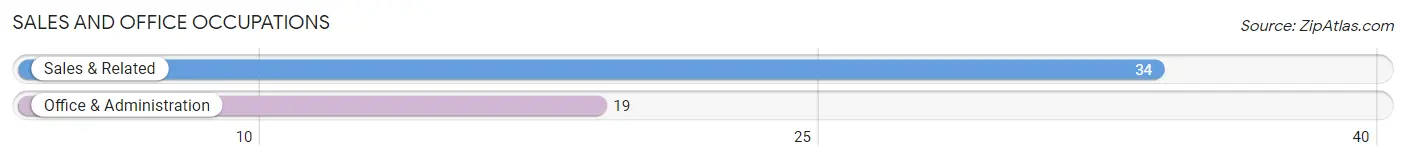
Sales and Office Occupations
The most common Sales and Office occupations in Alamance are Sales & Related (34 | 6.0%), and Office & Administration (19 | 3.3%).
Sales and Office Occupations by Sex
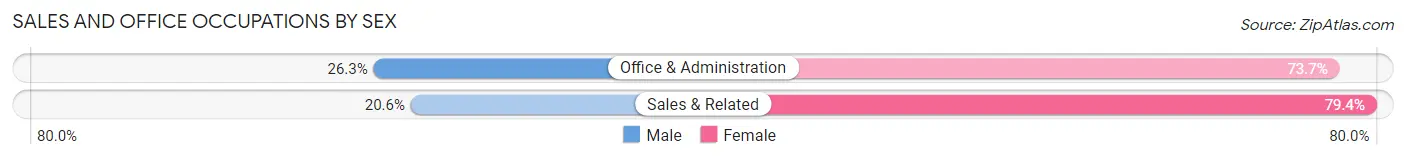
| Occupation | Male | Female |
| Sales & Related | 7 (20.6%) | 27 (79.4%) |
| Office & Administration | 5 (26.3%) | 14 (73.7%) |
| Total (Category) | 12 (22.6%) | 41 (77.4%) |
| Total (Overall) | 314 (55.2%) | 255 (44.8%) |
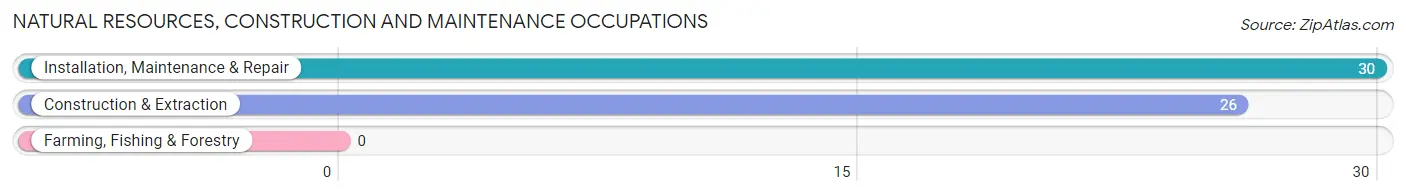
Natural Resources, Construction and Maintenance Occupations
The most common Natural Resources, Construction and Maintenance occupations in Alamance are Installation, Maintenance & Repair (30 | 5.3%), and Construction & Extraction (26 | 4.6%).
Natural Resources, Construction and Maintenance Occupations by Sex
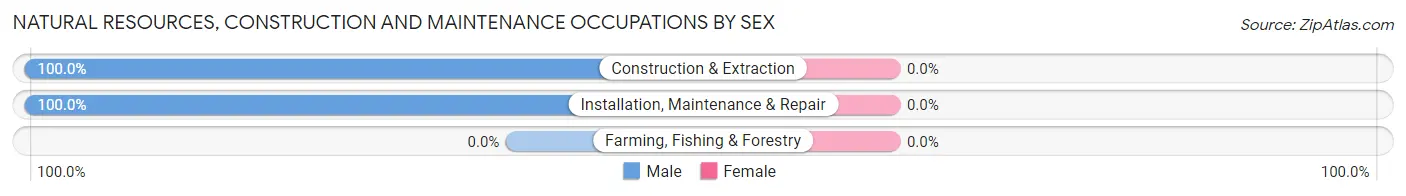
| Occupation | Male | Female |
| Farming, Fishing & Forestry | 0 (0.0%) | 0 (0.0%) |
| Construction & Extraction | 26 (100.0%) | 0 (0.0%) |
| Installation, Maintenance & Repair | 30 (100.0%) | 0 (0.0%) |
| Total (Category) | 56 (100.0%) | 0 (0.0%) |
| Total (Overall) | 314 (55.2%) | 255 (44.8%) |
Production, Transportation and Moving Occupations
The most common Production, Transportation and Moving occupations in Alamance are Production (56 | 9.8%), Material Moving (14 | 2.5%), and Transportation (2 | 0.4%).
Production, Transportation and Moving Occupations by Sex
| Occupation | Male | Female |
| Production | 44 (78.6%) | 12 (21.4%) |
| Transportation | 2 (100.0%) | 0 (0.0%) |
| Material Moving | 14 (100.0%) | 0 (0.0%) |
| Total (Category) | 60 (83.3%) | 12 (16.7%) |
| Total (Overall) | 314 (55.2%) | 255 (44.8%) |
Employment Industries by Sex in Alamance
Employment Industries in Alamance
The major employment industries in Alamance include Health Care & Social Assistance (98 | 17.2%), Manufacturing (86 | 15.1%), Educational Services (83 | 14.6%), Utilities (53 | 9.3%), and Retail Trade (48 | 8.4%).
Employment Industries by Sex in Alamance
The Alamance industries that see more men than women are Construction (100.0%), Wholesale Trade (100.0%), and Transportation & Warehousing (100.0%), whereas the industries that tend to have a higher number of women are Information (100.0%), Real Estate, Rental & Leasing (100.0%), and Health Care & Social Assistance (87.8%).
| Industry | Male | Female |
| Agriculture, Fishing & Hunting | 0 (0.0%) | 0 (0.0%) |
| Mining, Quarrying, & Extraction | 0 (0.0%) | 0 (0.0%) |
| Construction | 34 (100.0%) | 0 (0.0%) |
| Manufacturing | 72 (83.7%) | 14 (16.3%) |
| Wholesale Trade | 4 (100.0%) | 0 (0.0%) |
| Retail Trade | 27 (56.2%) | 21 (43.8%) |
| Transportation & Warehousing | 17 (100.0%) | 0 (0.0%) |
| Utilities | 53 (100.0%) | 0 (0.0%) |
| Information | 0 (0.0%) | 2 (100.0%) |
| Finance & Insurance | 13 (39.4%) | 20 (60.6%) |
| Real Estate, Rental & Leasing | 0 (0.0%) | 5 (100.0%) |
| Professional & Scientific | 9 (42.9%) | 12 (57.1%) |
| Enterprise Management | 0 (0.0%) | 0 (0.0%) |
| Administrative & Support | 3 (33.3%) | 6 (66.7%) |
| Educational Services | 22 (26.5%) | 61 (73.5%) |
| Health Care & Social Assistance | 12 (12.2%) | 86 (87.8%) |
| Arts, Entertainment & Recreation | 2 (100.0%) | 0 (0.0%) |
| Accommodation & Food Services | 17 (65.4%) | 9 (34.6%) |
| Public Administration | 9 (75.0%) | 3 (25.0%) |
| Total | 314 (55.2%) | 255 (44.8%) |
Education in Alamance
School Enrollment in Alamance
The most common levels of schooling among the 502 students in Alamance are middle school (186 | 37.0%), high school (96 | 19.1%), and college / undergraduate (80 | 15.9%).
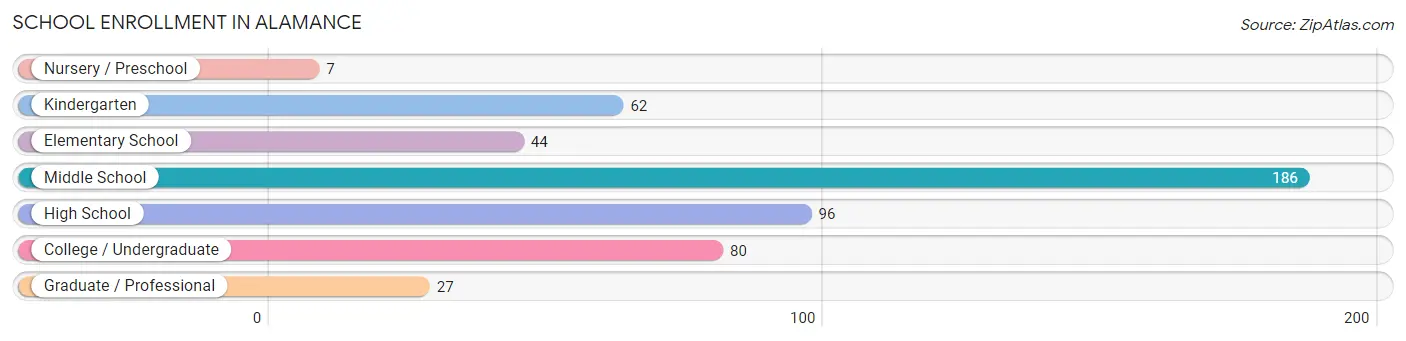
| School Level | # Students | % Students |
| Nursery / Preschool | 7 | 1.4% |
| Kindergarten | 62 | 12.3% |
| Elementary School | 44 | 8.8% |
| Middle School | 186 | 37.0% |
| High School | 96 | 19.1% |
| College / Undergraduate | 80 | 15.9% |
| Graduate / Professional | 27 | 5.4% |
| Total | 502 | 100.0% |
School Enrollment by Age by Funding Source in Alamance
Out of a total of 502 students who are enrolled in schools in Alamance, 157 (31.3%) attend a private institution, while the remaining 345 (68.7%) are enrolled in public schools. The age group of 5 to 9 year old has the highest likelihood of being enrolled in private schools, with 72 (69.9% in the age bracket) enrolled. Conversely, the age group of 15 to 17 year olds has the lowest likelihood of being enrolled in a private school, with 91 (100.0% in the age bracket) attending a public institution.
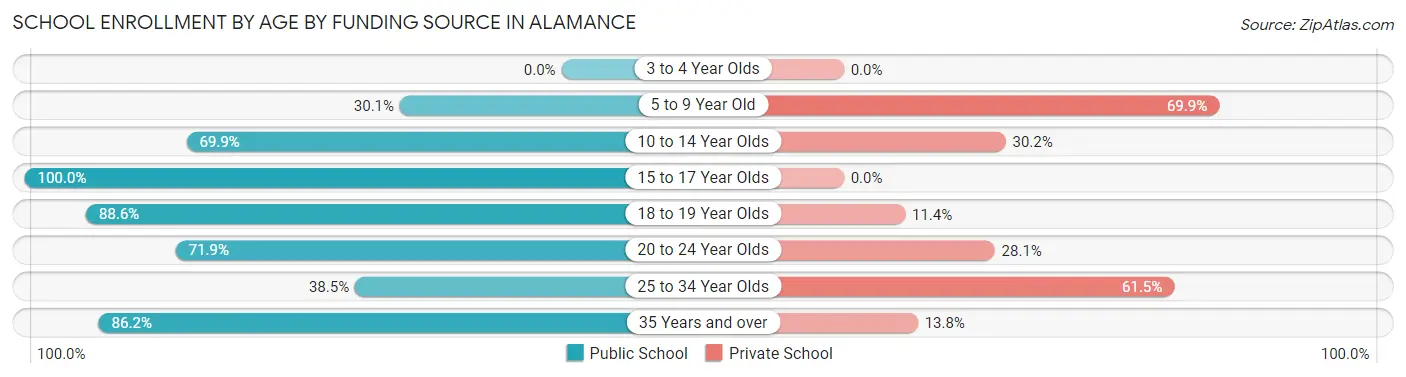
| Age Bracket | Public School | Private School |
| 3 to 4 Year Olds | 0 (0.0%) | 0 (0.0%) |
| 5 to 9 Year Old | 31 (30.1%) | 72 (69.9%) |
| 10 to 14 Year Olds | 139 (69.9%) | 60 (30.1%) |
| 15 to 17 Year Olds | 91 (100.0%) | 0 (0.0%) |
| 18 to 19 Year Olds | 31 (88.6%) | 4 (11.4%) |
| 20 to 24 Year Olds | 23 (71.9%) | 9 (28.1%) |
| 25 to 34 Year Olds | 5 (38.5%) | 8 (61.5%) |
| 35 Years and over | 25 (86.2%) | 4 (13.8%) |
| Total | 345 (68.7%) | 157 (31.3%) |
Educational Attainment by Field of Study in Alamance
Science & technology (68 | 20.4%), communications (55 | 16.5%), bio, nature & agricultural (48 | 14.4%), business (40 | 12.0%), and education (36 | 10.8%) are the most common fields of study among 333 individuals in Alamance who have obtained a bachelor's degree or higher.
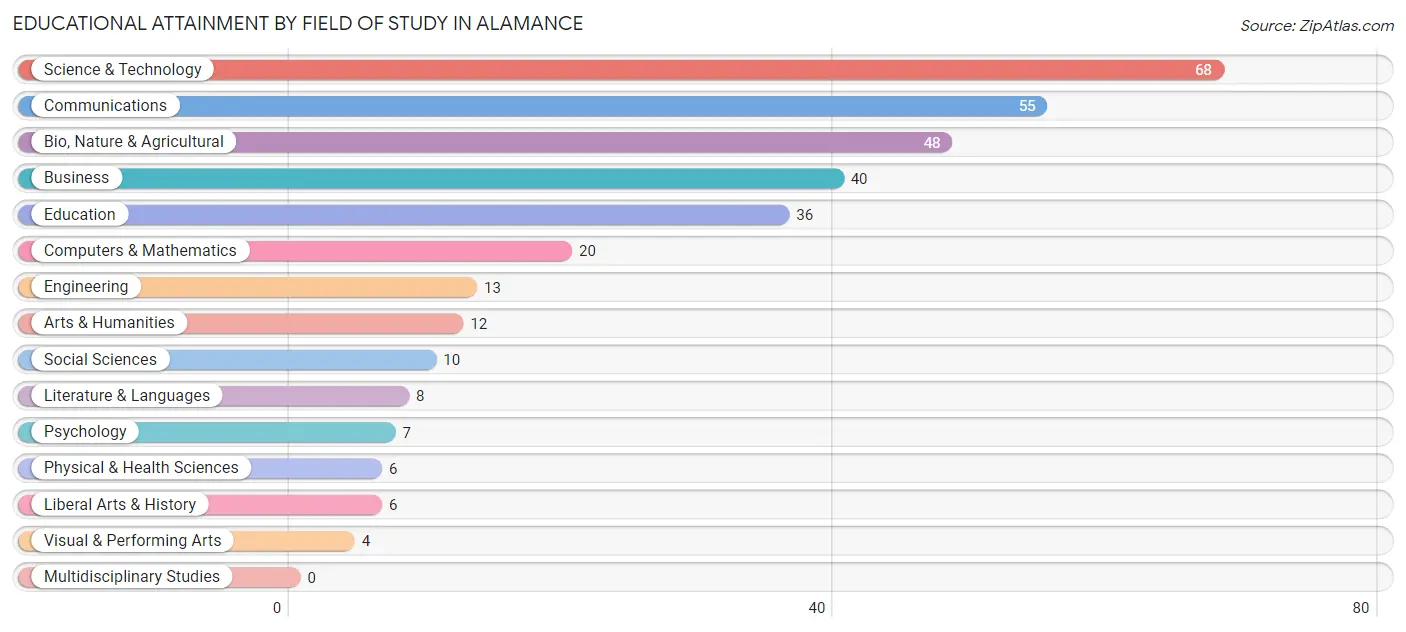
| Field of Study | # Graduates | % Graduates |
| Computers & Mathematics | 20 | 6.0% |
| Bio, Nature & Agricultural | 48 | 14.4% |
| Physical & Health Sciences | 6 | 1.8% |
| Psychology | 7 | 2.1% |
| Social Sciences | 10 | 3.0% |
| Engineering | 13 | 3.9% |
| Multidisciplinary Studies | 0 | 0.0% |
| Science & Technology | 68 | 20.4% |
| Business | 40 | 12.0% |
| Education | 36 | 10.8% |
| Literature & Languages | 8 | 2.4% |
| Liberal Arts & History | 6 | 1.8% |
| Visual & Performing Arts | 4 | 1.2% |
| Communications | 55 | 16.5% |
| Arts & Humanities | 12 | 3.6% |
| Total | 333 | 100.0% |
Transportation & Commute in Alamance
Vehicle Availability by Sex in Alamance
The most prevalent vehicle ownership categories in Alamance are males with 3 vehicles (156, accounting for 49.7%) and females with 3 vehicles (124, making up 63.7%).
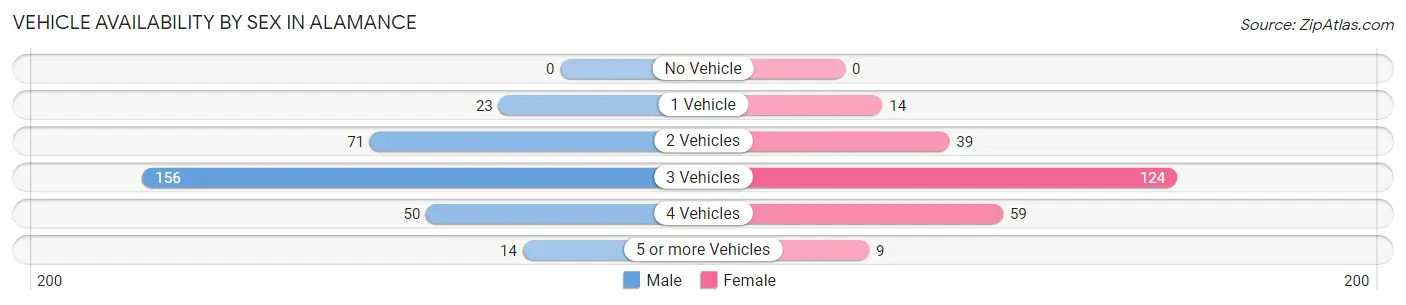
| Vehicles Available | Male | Female |
| No Vehicle | 0 (0.0%) | 0 (0.0%) |
| 1 Vehicle | 23 (7.3%) | 14 (5.7%) |
| 2 Vehicles | 71 (22.6%) | 39 (15.9%) |
| 3 Vehicles | 156 (49.7%) | 124 (50.6%) |
| 4 Vehicles | 50 (15.9%) | 59 (24.1%) |
| 5 or more Vehicles | 14 (4.5%) | 9 (3.7%) |
| Total | 314 (100.0%) | 245 (100.0%) |
Commute Time in Alamance
The most frequently occuring commute durations in Alamance are 15 to 19 minutes (97 commuters, 22.9%), 20 to 24 minutes (58 commuters, 13.7%), and 10 to 14 minutes (53 commuters, 12.5%).
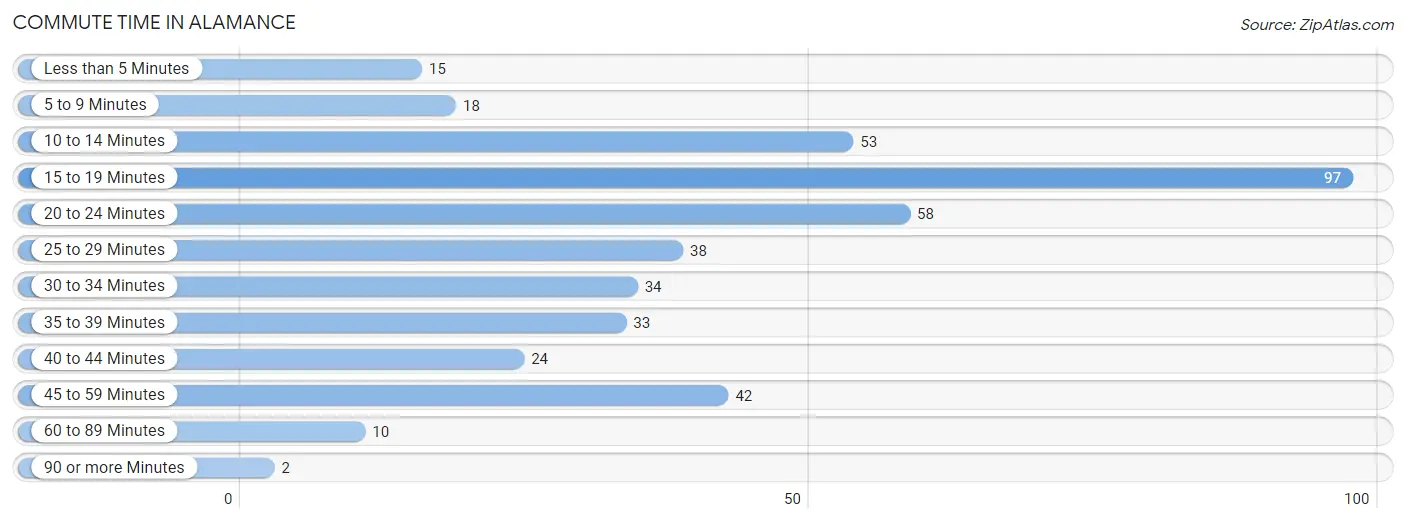
| Commute Time | # Commuters | % Commuters |
| Less than 5 Minutes | 15 | 3.5% |
| 5 to 9 Minutes | 18 | 4.3% |
| 10 to 14 Minutes | 53 | 12.5% |
| 15 to 19 Minutes | 97 | 22.9% |
| 20 to 24 Minutes | 58 | 13.7% |
| 25 to 29 Minutes | 38 | 9.0% |
| 30 to 34 Minutes | 34 | 8.0% |
| 35 to 39 Minutes | 33 | 7.8% |
| 40 to 44 Minutes | 24 | 5.7% |
| 45 to 59 Minutes | 42 | 9.9% |
| 60 to 89 Minutes | 10 | 2.4% |
| 90 or more Minutes | 2 | 0.5% |
Commute Time by Sex in Alamance
The most common commute times in Alamance are 15 to 19 minutes (65 commuters, 27.2%) for males and 10 to 14 minutes (35 commuters, 18.9%) for females.
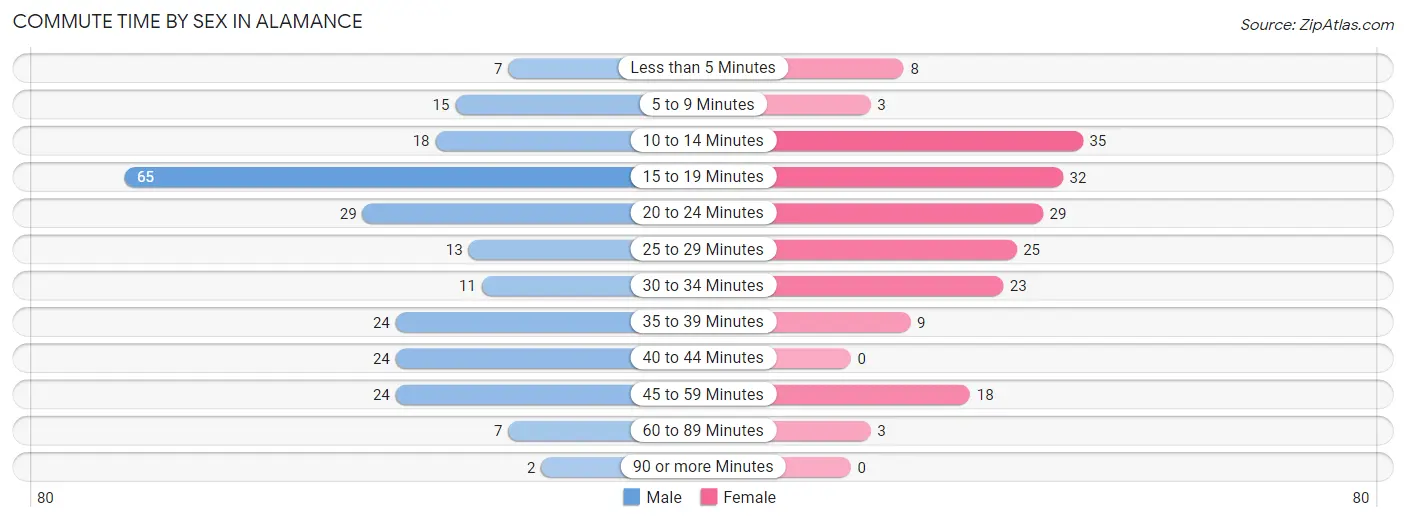
| Commute Time | Male | Female |
| Less than 5 Minutes | 7 (2.9%) | 8 (4.3%) |
| 5 to 9 Minutes | 15 (6.3%) | 3 (1.6%) |
| 10 to 14 Minutes | 18 (7.5%) | 35 (18.9%) |
| 15 to 19 Minutes | 65 (27.2%) | 32 (17.3%) |
| 20 to 24 Minutes | 29 (12.1%) | 29 (15.7%) |
| 25 to 29 Minutes | 13 (5.4%) | 25 (13.5%) |
| 30 to 34 Minutes | 11 (4.6%) | 23 (12.4%) |
| 35 to 39 Minutes | 24 (10.0%) | 9 (4.9%) |
| 40 to 44 Minutes | 24 (10.0%) | 0 (0.0%) |
| 45 to 59 Minutes | 24 (10.0%) | 18 (9.7%) |
| 60 to 89 Minutes | 7 (2.9%) | 3 (1.6%) |
| 90 or more Minutes | 2 (0.8%) | 0 (0.0%) |
Time of Departure to Work by Sex in Alamance
The most frequent times of departure to work in Alamance are 7:30 AM to 7:59 AM (43, 18.0%) for males and 7:00 AM to 7:29 AM (48, 26.0%) for females.
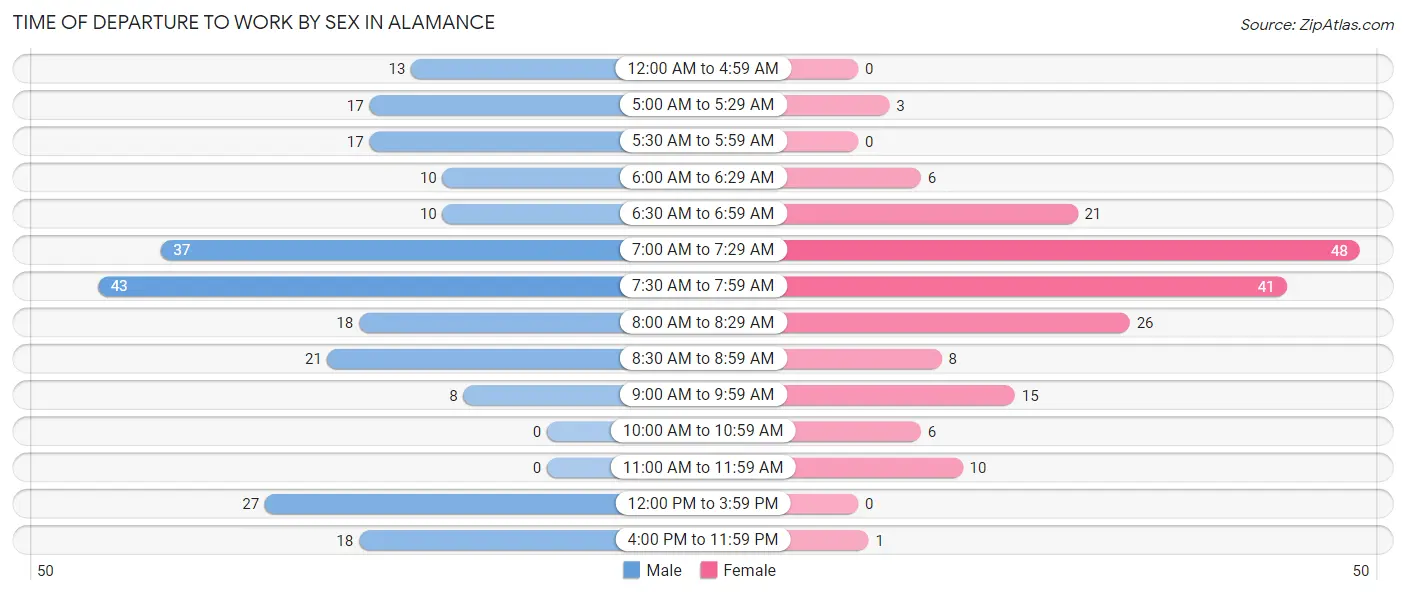
| Time of Departure | Male | Female |
| 12:00 AM to 4:59 AM | 13 (5.4%) | 0 (0.0%) |
| 5:00 AM to 5:29 AM | 17 (7.1%) | 3 (1.6%) |
| 5:30 AM to 5:59 AM | 17 (7.1%) | 0 (0.0%) |
| 6:00 AM to 6:29 AM | 10 (4.2%) | 6 (3.2%) |
| 6:30 AM to 6:59 AM | 10 (4.2%) | 21 (11.4%) |
| 7:00 AM to 7:29 AM | 37 (15.5%) | 48 (26.0%) |
| 7:30 AM to 7:59 AM | 43 (18.0%) | 41 (22.2%) |
| 8:00 AM to 8:29 AM | 18 (7.5%) | 26 (14.1%) |
| 8:30 AM to 8:59 AM | 21 (8.8%) | 8 (4.3%) |
| 9:00 AM to 9:59 AM | 8 (3.4%) | 15 (8.1%) |
| 10:00 AM to 10:59 AM | 0 (0.0%) | 6 (3.2%) |
| 11:00 AM to 11:59 AM | 0 (0.0%) | 10 (5.4%) |
| 12:00 PM to 3:59 PM | 27 (11.3%) | 0 (0.0%) |
| 4:00 PM to 11:59 PM | 18 (7.5%) | 1 (0.5%) |
| Total | 239 (100.0%) | 185 (100.0%) |
Housing Occupancy in Alamance
Occupancy by Ownership in Alamance
Of the total 409 dwellings in Alamance, owner-occupied units account for 357 (87.3%), while renter-occupied units make up 52 (12.7%).
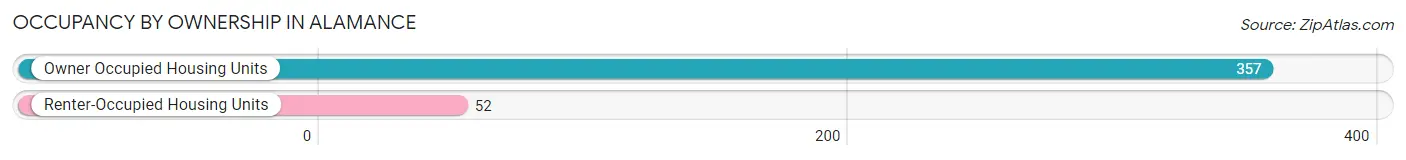
| Occupancy | # Housing Units | % Housing Units |
| Owner Occupied Housing Units | 357 | 87.3% |
| Renter-Occupied Housing Units | 52 | 12.7% |
| Total Occupied Housing Units | 409 | 100.0% |
Occupancy by Household Size in Alamance
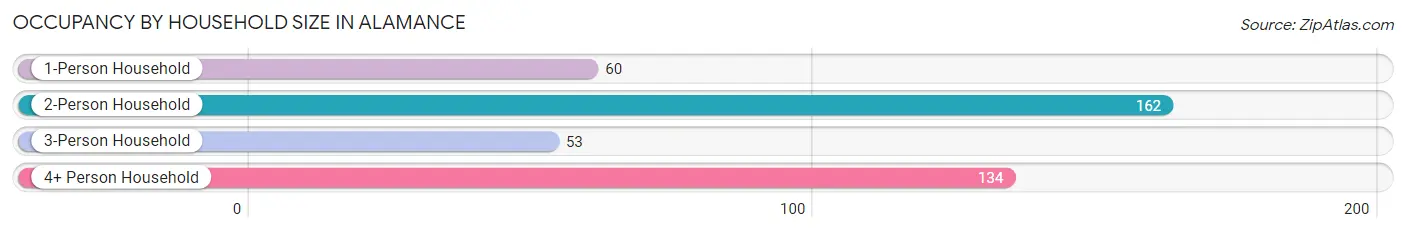
| Household Size | # Housing Units | % Housing Units |
| 1-Person Household | 60 | 14.7% |
| 2-Person Household | 162 | 39.6% |
| 3-Person Household | 53 | 13.0% |
| 4+ Person Household | 134 | 32.8% |
| Total Housing Units | 409 | 100.0% |
Occupancy by Ownership by Household Size in Alamance
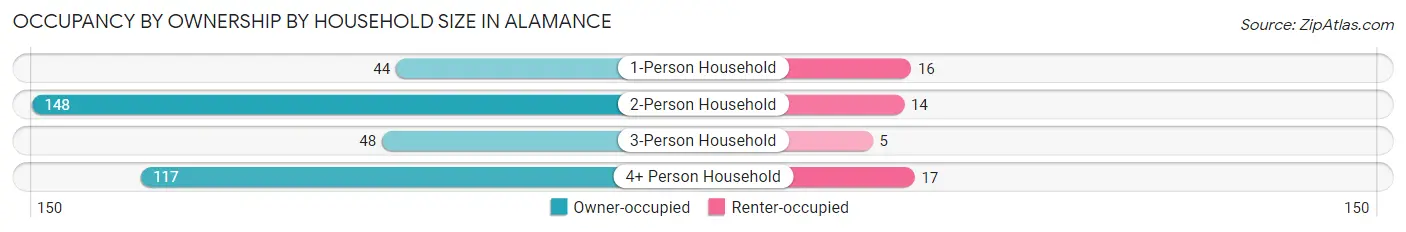
| Household Size | Owner-occupied | Renter-occupied |
| 1-Person Household | 44 (73.3%) | 16 (26.7%) |
| 2-Person Household | 148 (91.4%) | 14 (8.6%) |
| 3-Person Household | 48 (90.6%) | 5 (9.4%) |
| 4+ Person Household | 117 (87.3%) | 17 (12.7%) |
| Total Housing Units | 357 (87.3%) | 52 (12.7%) |
Occupancy by Educational Attainment in Alamance
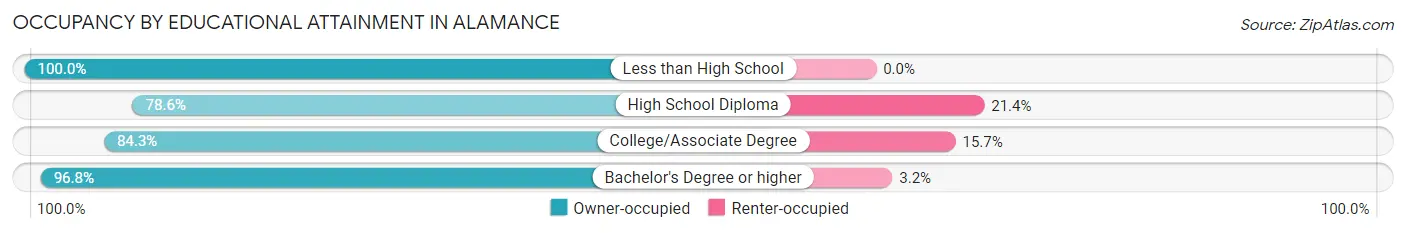
| Household Size | Owner-occupied | Renter-occupied |
| Less than High School | 5 (100.0%) | 0 (0.0%) |
| High School Diploma | 110 (78.6%) | 30 (21.4%) |
| College/Associate Degree | 91 (84.3%) | 17 (15.7%) |
| Bachelor's Degree or higher | 151 (96.8%) | 5 (3.2%) |
Occupancy by Age of Householder in Alamance
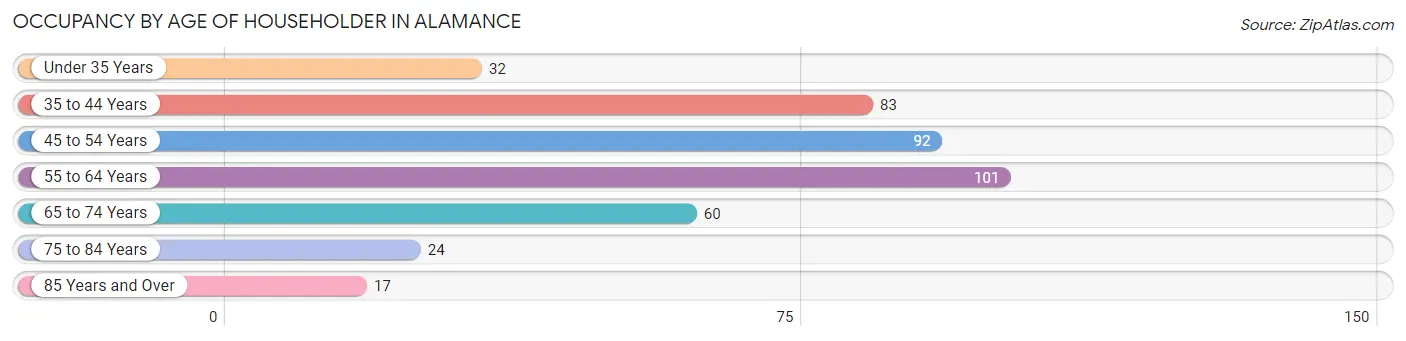
| Age Bracket | # Households | % Households |
| Under 35 Years | 32 | 7.8% |
| 35 to 44 Years | 83 | 20.3% |
| 45 to 54 Years | 92 | 22.5% |
| 55 to 64 Years | 101 | 24.7% |
| 65 to 74 Years | 60 | 14.7% |
| 75 to 84 Years | 24 | 5.9% |
| 85 Years and Over | 17 | 4.2% |
| Total | 409 | 100.0% |
Housing Finances in Alamance
Median Income by Occupancy in Alamance
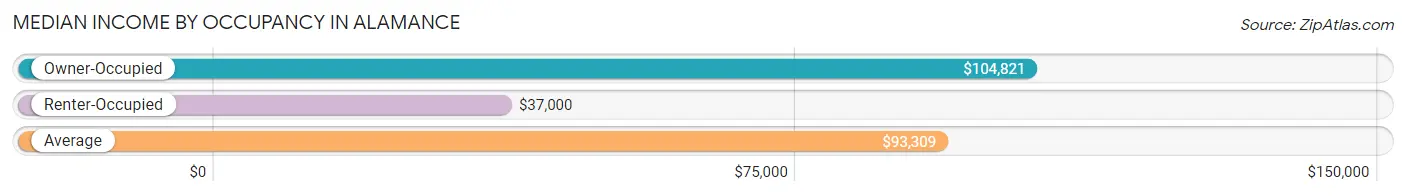
| Occupancy Type | # Households | Median Income |
| Owner-Occupied | 357 (87.3%) | $104,821 |
| Renter-Occupied | 52 (12.7%) | $37,000 |
| Average | 409 (100.0%) | $93,309 |
Occupancy by Householder Income Bracket in Alamance
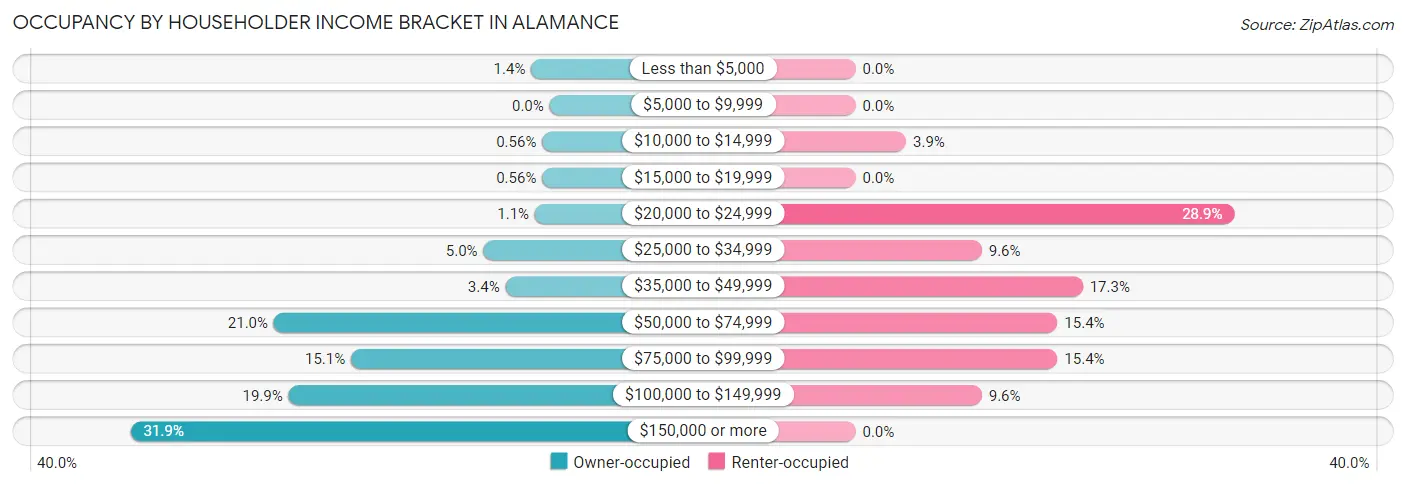
| Income Bracket | Owner-occupied | Renter-occupied |
| Less than $5,000 | 5 (1.4%) | 0 (0.0%) |
| $5,000 to $9,999 | 0 (0.0%) | 0 (0.0%) |
| $10,000 to $14,999 | 2 (0.6%) | 2 (3.8%) |
| $15,000 to $19,999 | 2 (0.6%) | 0 (0.0%) |
| $20,000 to $24,999 | 4 (1.1%) | 15 (28.8%) |
| $25,000 to $34,999 | 18 (5.0%) | 5 (9.6%) |
| $35,000 to $49,999 | 12 (3.4%) | 9 (17.3%) |
| $50,000 to $74,999 | 75 (21.0%) | 8 (15.4%) |
| $75,000 to $99,999 | 54 (15.1%) | 8 (15.4%) |
| $100,000 to $149,999 | 71 (19.9%) | 5 (9.6%) |
| $150,000 or more | 114 (31.9%) | 0 (0.0%) |
| Total | 357 (100.0%) | 52 (100.0%) |
Monthly Housing Cost Tiers in Alamance
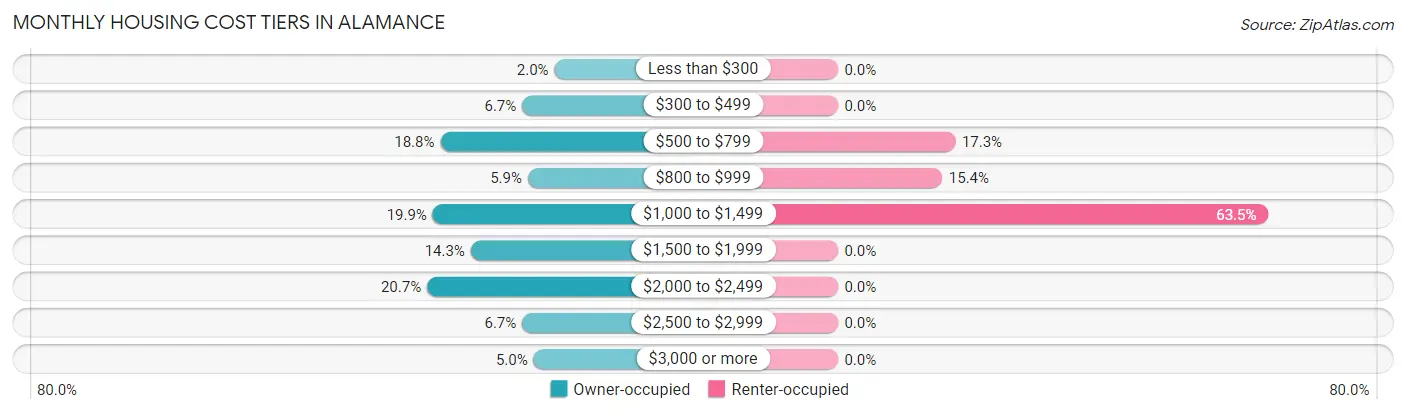
| Monthly Cost | Owner-occupied | Renter-occupied |
| Less than $300 | 7 (2.0%) | 0 (0.0%) |
| $300 to $499 | 24 (6.7%) | 0 (0.0%) |
| $500 to $799 | 67 (18.8%) | 9 (17.3%) |
| $800 to $999 | 21 (5.9%) | 8 (15.4%) |
| $1,000 to $1,499 | 71 (19.9%) | 33 (63.5%) |
| $1,500 to $1,999 | 51 (14.3%) | 0 (0.0%) |
| $2,000 to $2,499 | 74 (20.7%) | 0 (0.0%) |
| $2,500 to $2,999 | 24 (6.7%) | 0 (0.0%) |
| $3,000 or more | 18 (5.0%) | 0 (0.0%) |
| Total | 357 (100.0%) | 52 (100.0%) |
Physical Housing Characteristics in Alamance
Housing Structures in Alamance
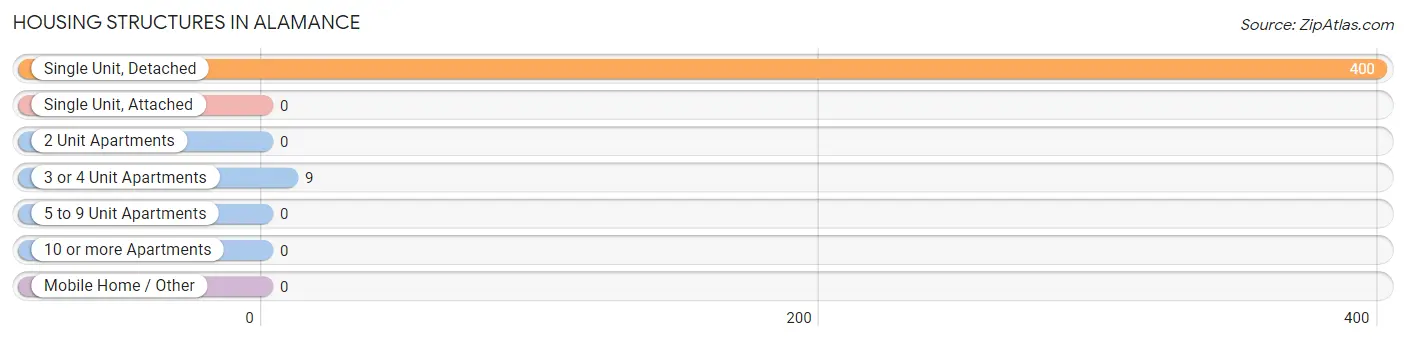
| Structure Type | # Housing Units | % Housing Units |
| Single Unit, Detached | 400 | 97.8% |
| Single Unit, Attached | 0 | 0.0% |
| 2 Unit Apartments | 0 | 0.0% |
| 3 or 4 Unit Apartments | 9 | 2.2% |
| 5 to 9 Unit Apartments | 0 | 0.0% |
| 10 or more Apartments | 0 | 0.0% |
| Mobile Home / Other | 0 | 0.0% |
| Total | 409 | 100.0% |
Housing Structures by Occupancy in Alamance
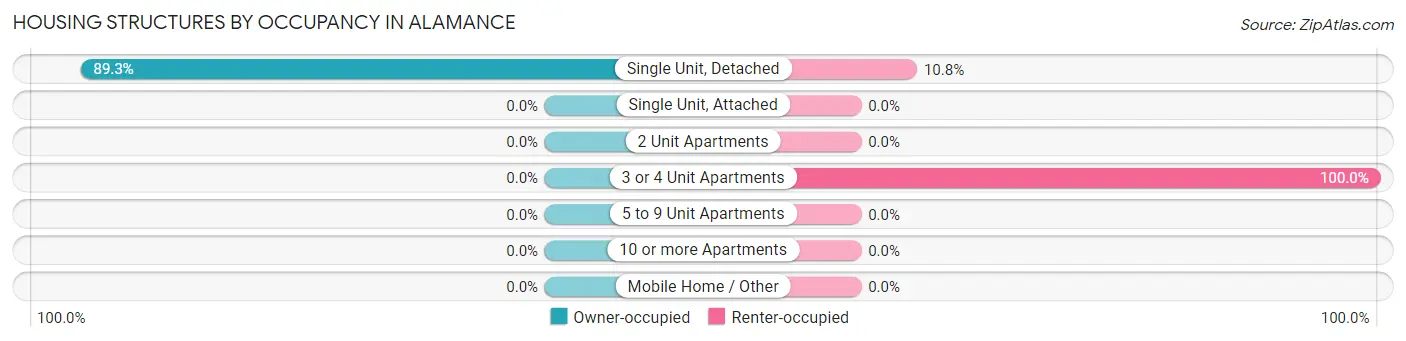
| Structure Type | Owner-occupied | Renter-occupied |
| Single Unit, Detached | 357 (89.2%) | 43 (10.7%) |
| Single Unit, Attached | 0 (0.0%) | 0 (0.0%) |
| 2 Unit Apartments | 0 (0.0%) | 0 (0.0%) |
| 3 or 4 Unit Apartments | 0 (0.0%) | 9 (100.0%) |
| 5 to 9 Unit Apartments | 0 (0.0%) | 0 (0.0%) |
| 10 or more Apartments | 0 (0.0%) | 0 (0.0%) |
| Mobile Home / Other | 0 (0.0%) | 0 (0.0%) |
| Total | 357 (87.3%) | 52 (12.7%) |
Housing Structures by Number of Rooms in Alamance
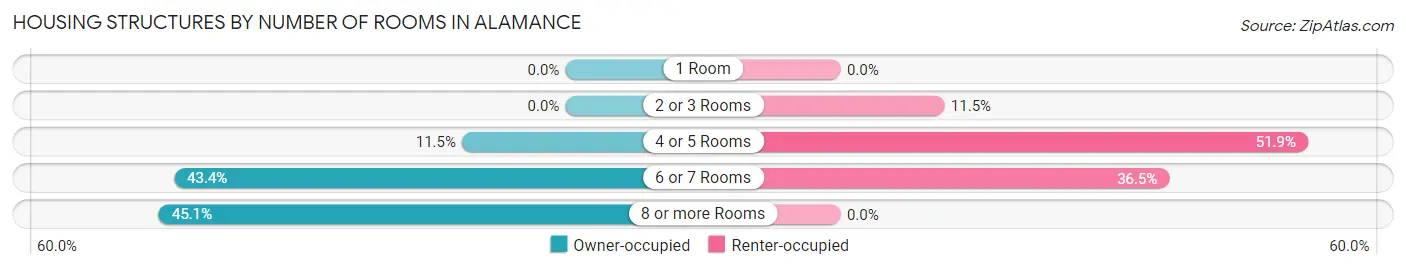
| Number of Rooms | Owner-occupied | Renter-occupied |
| 1 Room | 0 (0.0%) | 0 (0.0%) |
| 2 or 3 Rooms | 0 (0.0%) | 6 (11.5%) |
| 4 or 5 Rooms | 41 (11.5%) | 27 (51.9%) |
| 6 or 7 Rooms | 155 (43.4%) | 19 (36.5%) |
| 8 or more Rooms | 161 (45.1%) | 0 (0.0%) |
| Total | 357 (100.0%) | 52 (100.0%) |
Housing Structure by Heating Type in Alamance
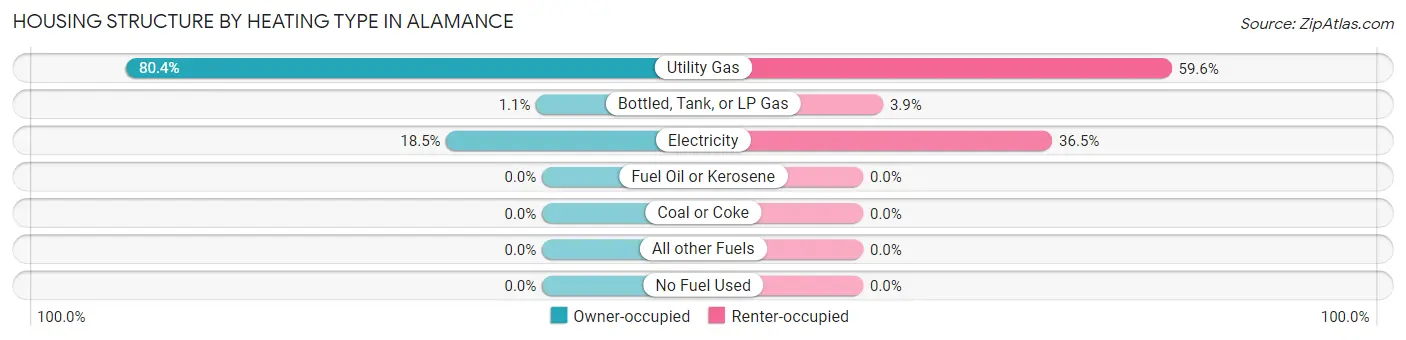
| Heating Type | Owner-occupied | Renter-occupied |
| Utility Gas | 287 (80.4%) | 31 (59.6%) |
| Bottled, Tank, or LP Gas | 4 (1.1%) | 2 (3.8%) |
| Electricity | 66 (18.5%) | 19 (36.5%) |
| Fuel Oil or Kerosene | 0 (0.0%) | 0 (0.0%) |
| Coal or Coke | 0 (0.0%) | 0 (0.0%) |
| All other Fuels | 0 (0.0%) | 0 (0.0%) |
| No Fuel Used | 0 (0.0%) | 0 (0.0%) |
| Total | 357 (100.0%) | 52 (100.0%) |
Household Vehicle Usage in Alamance
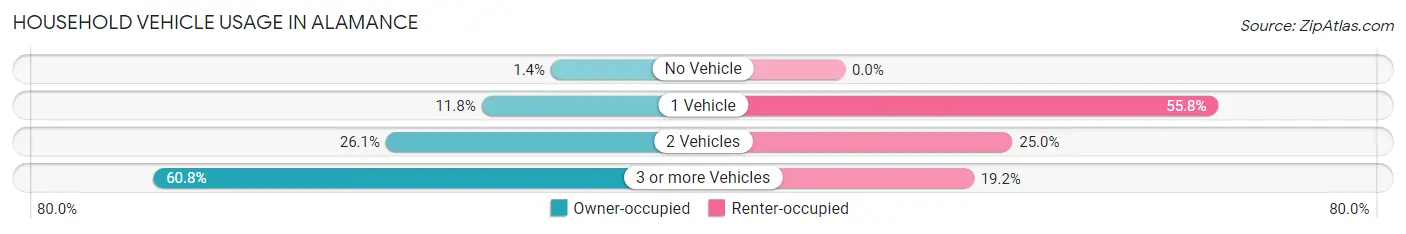
| Vehicles per Household | Owner-occupied | Renter-occupied |
| No Vehicle | 5 (1.4%) | 0 (0.0%) |
| 1 Vehicle | 42 (11.8%) | 29 (55.8%) |
| 2 Vehicles | 93 (26.1%) | 13 (25.0%) |
| 3 or more Vehicles | 217 (60.8%) | 10 (19.2%) |
| Total | 357 (100.0%) | 52 (100.0%) |
Real Estate & Mortgages in Alamance
Real Estate and Mortgage Overview in Alamance
| Characteristic | Without Mortgage | With Mortgage |
| Housing Units | 78 | 279 |
| Median Property Value | $264,300 | $364,300 |
| Median Household Income | $54,167 | $108 |
| Monthly Housing Costs | $536 | $18 |
| Real Estate Taxes | $2,188 | $0 |
Property Value by Mortgage Status in Alamance
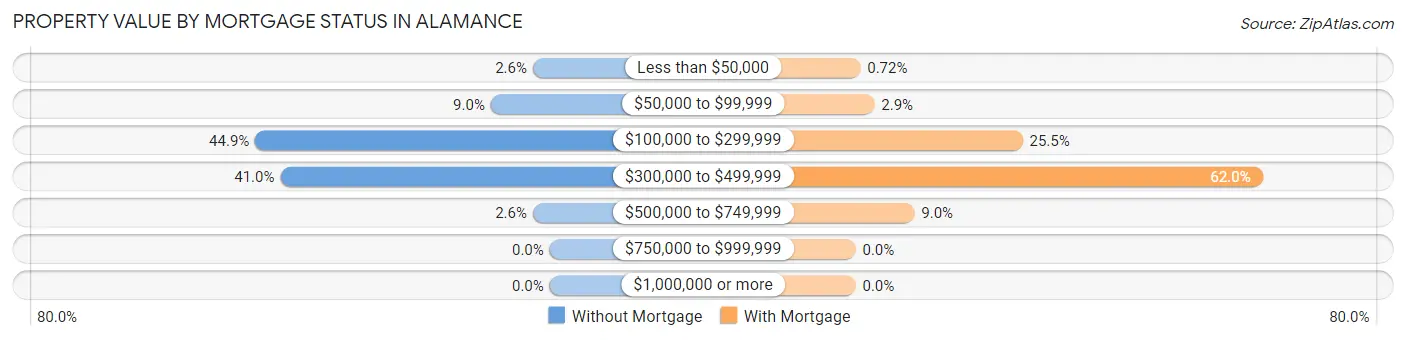
| Property Value | Without Mortgage | With Mortgage |
| Less than $50,000 | 2 (2.6%) | 2 (0.7%) |
| $50,000 to $99,999 | 7 (9.0%) | 8 (2.9%) |
| $100,000 to $299,999 | 35 (44.9%) | 71 (25.5%) |
| $300,000 to $499,999 | 32 (41.0%) | 173 (62.0%) |
| $500,000 to $749,999 | 2 (2.6%) | 25 (9.0%) |
| $750,000 to $999,999 | 0 (0.0%) | 0 (0.0%) |
| $1,000,000 or more | 0 (0.0%) | 0 (0.0%) |
| Total | 78 (100.0%) | 279 (100.0%) |
Household Income by Mortgage Status in Alamance
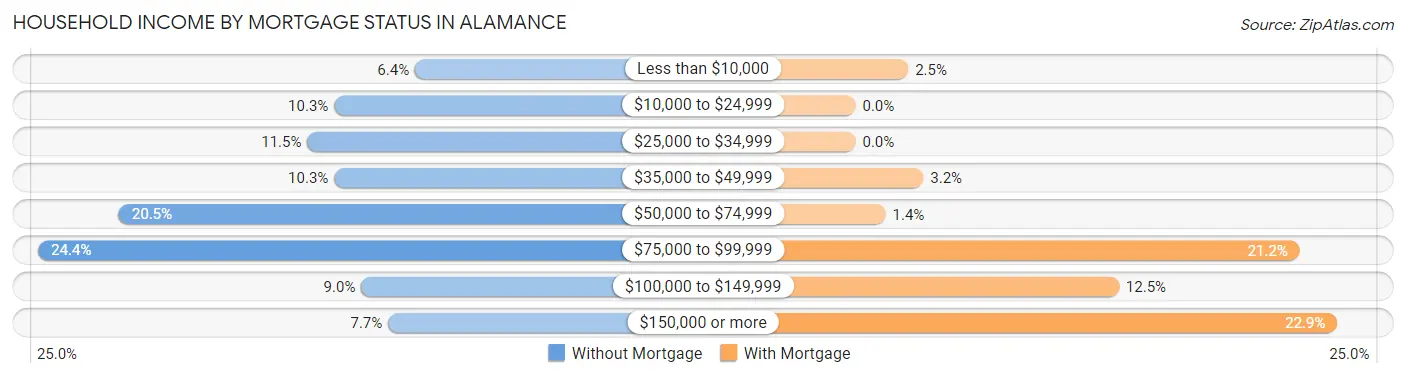
| Household Income | Without Mortgage | With Mortgage |
| Less than $10,000 | 5 (6.4%) | 7 (2.5%) |
| $10,000 to $24,999 | 8 (10.3%) | 0 (0.0%) |
| $25,000 to $34,999 | 9 (11.5%) | 0 (0.0%) |
| $35,000 to $49,999 | 8 (10.3%) | 9 (3.2%) |
| $50,000 to $74,999 | 16 (20.5%) | 4 (1.4%) |
| $75,000 to $99,999 | 19 (24.4%) | 59 (21.1%) |
| $100,000 to $149,999 | 7 (9.0%) | 35 (12.5%) |
| $150,000 or more | 6 (7.7%) | 64 (22.9%) |
| Total | 78 (100.0%) | 279 (100.0%) |
Property Value to Household Income Ratio in Alamance
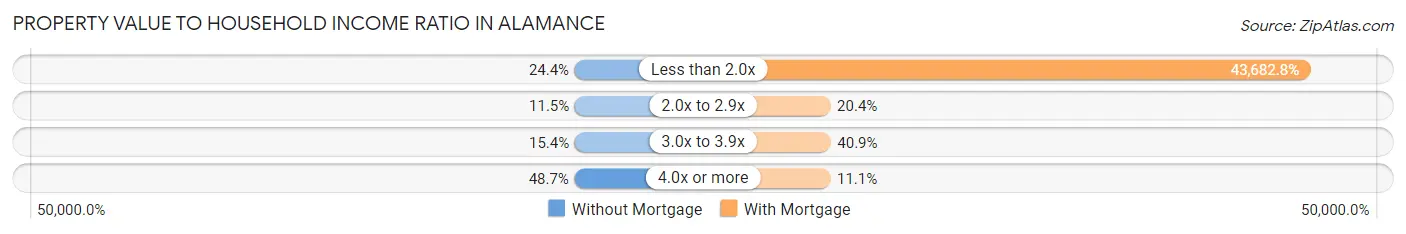
| Value-to-Income Ratio | Without Mortgage | With Mortgage |
| Less than 2.0x | 19 (24.4%) | 121,875 (43,682.8%) |
| 2.0x to 2.9x | 9 (11.5%) | 57 (20.4%) |
| 3.0x to 3.9x | 12 (15.4%) | 114 (40.9%) |
| 4.0x or more | 38 (48.7%) | 31 (11.1%) |
| Total | 78 (100.0%) | 279 (100.0%) |
Real Estate Taxes by Mortgage Status in Alamance
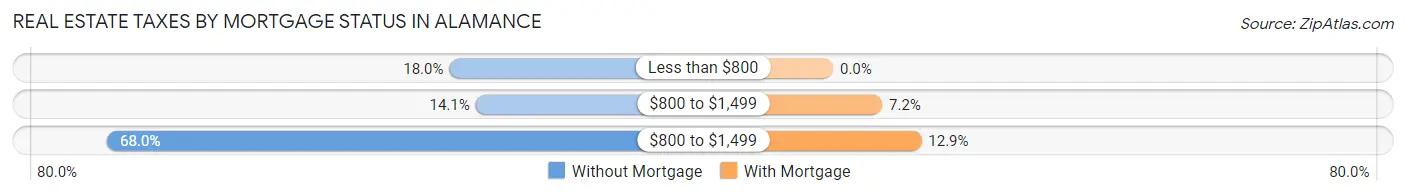
| Property Taxes | Without Mortgage | With Mortgage |
| Less than $800 | 14 (17.9%) | 0 (0.0%) |
| $800 to $1,499 | 11 (14.1%) | 20 (7.2%) |
| $800 to $1,499 | 53 (67.9%) | 36 (12.9%) |
| Total | 78 (100.0%) | 279 (100.0%) |
Health & Disability in Alamance
Health Insurance Coverage by Age in Alamance
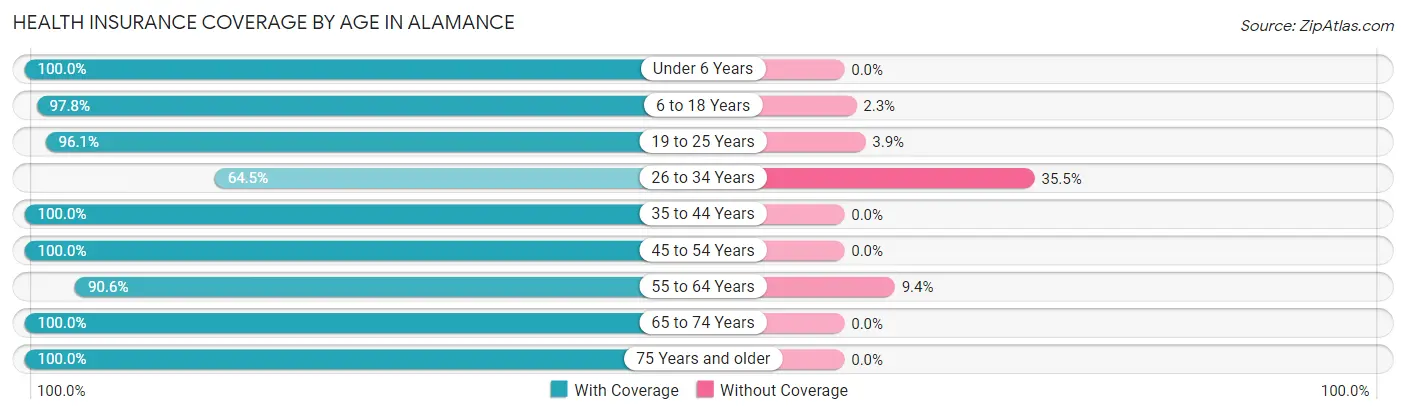
| Age Bracket | With Coverage | Without Coverage |
| Under 6 Years | 93 (100.0%) | 0 (0.0%) |
| 6 to 18 Years | 347 (97.8%) | 8 (2.2%) |
| 19 to 25 Years | 49 (96.1%) | 2 (3.9%) |
| 26 to 34 Years | 40 (64.5%) | 22 (35.5%) |
| 35 to 44 Years | 205 (100.0%) | 0 (0.0%) |
| 45 to 54 Years | 176 (100.0%) | 0 (0.0%) |
| 55 to 64 Years | 135 (90.6%) | 14 (9.4%) |
| 65 to 74 Years | 141 (100.0%) | 0 (0.0%) |
| 75 Years and older | 55 (100.0%) | 0 (0.0%) |
| Total | 1,241 (96.4%) | 46 (3.6%) |
Health Insurance Coverage by Citizenship Status in Alamance
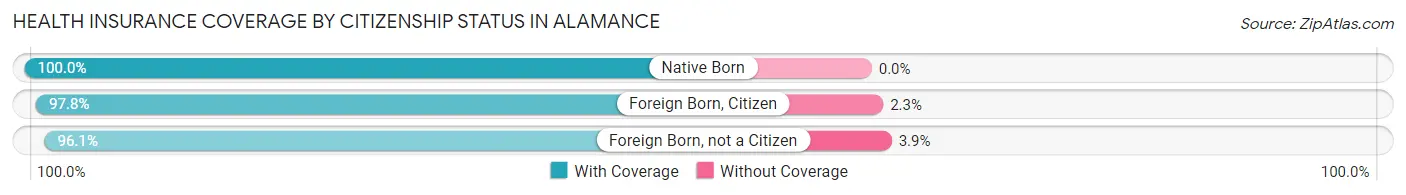
| Citizenship Status | With Coverage | Without Coverage |
| Native Born | 93 (100.0%) | 0 (0.0%) |
| Foreign Born, Citizen | 347 (97.8%) | 8 (2.2%) |
| Foreign Born, not a Citizen | 49 (96.1%) | 2 (3.9%) |
Health Insurance Coverage by Household Income in Alamance
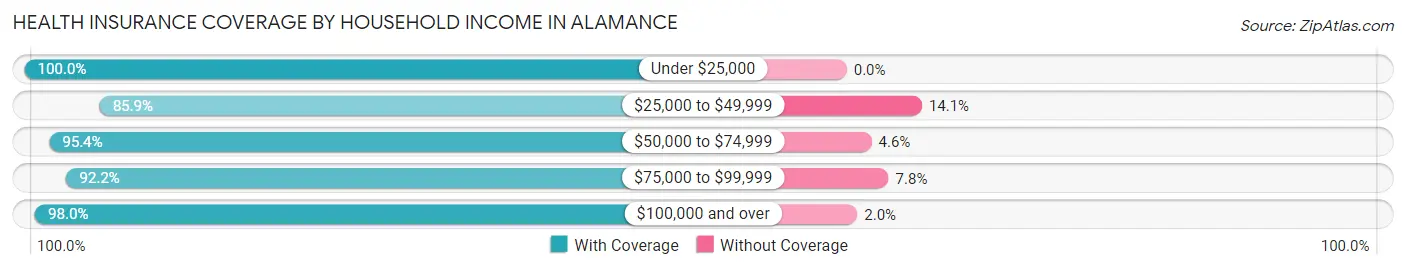
| Household Income | With Coverage | Without Coverage |
| Under $25,000 | 112 (100.0%) | 0 (0.0%) |
| $25,000 to $49,999 | 61 (85.9%) | 10 (14.1%) |
| $50,000 to $74,999 | 185 (95.4%) | 9 (4.6%) |
| $75,000 to $99,999 | 141 (92.2%) | 12 (7.8%) |
| $100,000 and over | 742 (98.0%) | 15 (2.0%) |
Public vs Private Health Insurance Coverage by Age in Alamance
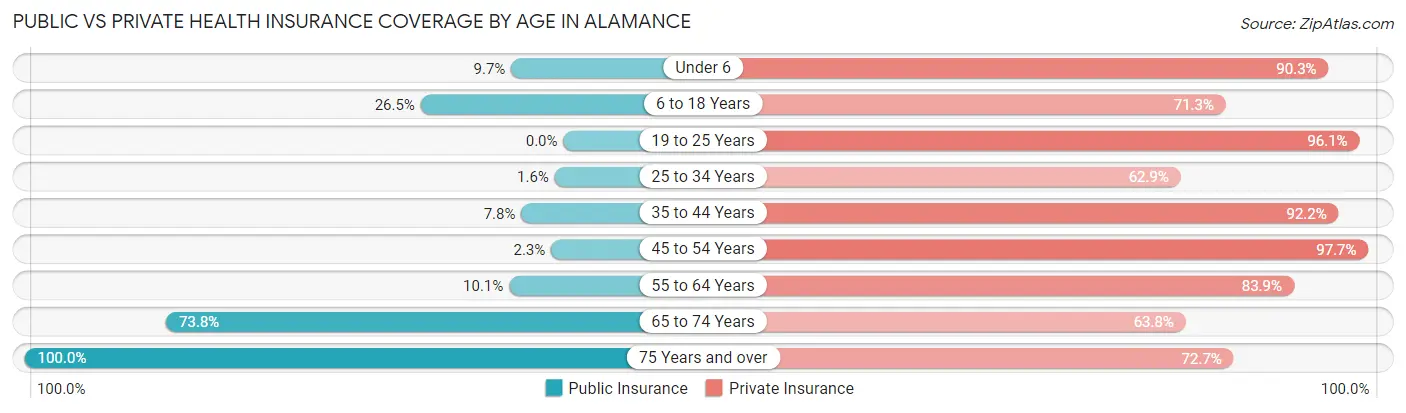
| Age Bracket | Public Insurance | Private Insurance |
| Under 6 | 9 (9.7%) | 84 (90.3%) |
| 6 to 18 Years | 94 (26.5%) | 253 (71.3%) |
| 19 to 25 Years | 0 (0.0%) | 49 (96.1%) |
| 25 to 34 Years | 1 (1.6%) | 39 (62.9%) |
| 35 to 44 Years | 16 (7.8%) | 189 (92.2%) |
| 45 to 54 Years | 4 (2.3%) | 172 (97.7%) |
| 55 to 64 Years | 15 (10.1%) | 125 (83.9%) |
| 65 to 74 Years | 104 (73.8%) | 90 (63.8%) |
| 75 Years and over | 55 (100.0%) | 40 (72.7%) |
| Total | 298 (23.2%) | 1,041 (80.9%) |
Disability Status by Sex by Age in Alamance
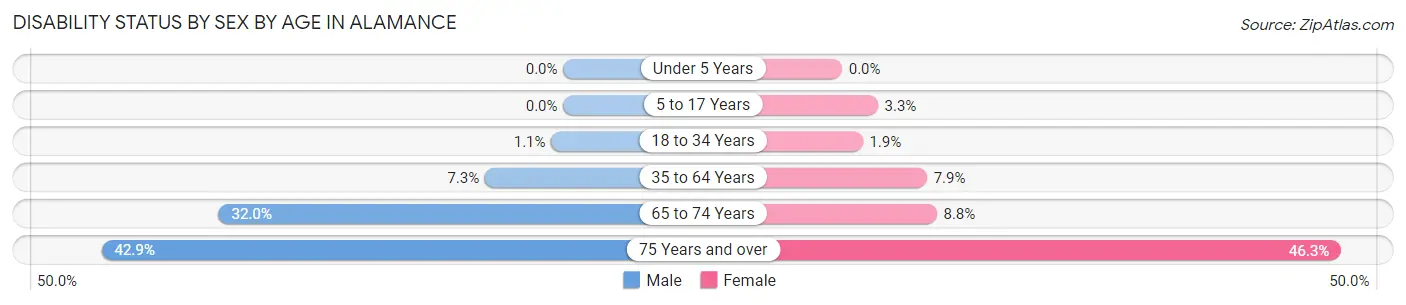
| Age Bracket | Male | Female |
| Under 5 Years | 0 (0.0%) | 0 (0.0%) |
| 5 to 17 Years | 0 (0.0%) | 8 (3.3%) |
| 18 to 34 Years | 1 (1.1%) | 1 (1.9%) |
| 35 to 64 Years | 21 (7.3%) | 19 (7.9%) |
| 65 to 74 Years | 16 (32.0%) | 8 (8.8%) |
| 75 Years and over | 6 (42.9%) | 19 (46.3%) |
Disability Class by Sex by Age in Alamance
Disability Class: Hearing Difficulty
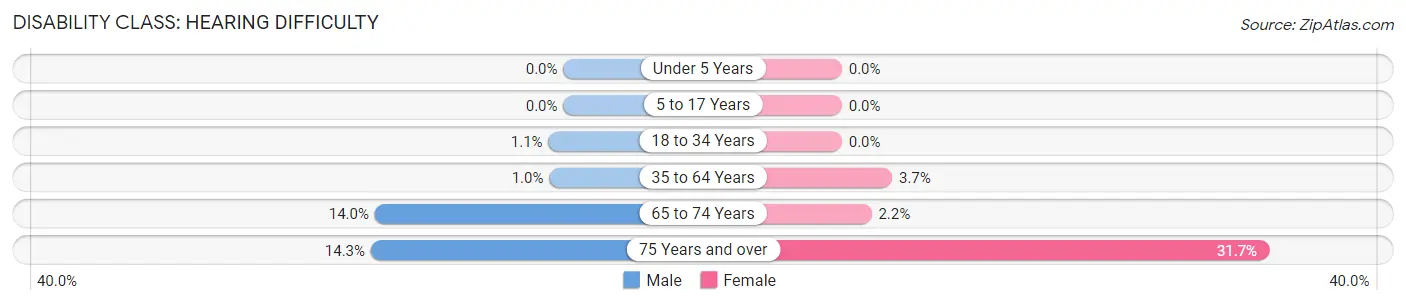
| Age Bracket | Male | Female |
| Under 5 Years | 0 (0.0%) | 0 (0.0%) |
| 5 to 17 Years | 0 (0.0%) | 0 (0.0%) |
| 18 to 34 Years | 1 (1.1%) | 0 (0.0%) |
| 35 to 64 Years | 3 (1.0%) | 9 (3.7%) |
| 65 to 74 Years | 7 (14.0%) | 2 (2.2%) |
| 75 Years and over | 2 (14.3%) | 13 (31.7%) |
Disability Class: Vision Difficulty
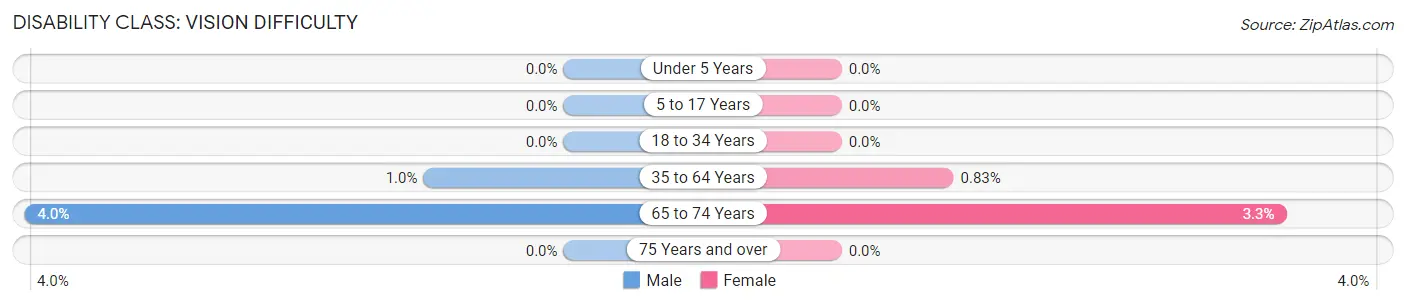
| Age Bracket | Male | Female |
| Under 5 Years | 0 (0.0%) | 0 (0.0%) |
| 5 to 17 Years | 0 (0.0%) | 0 (0.0%) |
| 18 to 34 Years | 0 (0.0%) | 0 (0.0%) |
| 35 to 64 Years | 3 (1.0%) | 2 (0.8%) |
| 65 to 74 Years | 2 (4.0%) | 3 (3.3%) |
| 75 Years and over | 0 (0.0%) | 0 (0.0%) |
Disability Class: Cognitive Difficulty
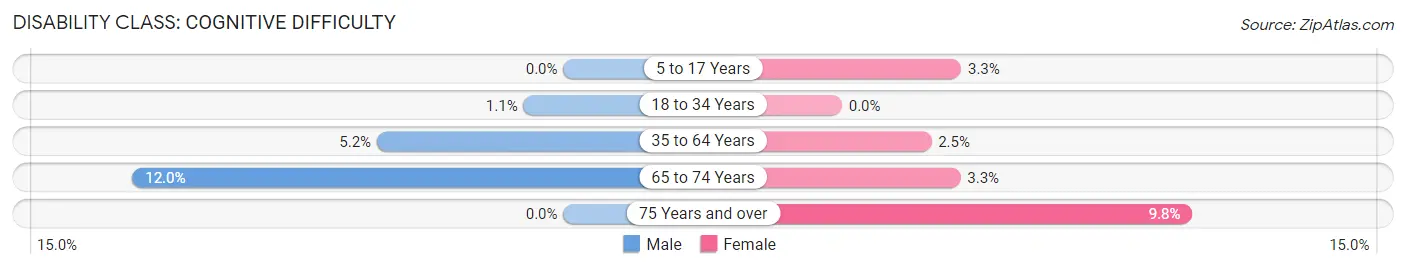
| Age Bracket | Male | Female |
| 5 to 17 Years | 0 (0.0%) | 8 (3.3%) |
| 18 to 34 Years | 1 (1.1%) | 0 (0.0%) |
| 35 to 64 Years | 15 (5.2%) | 6 (2.5%) |
| 65 to 74 Years | 6 (12.0%) | 3 (3.3%) |
| 75 Years and over | 0 (0.0%) | 4 (9.8%) |
Disability Class: Ambulatory Difficulty
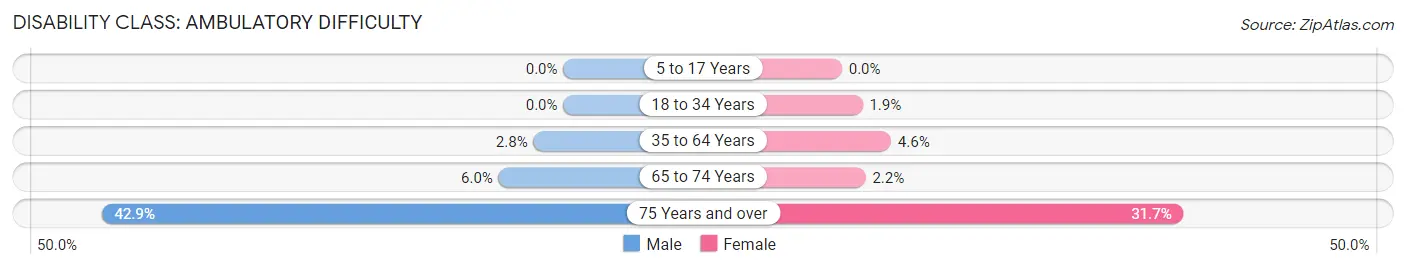
| Age Bracket | Male | Female |
| 5 to 17 Years | 0 (0.0%) | 0 (0.0%) |
| 18 to 34 Years | 0 (0.0%) | 1 (1.9%) |
| 35 to 64 Years | 8 (2.8%) | 11 (4.6%) |
| 65 to 74 Years | 3 (6.0%) | 2 (2.2%) |
| 75 Years and over | 6 (42.9%) | 13 (31.7%) |
Disability Class: Self-Care Difficulty
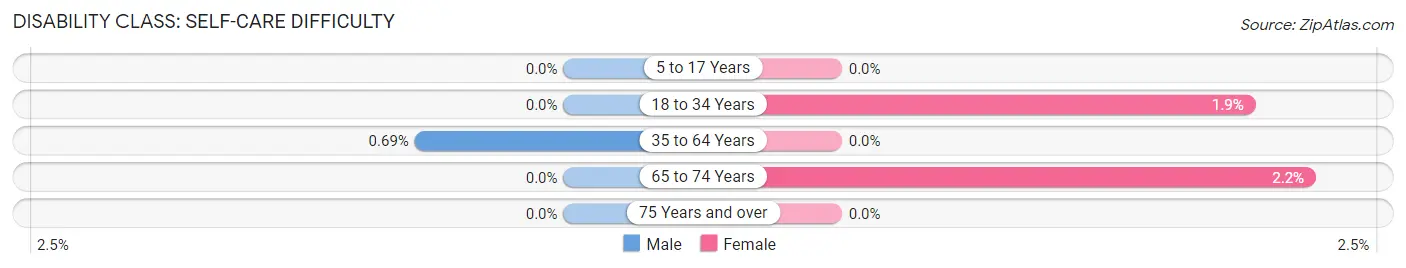
| Age Bracket | Male | Female |
| 5 to 17 Years | 0 (0.0%) | 0 (0.0%) |
| 18 to 34 Years | 0 (0.0%) | 1 (1.9%) |
| 35 to 64 Years | 2 (0.7%) | 0 (0.0%) |
| 65 to 74 Years | 0 (0.0%) | 2 (2.2%) |
| 75 Years and over | 0 (0.0%) | 0 (0.0%) |
Technology Access in Alamance
Computing Device Access in Alamance
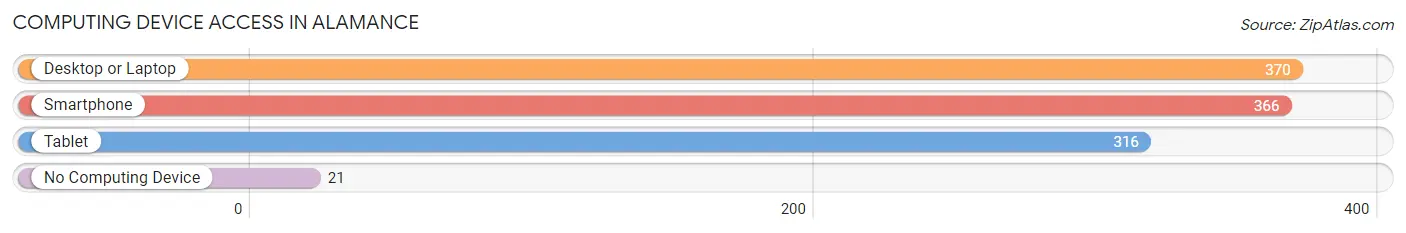
| Device Type | # Households | % Households |
| Desktop or Laptop | 370 | 90.5% |
| Smartphone | 366 | 89.5% |
| Tablet | 316 | 77.3% |
| No Computing Device | 21 | 5.1% |
| Total | 409 | 100.0% |
Internet Access in Alamance
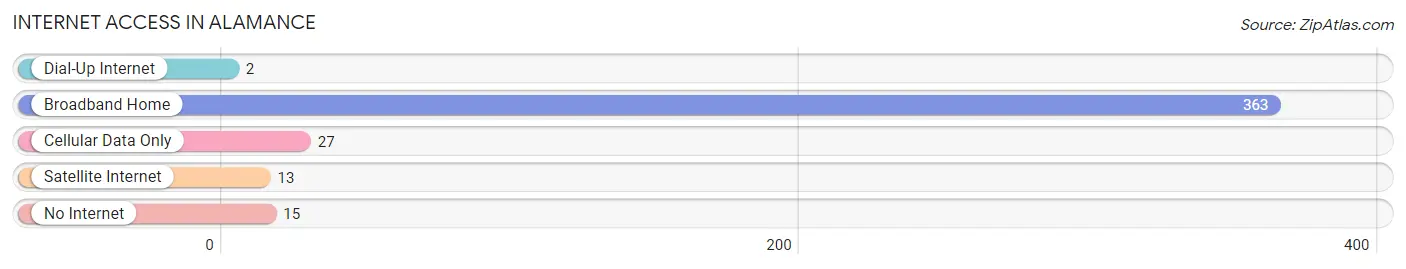
| Internet Type | # Households | % Households |
| Dial-Up Internet | 2 | 0.5% |
| Broadband Home | 363 | 88.7% |
| Cellular Data Only | 27 | 6.6% |
| Satellite Internet | 13 | 3.2% |
| No Internet | 15 | 3.7% |
| Total | 409 | 100.0% |
Alamance Summary
Alamance County is located in the Piedmont region of North Carolina, and is part of the Burlington Metropolitan Statistical Area. The county was formed in 1849 from Orange County and named after Great Alamance Creek, which runs through the county. The county seat is Graham, and the largest city is Burlington.
Geography
Alamance County is located in the Piedmont region of North Carolina, and is part of the Burlington Metropolitan Statistical Area. The county is bordered by Orange County to the north, Chatham County to the east, Randolph County to the south, and Guilford County to the west. The county covers an area of 437 square miles, and is home to a population of approximately 151,131 people. The terrain of the county is mostly rolling hills, with the highest point being Pilot Mountain at 1,067 feet. The county is home to several rivers and creeks, including the Haw River, Great Alamance Creek, and Little Alamance Creek.
History
Alamance County was formed in 1849 from Orange County and named after Great Alamance Creek, which runs through the county. The county was home to several Native American tribes, including the Catawba, Saponi, and Occaneechi. The first European settlers arrived in the area in the late 17th century, and the county was officially established in 1849. During the Civil War, Alamance County was the site of the Battle of Alamance, which was fought between the Confederate and Union forces.
Economy
The economy of Alamance County is largely based on manufacturing and agriculture. The county is home to several large manufacturing companies, including LabCorp, Honda Aircraft Company, and Volvo Trucks North America. Agriculture is also an important part of the county’s economy, with the main crops being corn, soybeans, and tobacco. The county is also home to several educational institutions, including Elon University, Alamance Community College, and the University of North Carolina at Greensboro.
Demographics
As of the 2010 census, the population of Alamance County was 151,131, with a population density of 344 people per square mile. The racial makeup of the county was 79.2% White, 14.3% African American, 0.5% Native American, 2.2% Asian, 0.1% Pacific Islander, 2.2% from other races, and 1.5% from two or more races. The median household income was $45,945, and the median family income was $54,945. The per capita income was $22,945.
Conclusion
Alamance County is a vibrant and diverse county located in the Piedmont region of North Carolina. The county is home to a population of approximately 151,131 people, and is largely based on manufacturing and agriculture. The county is home to several large companies, educational institutions, and is the site of the Battle of Alamance. The county is also home to a diverse population, with a median household income of $45,945 and a median family income of $54,945.
Common Questions
What is Per Capita Income in Alamance?
Per Capita income in Alamance is $37,233.
What is the Median Family Income in Alamance?
Median Family Income in Alamance is $110,938.
What is the Median Household income in Alamance?
Median Household Income in Alamance is $93,309.
What is Income or Wage Gap in Alamance?
Income or Wage Gap in Alamance is 12.2%.
Women in Alamance earn 87.8 cents for every dollar earned by a man.
What is Inequality or Gini Index in Alamance?
Inequality or Gini Index in Alamance is 0.35.
What is the Total Population of Alamance?
Total Population of Alamance is 1,287.
What is the Total Male Population of Alamance?
Total Male Population of Alamance is 614.
What is the Total Female Population of Alamance?
Total Female Population of Alamance is 673.
What is the Ratio of Males per 100 Females in Alamance?
There are 91.23 Males per 100 Females in Alamance.
What is the Ratio of Females per 100 Males in Alamance?
There are 109.61 Females per 100 Males in Alamance.
What is the Median Population Age in Alamance?
Median Population Age in Alamance is 40.4 Years.
What is the Average Family Size in Alamance
Average Family Size in Alamance is 3.5 People.
What is the Average Household Size in Alamance
Average Household Size in Alamance is 3.1 People.
How Large is the Labor Force in Alamance?
There are 570 People in the Labor Forcein in Alamance.
What is the Percentage of People in the Labor Force in Alamance?
63.3% of People are in the Labor Force in Alamance.
What is the Unemployment Rate in Alamance?
Unemployment Rate in Alamance is 0.2%.